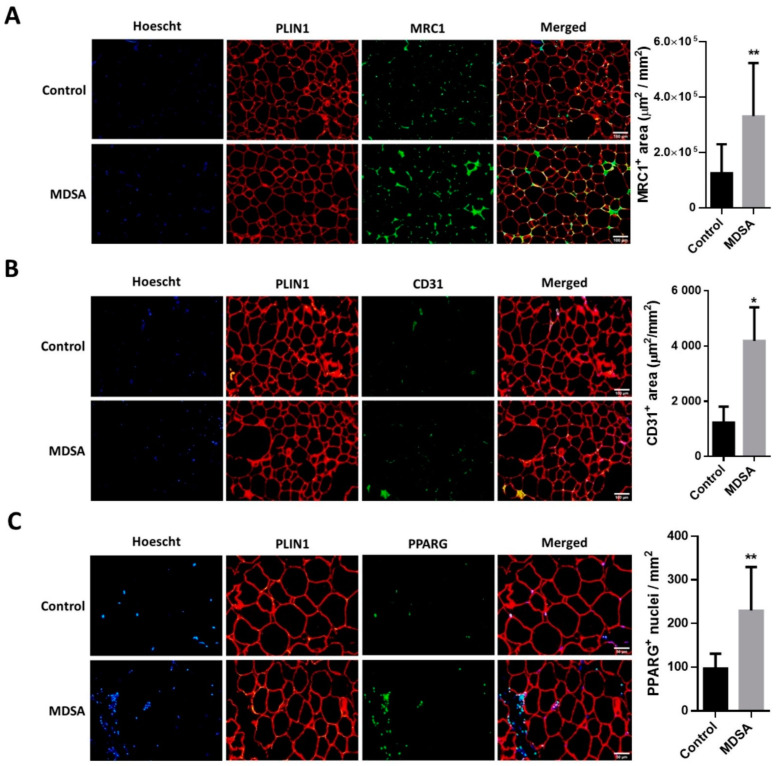
Figure 4.
Immunofluorescence analysis in VAT and representative photomicrographs at magnification ×10 of: (A) MRC1+, M2-like infiltrating macrophages and (B) CD31 positive cells. (C) Immunofluorescence detection and representative photomicrographs at magnification ×20 of PPARG positive nuclei in VAT. Quantifications are presented as the average surface ± SD of positive area stained per mm2 and compared by Student’s t-test, or as the average number of positive nuclei ± SD per mm2 and compared by Mann–Whitney U test. The counterstaining of nuclei (Hoescht) is shown in blue and PLIN1 in red. * = p < 0.05; ** = p < 0.001.

