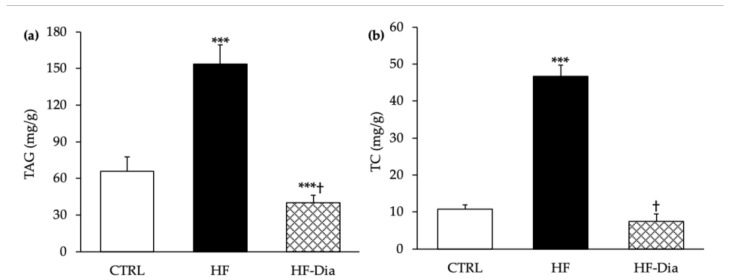
Figure 5.
Effects of D. lutheri supplementation on liver triglyceride (a) and cholesterol (b) levels. CTRL, control group; HF, high-fat group; HF-Dia, high-fat group supplemented with D. lutheri; TAG, triacylglycerol; TC, total cholesterol. Values are means (n = 6), with standard deviations represented by vertical bars. Statistical significance was determined using ANOVA with post hoc Fisher’s test and mean values were significantly different from those of the CTRL group with *** p < 0.001. † Significant difference compared with the HF group (p < 0.05).

