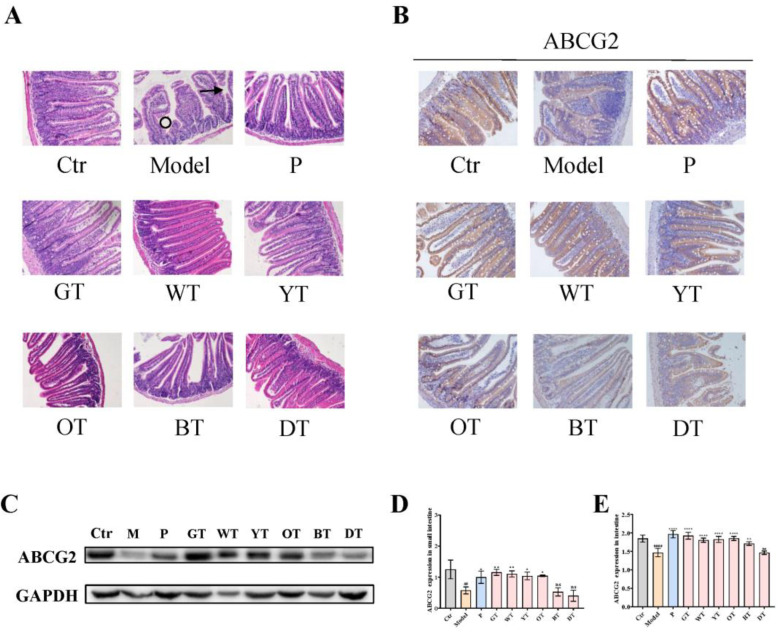
Figure 6.
Mechanism of TWEs on UA metabolism in the small intestine. (A) Representative H&E-stained small intestine tissue images of different treatment groups: arrows indicate villous shedding and circles indicate abnormal crypt structure (200×). Representative immunoblots (B) and IHC (C) images of ABCG2 expression in the small intestine. Quantification of ABCG2 expression by Western blotting (D) and IHC (E). The data are expressed as mean ± SD. ## p < 0.01, #### p < 0.0001 were compared with the control, ns p > 0.1, * p < 0.1, ** p < 0.001, **** p < 0.0001 were compared with the model.

