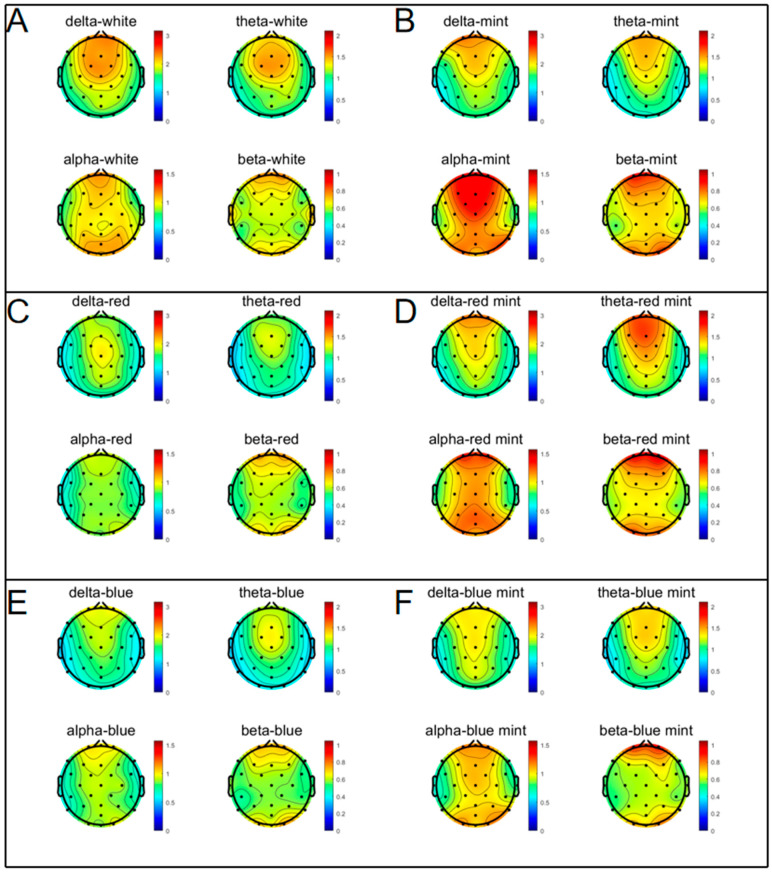
Figure 1.
EEG spectral spectrograms before and after inhalation of EOs. Using FFT in EEGLAB software, the brain activity of 20 subjects in the same microstate was summarised as a spectrogram. (A) White without PEO. (B) White with PEO. (C) Red without PEO. (D) Red with PEO. (E) Blue without PEO. (F) Blue with PEO. Significant changes occurred in each region during the inhalation of EOs.

