

Abstract
Although several microorganisms that produce and degrade methanethiol (MT) and dimethyl sulfide (DMS) have been isolated from various habitats, little is known about the numbers of these microorganisms in situ. This study reports on the identification and quantification of microorganisms involved in the cycling of MT and DMS in freshwater sediments. Sediment incubation studies revealed that the formation of MT and DMS is well balanced with their degradation. MT formation depends on the concentrations of both sulfide and methyl group-donating compounds. A most-probable number (MPN) dilution series with syringate as the growth substrate showed that methylation of sulfide with methyl groups derived from syringate is a commonly occurring process in situ. MT appeared to be primarily degraded by obligately methylotrophic methanogens, which were found in the highest positive dilutions on DMS and mixed substrates (methanol, trimethylamine [TMA], and DMS). Amplified ribosomal DNA restriction analysis (ARDRA) and 16S rRNA gene sequence analysis of the total DNA isolated from the sediments and of the DNA isolated from the highest positive dilutions of the MPN series (mixed substrates) revealed that the methanogens that are responsible for the degradation of MT, DMS, methanol, and TMA in situ are all phylogenetically closely related to Methanomethylovorans hollandica. This was confirmed by sequence analysis of the product obtained from a nested PCR developed for the selective amplification of the 16S rRNA gene from M. hollandica. The data from sediment incubation experiments, MPN series, and molecular-genetics detection correlated well and provide convincing evidence for the suggested mechanisms for MT and DMS cycling and the common presence of the DMS-degrading methanogen M. hollandica in freshwater sediments.
The cycling of dimethyl sulfide (DMS) and methanethiol (MT) has been intensively studied due to the impact the oxidation products of these compounds (e.g., methanesulfonic acid and SO2) have on the processes of global warming, acid precipitation, and the global sulfur cycle (1, 3, 24). Previous research revealed that MT and DMS were the dominant volatile organic sulfur compounds (VOSC) in freshwater sediments and water columns (20). Fluxes of MT and DMS to the atmosphere depend on the steady-state concentrations of these compounds in the sediment and water surface layers. These steady-state concentrations are the result of biological (and chemical) production and degradation. Various studies reported that microbial production and degradation of these VOSC in freshwater, marine, estuarine, and salt lake sediments are relatively well balanced (15–18, 20–23; B. P. Lomans, J.-J. Wesselink, P. Bakkes, A. Pol, C. van der Drift, and H. J. M. Op den Camp, submitted for publication). In anaerobic freshwater sediments, formation of MT and DMS has been demonstrated to occur mainly by methylation of sulfide (7, 20–23; Lomans et al., submitted) and to a lesser extent by the degradation of sulfur-containing amino acids (14, 33, 34, 37). Several organisms capable of anaerobic sulfide methylation during degradation of methoxylated aromatic compounds have been isolated and characterized (2, 10, 28, 29; Lomans et al., submitted).
Degradation of MT and DMS in freshwater sediments has been ascribed primarily to methanogenic activity (20–23, 37, 38). However, sulfate-reducing bacteria are also supposed to be involved in VOSC degradation especially in sulfate-rich freshwater sediments (22). Recently, methanogenic archaeon Methanomethylovorans hollandica was isolated from a freshwater sediment with DMS as the carbon and energy source (23).
Although various bacteria and Archaea involved in the cycling of MT and DMS have been isolated from various habitats, little is known about the composition of the sulfur-cycling microbial communities in these ecosystems. Van der Maarel and Hansen (35) demonstrated (by most-probable number [MPN] series) that a significant population of MT- and DMS-degrading methanogens (0.3 × 10⁶ to 11 × 106 cells per g dry weight) was present in estuarine sediments. Different morphologies were observed in the highest positive dilutions when different substrates were used. Similar MPN counts with trimethylamine (TMA), acetate, or H2-CO2 as the substrate performed with salt marsh sediment samples revealed that methanogens made up only a minor part (0.5 to 1%) of the total bacterial population and that the methanogenic population was composed of at least three groups of nearly equal sizes (9). One group was represented by cocci that were able to utilize TMA but that were unable to use H2 or acetate. The second group (mainly rods and plate-shaped cells) consisted of methanogens which utilized H2 but not TMA or acetate. There was also a population of Methanosarcina-like Archaea present; these organisms could utilize TMA, acetate, and H2. In both studies no clear seasonal pattern of the numbers of methanogens was found. To our knowledge no data concerning the numbers of bacteria and Archaea involved in the cycling of MT and DMS in freshwater sediments have been described in the literature.
In this paper, a survey of the microbial flora involved in VOSC metabolism in a number of different freshwater sediments is given. Slurry incubations were performed to study the endogenous activity of MT and DMS cycling with special emphasis on methanogenic degradation. The number of bacteria or Archaea involved was estimated by MPN series. Finally the identity of the MT- and DMS-degrading methanogenic population was investigated by amplified ribosomal DNA restriction analysis (ARDRA), nested PCR, and sequence analysis.
MATERIALS AND METHODS
Source of inocula.
Sediment samples were collected from various freshwater systems in The Netherlands. The sediment samples were transferred by suction to anaerobic bottles as described previously (20). The sampling and dispensing of the sediment slurries were done with new and sterilized equipment to avoid cross contamination of the samples in the MPN counting and ARDRA. The sediment slurries collected were used for incubation experiments, MPN series, and molecular detection of DMS-producing and -degrading microorganisms as indicated in Fig. 1.
FIG. 1.

Scheme showing the treatment and various analyses performed with the 10 freshwater sediments.
The origin and several important characteristics determined for all sediment slurries are given in Table 1. After purging the pore water with N2 for 15 min to remove volatile sulfur compounds (e.g., H2S), concentrations of total sulfur, free iron (ferric plus ferrous), phosphorus, and manganese were analyzed as described before (20, 31).
TABLE 1.
The origin and main characteristics of the sediment samples collected from various freshwater systems in The Netherlands
| Sediment no. | Origin | Typical characteristicsa | Dry wtb (mg/ml) | Concn (μM)c of:
|
||||
|---|---|---|---|---|---|---|---|---|
| H2S | Total Mn | Total Fe | Total P | Total S | ||||
| 1 | Zegveld I | OR, SR | 60 | 166 (158–182) | 0.52 | 4.8 | 69 | 1,620 |
| 2 | Zegveld II | OR, SR | 39 | 162 (139–186) | 0.06 | 1.6 | 42 | 1,331 |
| 3 | Hatertse Vennen | OR, FR | 11 | 15 (6–26) | 0.58 | 10.8 | 6 | 83 |
| 4 | Bruuk I | OR, FR | 52 | 0 (0–1) | 0.36 | 37.3 | 24 | 753 |
| 5 | Bruuk II | OR, SR | 63 | 226 (134–301) | 0.07 | 1.7 | 22 | 1,372 |
| 6 | Dekkerswald | OR, SR | 14 | 171 (135–237) | 0.83 | 2.3 | 501 | 647 |
| 7 | Breukelen | OR, SR | 116 | 53 (15–105) | 1.05 | 17.5 | 57 | 1,159 |
| 8 | Tienhoven I | OR, SR, FR | 22 | 3 (2–3) | 0.26 | 17.5 | 18 | 620 |
| 9 | Tienhoven II | OR | 66 | 6 (3–8) | 0.13 | 5.5 | 18 | 686 |
| 10 | Maarssen | OR | 23 | 18 (10–25) | 0.20 | 2.3 | 26 | 966 |
OR, organic rich (range: 6.4 to 53.9% of the dry weight); SR, sulfide rich; FR, iron rich. pH range of the sediments: 6.5 to 7.8.
As estimated from sediment slurries.
Concentrations of manganese, total dissolved iron (Fe2+ and Fe3+), total dissolved P, and total dissolved S were determined from the pore water of the slurries. Those of H2S (ranges are in parentheses) were estimated from sediment slurries (detection limit, 0.2 μM).
Slurry incubations.
Sediment slurries were prepared and dispensed in anaerobic bottles as described previously (20). Additions were made from neutral-pH stock solutions prepared in distilled water. These additions included bromoethanesulfonic acid (BES; final concentration, 2.5 mM), sodium tungstate (final concentration, 2.0 mM), and syringate (final concentration, 0.1 mM). The sediment slurries (duplicates or triplicates) were incubated in the dark without shaking at 30°C. Sterilized sediment slurries (121°C, 20 min) served as abiotic controls. Methane formation rates were determined from control slurries. In control slurries VOSC concentrations were mostly below the detection limit. Therefore, rates of MT and DMS formation under various conditions were determined from slurries amended with BES (or BES plus tungstate) and BES plus syringate, respectively. Gas samples were analyzed for H2S, MT, DMS, and methane as described before (5, 12, 20).
MPN counting.
The numbers of bacteria involved in the cycling of MT and DMS were determined by MPN series. Before the survey of various sediments, the protocol for disruption of bacterial aggregates was optimized. This resulted in the following protocol: samples were mixed on a vortex for 2 min in the presence of 5 mM pyrophosphate, left standing for 100 min, mixed with an Ultra-Turrax for 2 min (under N2 atmosphere), and used for inoculation. The dominant microorganisms involved in the degradation of methoxylated aromatic compounds were studied by MPN series with anaerobic medium supplemented with syringate. Screening for positive dilutions was done by measurement of MT and DMS production and turbidity. Positive dilutions (determined by turbidity) were amended again with H2S, syringate, and BES to avoid methanogenesis from MT and DMS, thereby facilitating the detection of VOSC accumulation. The type and number of the MT- and DMS-consuming bacteria were determined by MPN series with the anaerobic medium described by Widdel and Bak (36) supplemented with DMS, as was used for isolation of M. hollandica (22). Analysis of anaerobic methylotrophic bacteria was done by MPN series with the same medium supplemented with methanol, TMA, and DMS. Screening the highest positive dilution was done by the measurement of MT and DMS disappearance, methane formation, and turbidity. The MPN numbers were estimated using the tables of De Man (4).
ARDRA.
The presence of M. hollandica-like organisms was determined by molecular analysis of the total DNA isolated from the sediment slurries using PCR primers specific for the amplification of the 16S rRNA gene of Archaea, followed by restriction analysis with restriction enzyme HindIII. After gel electrophoresis this procedure resulted in a M. hollandica-specific band pattern. The procedure described by Großkopf et al. (11) was used to isolate the total DNA of the sediment slurries. For further purification 20 μl of the DNA solution was incubated with 1 μl of RNase stock solution (10 μg/μl) for 15 min at 37°C. Then 250 μl of Sepha-glass bead suspension of the FlexiPrep kit (Pharmacia P-L Biochemicals Inc.) was added. The mixture was mixed and incubated for 1 min at room temperature. The glass beads with the bound DNA were pelleted by centrifugation (30 s; 10,000 × g) and washed two times in 200 μl of washing buffer of the FlexiPrep kit (Pharmacia P-L Biochemicals Inc.) and finally once in 300 μl of 70% ethanol. After the removal of the ethanol the glass bead-DNA pellet was dried for 10 min. To dissolve the DNA attached to the glass beads, 50 μl of distilled water was added. Glass beads must be removed by centrifugation before freezing the purified DNA samples at −20°C for storage. It was verified that this method gives the maximum quantity of high-molecular-weight DNA from the M. hollandica cells added. Cells were added after sterilization (15 min, 115°C), DNase treatment, and a second sterilization of the slurry (15 min, 115°C) to destroy all DNase activity.
Dilutions (100- to 1,000-fold) of the DNA samples were used as templates for PCR amplification of an approximately 874-bp PCR product of the 16S rRNA gene (PCR conditions: [Mg2+] = 2.5 mM; annealing temperature = 50°C; 35 cycles). The primers used for amplification were 1AFOR (5′-TCYG[G/T]TTGATCCYG[G/C]CRGAG-3′) and ARC915 (5′-GTGCTCCCCCGCCAATTCCT-3′) (30). PCRs were performed in the presence of bovine serum albumin (final concentration, 400 ng/μl of PCR mixture) to avoid inhibition of Taq polymerase (19). A highly specific ARDRA band pattern could be obtained by HindIII digestion of the PCR product (see Results).
Similar ARDRAs were also performed with the DNA isolated from the highest positive dilutions from the MPN series with mixed substrates (methanol, TMA, and DMS).
Nested PCR.
On basis of the known 16S rRNA sequence of M. hollandica strain DMS1, a strain-specific primer, DMS1 209 (5′-ACCGTGGTCGAAAGCTTTT-3′), was designed (Fig. 2). A nested PCR on the PCR product of the amplification with 1AFOR and ARC915 (see above) using primer DMS1 209 and a primer specific for the genera within the family. Methanosarcinaceae, MSMX860 (30) was performed under conditions ([Mg2+] = 4.5 mM; annealing temperature = 69°C; 35 cycles) which result in the amplification of the 16S rRNA gene of M. hollandica only, generating a specific PCR product of 645 bp. The strain specificity of nested PCR was optimized in a manner similar to that for ARDRA mentioned above, using DNA samples isolated from a mixture of M. hollandica and Methanosarcina barkeri cells added to sterile and DNA-free sediment. After the nested PCR, the product was subjected to polyacrylamide gel electrophoresis (PAGE) and cloned in a TA cloning vector.
FIG. 2.

Partial alignment of the 16S rRNA gene sequences of M. hollandica and various closely related methanogens, which illustrates the location of the HindIII restriction site (boldface) and the primer site of strain-specific primer DMS1 209 (underlined) on the 16S rRNA gene of M. hollandica strain DMS1. The numbers above the alignment indicate the positions of the first and final base pairs within the complete 16S rRNA sequence of M. hollandica. Mc., Methanococcoides; Mh., Methanohalophilus; Ml., Methanolobus; Msae., Methanosaeta; Ms., Methanosarcina; M., Methanobacterium.
Sequence analysis.
Partial 16S rRNA sequences from the highest positive dilutions of the MPN series of all sediments were determined by isolating the DNA from the tubes followed by PCR resulting in an 874-bp PCR product (PCR primers: IAFORMS [5′-TCTGGTTGATCCTGCCAGAG-3′]. and ARC915; PCR conditions: [Mg2+] = 2.5 mM; annealing temperature = 50°C; 35 cycles). The sequence was determined using the Taq DyeDeoxy terminator cycle sequencing method (27; Taq DyeDeoxy terminator cycle sequencing kit user bulletin 901497, revision E, Applied Biosystems, Inc., Foster City, Calif.) on a DNA sequencer (Applied Biosystems; model 373A). Sequence analysis of the PCR products from the nested PCR on total DNA samples of the sediments was performed in a similar way.
Phylogenetic analysis.
The resulting sequences were aligned with homologous 16S rRNA sequences of closely related microorganisms (as indicated by BLASTN and FASTA database searches) by using the Pileup method (Dutch CMBI Facility, Nijmegen, The Netherlands). These 16S rRNA sequences were obtained from the GenBank/EMBL and the Ribosomal Database Project (RDP) databases. Distance matrix trees were constructed by using the method of Fitch and Margoliash (8) and the neighbor-joining method of Saitou and Nei (32) in the FITCH and NEIGHBOR programs of the PHYLIP (version 3.4) program package (6). Parsimony and bootstrap parsimony analyses were performed using the DNAPARS and DNABOOT programs as implemented in the PHYLIP package.
Accession numbers.
The 16S rRNA sequences used for phylogenetic analysis have the following EMBL/GenBank/RDP accession numbers: Methanosaeta concilii, M59146; Methanosaeta soehngenii, X16932; Methanosaeta thermoacetophila, M59141; Methanococcoides methylutens, M59127; Methanococcoides burtonii, X65537; Methanohalophilus sp., M59132; Methanohalophilus euhalobius, X98192; Methanohalophilus mahii, M59133; Methanosalsus zhilinae, RDP:Mha.zhilin; Methanohalobium evestigatum, U20149; Methanosarcina thermophila, M59140; Methanosarcina sp., M59136; Methanosarcina barkeri Sar, AF028692; Methanosarcina barkeri DSM800, AJ012094; Methanosarcina acetivorans, M59137; Methanosarcina siciliae T4/M, U20153; Methanosarcina siciliae C2J, U89773; Methanosarcina mazei, AJ12095; Methanosarcina frisia, M59138; Methanosarcina semesiae, AJ012742; Methanomethylovorans hollandica, AF120163; Methanolobus taylorii, U20154; Methanolobus oregonensis, U20152; Methanolobus vulcani, U20155; Methanolobus bombayensis, U20148; Methanolobus tindarius, M59135.
RESULTS
Sediment characterization.
Results of the sediment analyses are compiled in Table 1. The concentration of total sulfide present in the pore water (H2S plus HS−) is about twice the concentration of dissolved H2S, since the pH of most slurries was about 6.5, which is close to the pKH2S (6.52). The concentration of total sulfur in the pore water approximated the sulfate concentration since pore water samples were purged intensively to remove volatile sulfur compounds and sulfate is assumed to be the major dissolved-sulfur compound. H2S concentrations appeared to be highest in sediments collected from Zegveld I and II, Bruuk II, Dekkerswald, and Breukelen (166, 162, 226, 171, and 53 μM, respectively). Total sulfide concentrations in the other sediments were below 26 μM. Sulfide concentrations in sediments from the sulfide-rich ditch of Bruuk II decreased dramatically during the incubation, whereas in the sediment of Dekkerswald they increased (data not shown). In the other sulfide-rich sediments concentrations of sulfide remained more or less constant. Sulfide-rich slurries also generally had high concentrations of total sulfur, indicating that large amounts of sulfate were present. An exception is that from Dekkerswald sediment, which had only a moderate total sulfur concentration. Sediment slurries with high total free-iron concentrations had low levels of free total sulfide (Hatertse Vennen, Bruuk I, and Tienhoven I). In sediment slurries from Breukelen, moderately high sulfide concentrations coincided with high total free-iron concentrations (Table 1). Concentrations of total phosphorus ranged from 6 to 69 μM and were extremely high in the sediment slurry collected from Dekkerswald (501 μM).
Slurry incubations.
Endogenous methane formation was studied by incubating the sediment slurries without addition (controls). In all sediments tested, methane increased significantly within 192 h of incubation. The methane formation rate, however, differed among the sediments tested and ranged from 7.5 to 84.9 nmol per ml of sediment slurry per h (Table 2) (equal to 0.1 to 6.1 nmol per mg of dry matter per h). Slurries prepared from Dekkerswald sediment gave the highest values of all. In none of the control slurry incubations (no additions) were significant amounts of MT and DMS detected (<0.3 μM). The production of MT by sediment slurries was estimated after addition of BES or BES plus tungstate. Addition of BES resulted in an immediate increase of MT in all sediments tested. In sediments where MT reached high levels, DMS also started to accumulate. In sediment slurries with high concentrations of total sulfur (mainly sulfate) that were inhibited with BES, addition of tungstate slightly enhanced the MT accumulation in 7 out of 10 sediments. As was the case for methane, endogenous formation of MT in the sediment collected from Dekkerswald (328 pmol per ml of sediment slurry per h and 23.4 pmol per mg of dry matter per h) was dramatically higher than that in the other sediments (7.1 to 52.4 pmol per ml of sediment slurry per h; 0.2 to 1.6 pmol per mg of dry matter per h) (Table 2). Addition of syringate to BES-inhibited slurries resulted in enhanced MT accumulation rates in all sediments except those from Dekkerswald and Maarssen compared to BES addition alone. The increase of MT accumulation due to the addition of both BES and syringate was highest in the sediments collected from Zegveld I, Bruuk II, and Breukelen. The amounts of methane that were produced from MT under normal (noninhibited) conditions in the various sediments were less than 0.4% of the total methane produced under these conditions (Table 2).
TABLE 2.
Maximum endogenous formation rates of methane and MT determined from slurries prepared from various sediments and incubated under different conditions
| Sediment origin | Rate of formation of:
|
CH4 from MTa (%) | |||||||
|---|---|---|---|---|---|---|---|---|---|
| CH4 (nmol/ml of sediment slurry/h) after addition ofb:
|
MT (pmol/ml of sediment slurry/h) after addition ofb:
|
||||||||
| Nothing (control) | BES | BES + tungstate | BES + syringate | Nothing (control) | BES | BES + tungstate | BES + syringate | ||
| Zegveld I | 19.1 | 4.5 | 4.1 | 4.4 | 1.0 | 19.9 | 24 | 80.1 | 0.11 |
| Zegveld II | 27.5 | 2.8 | 2.8 | 2.0 | 1.8 | 46.3 | 52.4 | 57.1 | 0.15 |
| Hatertse Vennen | 9.1 | 1.0 | 0.5 | 0.5 | <1.0 | 11.5 | 11.2 | 14.5 | 0.11 |
| Bruuk I | 54.4 | 3.2 | 2.9 | 2.9 | <1.0 | 13.7 | 14.7 | 17.9 | 0.02 |
| Bruuk II | 27.2 | 2.3 | 1.6 | 1.6 | 4.7 | 38.1 | 33.1 | 53.9 | 0.10 |
| Dekkerswald | 84.9 | 4.0 | 3.2 | 4.1 | <1.0 | 306 | 328 | 315 | 0.30 |
| Breukelen | 13.0 | 3.1 | 2.9 | 3.1 | <1.0 | 44.3 | 51.7 | 181 | 0.38 |
| Tienhoven I | 7.5 | 0.2 | 0.1 | 0.1 | <1.0 | 7.1 | 7.7 | 8.2 | 0.08 |
| Tienhoven II | 9.1 | 0.6 | 0.5 | 0.5 | <1.0 | 12.8 | 16.1 | 16.2 | 0.14 |
| Maarssen | 12.7 | 0.6 | 0.6 | 0.3 | <1.0 | 35.3 | 31.1 | 28.5 | 0.22 |
The percentage was calculated from known stoichiometry using the amounts of MT formed in the presence of BES and CH4 produced (control values minus BES values).
BES (2.5 mM) was used to inhibit methanogenesis, and tungstate (2 mM) was used to inhibit sulfate-reducing bacteria.
MPN counts.
MPN series with mixed substrates (methanol, TMA, and DMS), series with DMS, and series with syringate were prepared from each of the sediments. The lower dilutions of the MPN series on mixed substrates showed methane formation within several days. Liquid media became turbid within 2 weeks. MPN counts for mixed-substrate series differed dramatically among the various sediments, ranging from 2.3 × 101 to 9 × 10⁵ bacteria per ml of sediment slurry (Table 3). Highest MPN counts were found in slurries of sediments from Zegveld I, Dekkerswald, and Breukelen.
TABLE 3.
MPNs of various freshwater sediments determined with anaerobic media amended with a mixture of methanol, TMA, and DMS, with DMS alone, and with only syringate
| Sediment origin | MPN (no. of bacteria/ml of sediment slurry) on substratea:
|
||
|---|---|---|---|
| MeOH + TMA + DMS | DMS | Syringate | |
| Zegveld I | 4.0 × 10⁵ | 4.0 × 10⁴ | 9.0 × 10³ |
| Zegveld II | 9.0 × 10⁴ | 2.3 × 10⁵ | 4.0 × 10³ |
| Hatertse Vennen | 2.3 × 101 | 0.4 × 101 | 2.3 × 101 |
| Bruuk I | 9.0 × 10³ | 9.0 × 10³ | 4.0 × 10² |
| Bruuk II | 2.3 × 10⁴ | 2.3 × 10³ | 4.0 × 10³ |
| Dekkerswald | 4.0 × 10⁵ | 4.0 × 10⁴ | 2.3 × 10⁵ |
| Breukelen | 9.0 × 10⁵ | 1.5 × 10⁵ | 4.0 × 10⁴ |
| Tienhoven I | 2.3 × 10³ | 9.0 × 10² | 4.0 × 10² |
| Tienhoven II | 9.0 × 10³ | 2.3 × 10³ | 4.0 × 10³ |
| Maarssen | 9.0 × 10⁴ | 9.0 × 10³ | 9.0 × 10³ |
Methylotrophic methanogens were targeted with methanol (MeOH), DMS, and TMA, while MT and DMS producers were targeted by addition of syringate.
Positive tubes of the MPN series with DMS as the substrate were identified by the formation of methane and MT (this compound is formed as an intermediate in the highest dilutions) and consumption of DMS. No significant increase in turbidity was found in this MPN series. MPN counts with DMS as the only substrate were generally lower than counts with mixed substrates and ranged from 0.4 × 101 to 2.3 × 10⁵ bacteria per ml of sediment slurry. Several tubes of MPN series on syringate initially only showed limited MT and DMS formation. Instead methane formation was found. However, after a second addition of syringate plus BES to tube series with liquid medium, MT and DMS formation was enhanced significantly. In almost all cases, the increase in turbidity coincided well with MT and DMS formation. MPN counts for syringate ranged from 2.3 × 101 to 2.3 × 10⁵ bacteria per ml. The highest positive dilutions of the MPN series on mixed substrates (methanol plus TMA and DMS) were transferred several times to fresh media. After three transfers, the substrate specificity of the methanogenic Archaea in these cultures was tested by sequential addition of different methanogenic substrates (methanol, TMA, DMS, acetate, H2-CO2, and finally once again methanol). Methane formation in cultures of all sediments was found only after addition of methanol, TMA, and DMS. Microscopic analysis revealed that the cultures consisted of one morphological type of methanogenic Archaea, which was similar to M. hollandica with respect to its size and the structure of cell clusters and aggregates (23).
ARDRA. (i) Total DNA from sediments.
From each sediment the total DNA was isolated as described in Materials and Methods. These DNA samples, free from humic acids, were analyzed by ARDRA. An Archaea-specific PCR (PCR primers: 1AFOR and ARC915) with the purified DNA of different sediments as templates resulted in each case in the formation of a mixture of PCR products with the expected length (874 bp) which were derived from various species of Archaea present in the sediment. A comparison of the complete 16S rRNA sequence of M. hollandica with those of closely related methanogenic species of Archaea showed that a HindIII restriction site is located at base position 195 (Fig. 2). The specificity of this restriction site was tested by using the “CHECK PROBE” option of the RDP (26), and the restriction site was found to be highly specific for M. hollandica. A HindIII restriction site was also present in the 16S rRNA gene sequences of some members of the genus Methanobacterium at base position 425. Consequently, restriction analysis of the obtained PCR product resulted in an ARDRA band pattern highly specific for M. hollandica-like Archaea (Fig. 3, lane A).
FIG. 3.

ARDRA of the total DNA isolated from the various sediments. The PCR product generated with two Archaea-specific primers (1AFOR and ARC915) was digested with restriction enzyme HindIII. The band pattern with 187- and 874-bp products appeared to be specific for M. hollandica. Loading of the samples: marker, low-molecular-weight marker; A, M. hollandica strain DMS1; B, Methanosarcina barkeri; C, Methanobacterium thermoautotrophicum; D, Methanosphaera cuniculi; 1 to 11, sediments 1 to 11, respectively. Sediments 1 to 10 are described in Table 1; sediment 11 is a sandy organic-poor sediment which is used as a negative control since it is unlikely to contain large numbers of methanogenic Archaea.
Restriction enzyme analysis of the PCR product mixture with HindIII followed by PAGE indeed demonstrated that the digestion products specific for M. hollandica (687 and 187 bp) were present in samples of all sediments (Fig. 3, lanes 6 to 15). The intensities of these bands differed for the various sediments. Band intensities were strong in lanes of sediments from Zegveld I and II, Bruuk II, Dekkerswald, and Breukelen. In sediments from Hatertse Vennen, bands of digestion products were very weak, and bands were absent in a (control) sandy organic-poor sediment. Besides the band pattern typical for M. hollandica, digestion products typical for Methanobacterium species were found (approximately 425 bp). Besides these products a few other unidentified digestion products and a significant amount of undigested PCR product were visible in the various lanes (Fig. 3).
(ii) DNA from highest positive MPN dilutions.
From cell pellets of the highest positive dilutions of the MPN with mixed substrates of all sediments, DNA was isolated using the method described for DNA isolation from pure culture (23) since the method used for sediment samples caused severe shearing of the DNA. ARDRA of these samples similar to that described for sediment samples above demonstrated that in all MPN samples the digestion of the 874-bp PCR product by HindIII resulted in the two digestion products (687 and 187 bp). In contrast to what was found for all other sediments, a significant amount of the PCR product from the Dekkerswald sediment could not be digested (Fig. 4).
FIG. 4.
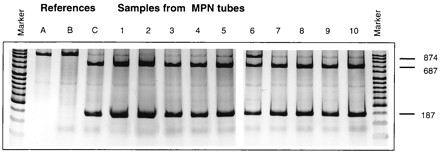
ARDRA of the DNA isolated from highest positive dilutions from the MPN on mixed substrates (methanol, TMA, and DMS) of the various sediments. The PCR product generated with two Archaea-specific primers (1AFOR and ARC915) was digested with restriction enzyme HindIII. The band pattern with 187- and 874-bp products appeared to be specific for M. hollandica. Loading of the samples: marker lanes, low-molecular-weight markers; A, M. hollandica strain DMS1 undigested PCR product; B, Methanosarcina barkeri; C, M. hollandica strain DMS1; 1 to 10, samples of MPN tubes of sediments 1 to 10, respectively (for sediment origin see Table 1).
Nested PCR.
The purified DNA samples obtained from the various sediment samples were also used for a nested PCR specially developed to selectively amplify the 16S rRNA gene of M. hollandica. After PAGE the expected PCR product (645 bp) was found only in the nested-PCR samples of Dekkerwald sediment and Breukelen sediment (data not shown). Sequencing analysis of the PCR product of Dekkerswald sediment revealed that the amplified 16S rRNA fragment was indeed from a methanogen which was closely related to M. hollandica (95 to 97% sequence similarity).
Phylogenetic and taxonomic analysis.
Sequencing the PCR products generated from DNA samples isolated from the highest dilution of the MPN series on mixed substrates of all sediments resulted in 11 partial 16S rRNA sequences, each derived from one of the sediments collected. Database searches revealed that these sequences were closely related to that of M. hollandica (92 to 99% sequence similarity) and showed the typical HindIII site (Fig. 2). For the PCR product of sediment of Dekkerswald, however, it appeared to be necessary to sequence a cloned PCR product, since products of two different methanogens were present. One appeared to be closely related to M. hollandica, and the other appeared to be closely related to Methanosaeta concilii (92 and 96% sequence similarities, respectively). The 11 partial 16S rRNA sequences were aligned (Pileup method) with that of M. hollandica and several homologous 16S rRNA sequences of closely related species of Archaea (from GenBank/EMBL). A phylogenic tree based on an alignment of these partial 16S rRNA sequences demonstrates that the sequences retrieved from the MPN cultures all cluster with that of M. hollandica (Fig. 5).
FIG. 5.

Phylogenetic tree based on a distance matrix prepared from an alignment of partial 16S rRNA sequences (576 bases) of M. hollandica, the sequences obtained from the highest positive dilutions of the MPN on mixed substrates (methanol, TMA, and DMS) (MPN clones), the sequences from the nested PCR of sediment samples of Dekkerswald (nested-PCR clones), and other selected, closely related methanogens. The last were obtained from the GenBank/EMBL/RDP database. Methanosaeta thermoacetophila was used as the outgroup. Sediment numbers correspond to numbers given in Table 1. Scale bar, 10 base substitutions per 100 bases. Names of methanogens which are able to utilize DMS as carbon source are underlined. Bootstrap values above 90 are given.
DISCUSSION
Characterization of the sediment slurries and pore water showed that concentrations of the H2S, total iron, and total sulfur correspond well those determined 2 years earlier (20). Also, the endogenous methane formation rates of the sediment slurries were in the same order of magnitude. Inhibition studies with BES and tungstate showed the balance between the production and degradation of VOSC, the dominant role of methanogens, and the possible role for sulfate-reducing bacteria, a result which is in agreement with previous work on freshwater sediments (20–23, 37, 38). Methanogenesis from VOSC appeared to constitute only a minor fraction (less than 1%) of the total methane produced (20, 37, 38). Apparently, DMS and MT are not important precursors for methane formation in freshwater sediments. In salt marsh sediments it is reported that sulfate-reducing bacteria degrade the major part of VOSC, and here this VOSC-dependent sulfate-reducing activity is about 10% of the total sulfate-reducing activity (14, 17). The significantly higher values for methane and MT formation in the sediment slurry from Dekkerswald compared to those for the other slurries are likely due to the fact that the pond from which this sediment was collected serves as a stabilization pond of a small activated-sludge plant.
Addition of syringate as a methyl group-donating compound enhanced MT and DMS formation in sulfide-rich sediments only. Again Dekkerswald sediment is an exception, because no substrate limitations exist in this system (see above). The absence of an increase in MT and DMS accumulation in sediment slurries with low sulfide concentrations is likely to be due to the fact that MT and DMS formation in these sediments is sulfide limited rather than methyl group limited. These results confirm previous findings that MT and DMS formation occurs mainly by the methylation of sulfide, which is limited by the concentrations of both sulfide and methyl group-donating compounds (18, 20). MPN counts determined for syringate-utilizing organisms are significantly lower than those for the methanogenic Archaea (Table 3).
Except for those for Zegveld II sediment, numbers of methanogenic Archaea determined from dilution series on DMS (0.4 × 101 to 2.3 × 10⁵ cells per ml of sediment slurry) were lower than those on mixed substrates (2.3 × 101 to 9 × 10⁵ cells per ml of sediment slurry). This is probably caused by the fact that biomass formation from DMS is poor, as was also observed during isolation of M. hollandica (23). The highest MPN counts that we found are in the same order of magnitude as those reported in the literature for estuarine, marsh, and mangrove sediments (9, 25, 35). These MPN series therefore showed that, although VOSC-dependent methanogenesis was limited, significant numbers of DMS-degrading methanogens are present in most freshwater sediments.
Analysis of the highest positive dilutions of the series on mixed methylated substrates revealed that the dominant organisms in these dilutions were typical obligate methylotrophs able to produce methane from methanol, TMA, and DMS only. Microscopic and physiological analyses of the highest positive MPN dilutions demonstrate that methylotrophic Archaea similar to M. hollandica are commonly occurring methanogens in freshwater sediments. Considering the fact that in series with mixed substrates morphologically identical organisms are obtained compared to series with only DMS, it is likely that the organisms isolated are responsible for the consumption of methanol, TMA, and DMS in situ.
ARDRA of the total DNA samples isolated from the various sediments revealed that M. hollandica-like Archaea were present in all sediments (Fig. 3), confirming the results of the MPN series. Furthermore, the 425-bp digestion product obtained by ARDRA also indicated the presence of Methanobacterium-like Archaea. Considering the known physiology of the members of this genus, these Archaea are likely to be involved in the degradation of acetate, formate, and H2-CO2. ARDRA, sequence analysis, and analysis of the substrate specificity of the highest positive dilutions of the MPN on mixed substrates from the various sediments demonstrated that the methanogens obtained were truly methylotrophic and closely related to M. hollandica. In the MPN for the Dekkerswald sediment, however, besides those of the M. hollandica-like organisms, a PCR product of a methanogen related to members of the genus Methanosaeta was present.
Phylogenetic analysis of the sequences obtained from the highest MPN dilutions revealed that they form a distinct cluster together with M. hollandica. This genetic cluster represents a genus of the obligately methylotrophic methanogens typical for freshwater habitats. The presence of M. hollandica-like methanogens in the sediment samples was also confirmed by the presence of a nested-PCR product after PAGE in the samples of sediments from Dekkerswald and Breukelen. Sequence analysis of the PCR product from Dekkerswald revealed that this sequence was indeed derived from an organism that is closely related to M. hollandica (95 to 97% sequence similarity). The absence of a PCR product after PAGE in the other sediments is probably due to the fact that the PCR conditions used to achieve selective amplification of M. hollandica only were very crucial (69°C). These crucial conditions were probably due to the fact that this primer contained palindromic sequences (Fig. 2). Unfortunately, however, there were no alternative primer target sites within the 16S rRNA gene sequence which could be used for the specific detection of M. hollandica-like methanogens.
In conclusion, this study provides evidence that the cycling of methylated sulfur compounds in freshwater sediments is well balanced. The combination of sediment slurry incubation experiments, MPN series, and molecular-genetics detection performed provides convincing evidence that the dominance of certain mechanisms for VOSC formation and degradation depend on the concentrations of sulfate, sulfide, and methyl group-donating compounds. Although the PCR technique used in this study is not a reliable tool for quantitative analysis, the intensities of the bands in ARDRA were highest in the sediments with high methane and MT formation rates and high MPN counts. Furthermore, sequence information for MPN-PCR products and nested-PCR products demonstrated that the methylotrophic methanogens present in the sediments were closely related to M. hollandica.
ACKNOWLEDGMENTS
This work was supported by The Netherlands Organization for the Advancement of Pure Research (NWO) as part of the program Verstoring van Aardsystemen.
REFERENCES
- 1.Andreae M O. Ocean-atmosphere interactions in the global biogeochemical sulfur cycle. Mar Chem. 1990;30:1–29. [Google Scholar]
- 2.Bak F, Finster K, Rothfuss F. Formation of dimethyl sulfide and methanethiol from methoxylated aromatic compounds and inorganic sulfide by newly isolated anaerobic bacteria. Arch Microbiol. 1992;157:529–534. [Google Scholar]
- 3.Charlson R J, Lovelock J E, Andreae M O, Warren S G. Oceanic phytoplankton, atmospheric sulphur, cloud albedo and climate. Nature. 1987;326:655–661. [Google Scholar]
- 4.De Man J C. The probability of the most probable number. Eur J Appl Microbiol. 1975;1:67–78. [Google Scholar]
- 5.Derikx P J L, Op den Camp H J M, van der Drift C, Van Griensven L J L D, Vogels G D. Odorous sulfur compounds emitted during production of compost used as a substrate in mushroom cultivation. Appl Environ Microbiol. 1990;56:176–180. doi: 10.1128/aem.56.1.176-180.1990. [DOI] [PMC free article] [PubMed] [Google Scholar]
- 6.Felsenstein J. Numerical methods of inferring evolutionary trees. Q Rev Biol. 1982;57:379–404. [Google Scholar]
- 7.Finster K, King G M, Bak F. Formation of methyl mercaptan and dimethyl sulfide from methoxylated aromatic compounds in anoxic marine and freshwater sediments. FEMS Microbiol Ecol. 1990;74:295–302. [Google Scholar]
- 8.Fitch W M, Margoliash E. Construction of phylogenetic trees: a method based on mutation distances as estimated by cytochrome c sequences is of general applicability. Science. 1967;155:279–284. doi: 10.1126/science.155.3760.279. [DOI] [PubMed] [Google Scholar]
- 9.Franklin M J, Wiebe W J, Whitman W B. Populations of methanogenic bacteria in a Georgia salt marsh. Appl Environ Microbiol. 1988;54:1151–1157. doi: 10.1128/aem.54.5.1151-1157.1988. [DOI] [PMC free article] [PubMed] [Google Scholar]
- 10.Grech-Mora I, Fardeau M-L, Patel B K C, Ollivier B, Rimbault A, Prensier G, Garcia J-L, Garnier-Sillam E. Isolation and characterization of Sporobacter termitidis gen. nov., sp. nov., from the digestive tract of the wood-feeding termite Nasutitermes lujae. Int J Syst Bacteriol. 1996;46:512–518. [Google Scholar]
- 11.Großkopf R, Janssen P H, Liesack W. Diversity and structure of the methanogenic community in anoxic rice paddy soil microcosms as examined by cultivation and direct 16S rRNA gene sequence retrieval. Appl Environ Microbiol. 1998;64:960–969. doi: 10.1128/aem.64.3.960-969.1998. [DOI] [PMC free article] [PubMed] [Google Scholar]
- 12.Hutten T J, de Jong M H, Peeters B P H, van der Drift C, Vogels G D. Coenzyme M derivatives and their effects on methane formation from carbon dioxide and methanol by cell extracts of Methanosarcina barkeri. J Bacteriol. 1981;145:27–34. doi: 10.1128/jb.145.1.27-34.1981. [DOI] [PMC free article] [PubMed] [Google Scholar]
- 13.Kadota H, Ishida Y. Production of volatile sulfur compounds by microorganisms. Annu Rev Microbiol. 1972;26:127–138. doi: 10.1146/annurev.mi.26.100172.001015. [DOI] [PubMed] [Google Scholar]
- 14.Kiene R P. Dimethyl sulfide metabolism in salt marsh sediments. FEMS Microbiol Ecol. 1988;53:71–78. [Google Scholar]
- 15.Kiene R P, Oremland R S, Catena A, Miller L G, Capone D G. Metabolism of reduced methylated sulfur compounds in anaerobic sediments and by a pure culture of an estuarine methanogen. Appl Environ Microbiol. 1986;52:1037–1045. doi: 10.1128/aem.52.5.1037-1045.1986. [DOI] [PMC free article] [PubMed] [Google Scholar]
- 16.Kiene R P, Bates T S. Biological removal of dimethyl sulfide from sea water. Nature. 1990;345:702–705. [Google Scholar]
- 17.Kiene R P, Capone D G. Microbial transformations of methylated sulfur compounds in anoxic salt marsh sediments. Microb Ecol. 1988;15:275–291. doi: 10.1007/BF02012642. [DOI] [PubMed] [Google Scholar]
- 18.Kiene R P, Hines M E. Microbial formation of dimethyl sulfide in anoxic Sphagnum peat. Appl Environ Microbiol. 1995;61:2720–2726. doi: 10.1128/aem.61.7.2720-2726.1995. [DOI] [PMC free article] [PubMed] [Google Scholar]
- 19.Kreader C A. Relief of amplification inhibition in PCR with bovine serum albumin or T4 gene 32 protein. Appl Environ Microbiol. 1996;62:1102–1106. doi: 10.1128/aem.62.3.1102-1106.1996. [DOI] [PMC free article] [PubMed] [Google Scholar]
- 20.Lomans B P, Smolders A J P, Intven L, Pol A, Op den Camp H J M, van der Drift C. Formation of dimethyl sulfide and methanethiol in anoxic freshwater sediments. Appl Environ Microbiol. 1997;63:4741–4747. doi: 10.1128/aem.63.12.4741-4747.1997. [DOI] [PMC free article] [PubMed] [Google Scholar]
- 21.Lomans B P, Op den Camp H J M, Pol A, Vogels G D. Anaerobic versus aerobic degradation of dimethyl sulfide and methanethiol in anoxic freshwater sediments Appl. Environ Microbiol. 1999;65:438–443. doi: 10.1128/aem.65.2.438-443.1999. [DOI] [PMC free article] [PubMed] [Google Scholar]
- 22.Lomans B P, Op den Camp H J M, Pol A, van der Drift C, Vogels G D. The role of methanogens and other bacteria in degradation of dimethyl sulfide and methanethiol in anoxic freshwater sediments. Appl Environ Microbiol. 1999;65:2116–2121. doi: 10.1128/aem.65.5.2116-2121.1999. [DOI] [PMC free article] [PubMed] [Google Scholar]
- 23.Lomans B P, Maas R, Luderer R, Op den Camp H J M, Pol A, van der Drift C, Vogels G D. Isolation and characterization of Methanomethylovorans hollandica gen. nov., sp. nov., isolated from freshwater sediment, a methylotrophic methanogen able to grow on dimethyl sulfide and methanethiol. Appl Environ Microbiol. 1999;65:3641–3650. doi: 10.1128/aem.65.8.3641-3650.1999. [DOI] [PMC free article] [PubMed] [Google Scholar]
- 24.Lovelock J E, Maggs R J, Rasmussen R A. Atmospheric dimethyl sulfide and the natural sulfur cycle. Nature. 1972;237:452–453. [Google Scholar]
- 25.Lyimo T J, Pol A, Op den Camp H J M, Harhangi H R, Vogels G D. Isolation and characterization of a dimethylsulfide-utilizing methanogen, Methanosarcina semesiae sp. nov., from mangrove sediment. Int J Syst Evol Bact. 1998;50:171–178. doi: 10.1099/00207713-50-1-171. [DOI] [PubMed] [Google Scholar]
- 26.Maidak B L, Cole J R, Parker C T, Jr, Garrity G M, Larsen N, Li B, Lilburn T G, McCaughey M J, Olsen G J, Overbeek R, Pramanik S, Schmidt T M, Tiedje J M, Woese C R. A new version of the RDP (Ribosomal Database Project) Nucleic Acids Res. 1999;27:171–173. doi: 10.1093/nar/27.1.171. [DOI] [PMC free article] [PubMed] [Google Scholar]
- 27.McBride L J, Koepf S M, Gibbs R A, Salser W, Mayrand P E, Hunkapiller M W, Kronick M N. Automated DNA sequencing methods involving polymerase chain reaction. Clin Chem. 1989;35:2196–2201. [PubMed] [Google Scholar]
- 28.Mechichi T, Labat M, Garcia J-L, Thomas P, Patel B K C. Sporobacterium olearium gen. nov., sp. nov., a new methanethiol-producing bacterium that degrades aromatic compounds, isolated from an olive mill wastewater treatment digester. Int J Syst Bacteriol. 1999;49:1741–1748. doi: 10.1099/00207713-49-4-1741. [DOI] [PubMed] [Google Scholar]
- 29.Mechichi T, Labat M, Patel B K C, Woo T H S, Thomas P, Garcia J-L. Clostridium methoxybenzovorans sp. nov., a new aromatic O-demethylating homoacetogen from an olive mill waste treatment digester. Int J Syst Bacteriol. 1999;49:1201–1209. doi: 10.1099/00207713-49-3-1201. [DOI] [PubMed] [Google Scholar]
- 30.Raskin L, Stromley J M, Rittmann B E, Stahl D A. Group-specific 16S rRNA hybridization probes to describe natural communities of methanogens. Appl Environ Microbiol. 1994;60:1232–1240. doi: 10.1128/aem.60.4.1232-1240.1994. [DOI] [PMC free article] [PubMed] [Google Scholar]
- 31.Roelofs J G M. Inlet of alkaline river water into peaty lowlands: effects on water quality and Stratiotes aloides L. stands. Aquat Bot. 1991;39:267–293. [Google Scholar]
- 32.Saitou N, Nei M. The neighbor-joining method: a new method for reconstructing phylogenetic trees. Mol Biol Evol. 1987;4:406–425. doi: 10.1093/oxfordjournals.molbev.a040454. [DOI] [PubMed] [Google Scholar]
- 33.Salsburry R L, Merricks D L. Production of methanethiol and dimethyl sulfide by rumen micro-organisms. Plant Soil. 1975;43:191–209. [Google Scholar]
- 34.Taylor B F, Kiene R P. Microbial metabolism of dimethyl sulfide. ACS Symp Ser. 1989;393:202–221. [Google Scholar]
- 35.Van der Maarel J E C, Hansen T A. Dimethylsulfoniumpropionate in anoxic interdial sediments: a precursor of methanogenesis via dimethyl sulfide, methanethiol and methiolpropionate. Mar Geol. 1997;137:5–12. [Google Scholar]
- 36.Widdel F, Bak F. Gram-negative mesophilic sulfate-reducing bacteria. In: Balows A, Trüper H G, Dworkin M, Harder W, Schleifer K H, editors. The prokaryotes. 2nd ed. IV. New York, N.Y: Springer-Verlag; 1992. pp. 3352–3378. [Google Scholar]
- 37.Zinder S H, Brock T D. Methane, carbon dioxide, and hydrogen sulfide production from the terminal methiol group of methionine by anaerobic lake sediments. Appl Environ Microbiol. 1978;35:344–352. doi: 10.1128/aem.35.2.344-352.1978. [DOI] [PMC free article] [PubMed] [Google Scholar]
- 38.Zinder S H, Brock T D. Production of methane and carbon dioxide from methane thiol and dimethyl sulfide by anaerobic lake sediments. Nature. 1978;273:226–228. doi: 10.1128/aem.35.2.344-352.1978. [DOI] [PMC free article] [PubMed] [Google Scholar]