PLOS ONE logoLink to PLOS ONE
. 2022 Jul 8;17(7):e0271187. doi: 10.1371/journal.pone.0271187

Characterization of regional variation of bone mineral density in the geriatric human cervical spine by quantitative computed tomography

Ryan S Garay 1, Giovanni F Solitro 2, Kenrick C Lam 3, Randal P Morris 3, Abeer Albarghouthi 4, Ronald W Lindsey 3, Loren L Latta 4,5, Francesco Travascio 1,4,5,6,*
Editor: James Mockridge7
PMCID: PMC9269429  PMID: 35802639

Abstract

Background

Odontoid process fractures are among the most common in elderly cervical spines. Their treatment often requires fixation, which may include use of implants anteriorly or posteriorly. Bone density can significantly affect the outcomes of these procedures. Currently, little is known about bone mineral density (BMD) distributions within cervical spine in elderly. This study documented BMD distribution across various anatomical regions of elderly cervical vertebrae.

Methods and findings

Twenty-three human cadaveric C1-C5 spine segments (14 males and 9 female, 74±9.3 y.o.) were imaged via quantitative CT-scan. Using an established experimental protocol, the three-dimensional shapes of the vertebrae were reconstructed from CT images and partitioned in bone regions (4 regions for C1, 14 regions for C2 and 12 regions for C3-5). The BMD was calculated from the Hounsfield units via calibration phantom. For each vertebral level, effects of gender and anatomical bone region on BMD distribution were investigated via pertinent statistical tools.

Data trends suggested that BMD was higher in female vertebrae when compared to male ones. In C1, the highest BMD was found in the posterior portion of the bone. In C2, BMD at the dens was the highest, followed by lamina and spinous process, and the posterior aspect of the vertebral body. In C3-5, lateral masses, lamina, and spinous processes were characterized by the largest values of BMD, followed by the posterior vertebral body.

Conclusions

The higher BMD values characterizing the posterior aspects of vertebrae suggest that, in the elderly, posterior surgical approaches may offer a better fixation quality.

Introduction

Odontoid process fractures are one of the most common cervical spine fractures in the elderly and are associated with increased morbidity and mortality [18]. Recent evidence suggests that there is a survival advantage and a trend toward improved quality of life after operative intervention as compared to non-operative treatment in geriatric patients with odontoid fractures [9,10]. Options for operative management of odontoid process fractures consist of reduction and internal fixation with an anterior odontoid screw or posterior atlantoaxial arthrodesis. Anterior odontoid screw fixation, although motion preserving, is associated with a high complication rate in the elderly due to bone fragility and cervical spine stiffness [11]. Posterior atlantoaxial arthrodesis is suitable for most fracture patterns but at the cost of range of motion [12]. Bilateral C1-C2 screw or screw-rod constructs have become very popular posterior atlantoaxial fixation techniques in recent years [13,14]. Although the clinical outcomes of these posterior fixation techniques among all odontoid fracture patients have been examined [15,16], the quality of fixation achieved by each modality in elderly osteoporotic spines has not been established. Moreover, little is currently known about bone mineral density (BMD) distribution variations within the cervical spine in the elderly and how those variations may affect different fixation techniques.

The objective of this study was to document the BMD distribution across various anatomical regions of the elderly cervical vertebrae at different levels. The rationale for pursuing such characterization is based on the premise that cervical spine bone quality distribution data will assist in determining the optimal cervical spine fixation technique(s) in geriatric patients. This has been accomplished by measuring region-specific BMD via quantitative CT analysis of human cadaveric specimens. A similar approach has been successfully used in other studies aimed at characterizing bone mineral distribution across lumbar vertebral bodies [17], and adult and young adult cervical spines [18,19].

Materials and methods

Specimens

Twenty-three intact fresh human cadaver specimens (14 males and 9 female, age 74 ± 9.3 y.o., BMI 21.6 ± 5.5), including the cervical spine segment (C1-C5), were obtained from a tissue bank (United Tissue Network, Inc., St. Petersburg, FL). As donors were not identified, this study was IRB exempted as per the National Institute of Health (NIH) guidelines (exemption 4). The specimens were wrapped in saline soaked towels, hermetically sealed and stored at -20°C prior to imaging. Sealed specimens were thawed in air overnight prior to scanning.

QCT image acquisition

Specimens were imaged via single-energy QCT using a clinical computed tomography (CT) scanner (LightSpeed VCT, GE Medical Systems, Chicago, IL). The QCT image volume included the entire head of the specimen, though only QCT images of the cervical segment C1-C5 were used in this analysis. CT scanning parameters included: bone standard reconstruction algorithm, axial scanning plane, 120 kV tube voltage, 99.0 mA tube current, 0.8 second scan time, ~200 slices, 1.25 mm slice thickness, 0.5 x 0.5 mm2 in-plane pixel resolution. To mimic the physiologic setting, heads were orientated in a supine position when imaged. A QCT scan of a solid dipotassium phosphate (K2HPO4) phantom (QCT Pro; Mindways Software Inc, Austin, TX, USA) was used to convert grayscale CT Hounsfield units (HU) to an equivalent volumetric bone mineral density (vBMD). The CT HU values were converted to vBMD using a previously validated technique [20]. The mean HU values within each of the reference phantom cylinders were calculated. Subsequently, a regression equation (R2 > 0.99), derived from the mean HU values and known reference cylinder densities, was used to convert HU to equivalent volumetric BMD.

Segmentation and region identification

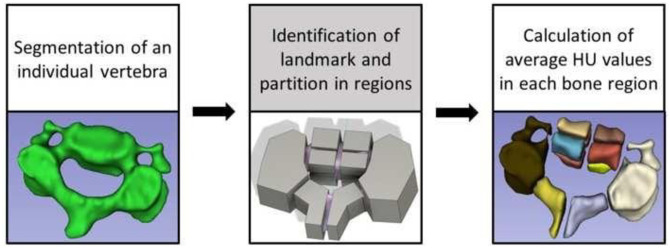
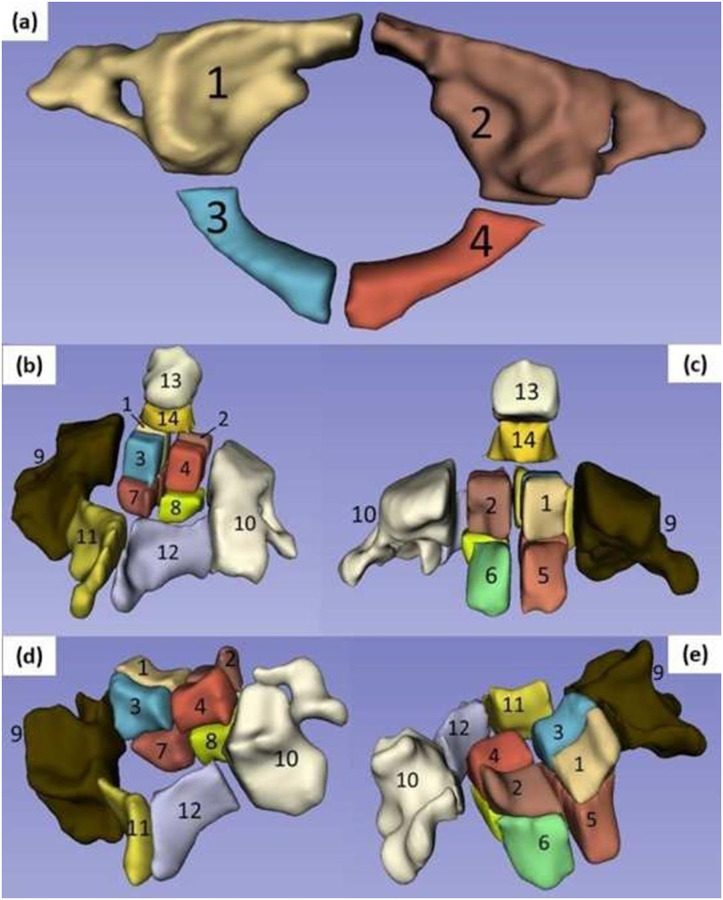
A flowchart of the sequence of operations for achieving the segmentation and partition of the vertebrae in distinct bone regions is reported in Fig 1. Briefly, for each cervical spine, vertebrae were individually segmented (3D Slicer v.4.8.1) [21]. In a similar fashion of a previously reported technique [17], the segmented vertebrae were exported as STL files into a dedicated software for mesh smoothening (Autodesk Meshmixer v3.5) and, subsequently, into a CAD software (Autodesk Fusion 360 v.2.0.9313) to be partitioned in regions according to predefined anatomical landmarks and cervical level. More specifically, for C1, a total of 4 regions were created by splitting the vertebra along a medial line from the anterior to the posterior tubercle; 2 regions included the anterior arches, the articular surfaces, and the transverse processes, and the other 2 regions comprised the posterior arches. For C2, 14 regions were created: the vertebral body was split in 8 octants; 2 more regions included the lateral masses and transverse processes on their respective sides; 2 regions comprised the lamina through to the spinous process; and 2 other regions represented the superior and inferior portions of the dens. For C3-C5, a total of 12 regions were created: 8 regions for the vertebral body; 2 more regions were added for the lateral masses and transverse processes on their respective sides; and 2 regions included the lamina through to the spinous process. A graphical representation of the bone regions for each vertebral level is reported in Fig 2. Subsequently, STL models of the partitioned bone regions were imported back into 3D Slicer, and their BMD values were determined using the ‘Segment Statistics’ module.

Fig 1. Workflow to segment and partition vertebrae in bone regions.

Fig 1

Fig 2. Identification of bone regions for each vertebral level: (a) bone regions of C1; (b) bone regions of C2, posterior view; (c) bone regions of C2, anterior view; (d) bone regions of C3-5, posterior view; (e) bone regions of C3-5, anterior view.

Fig 2

Statistical analysis

A preliminary inspection of the data via Anderson-Darling test indicated that all the data collected were normally distributed. Accordingly, all the data were reported in terms of mean ± standard deviation or, when appropriate, in terms of 95% confidence interval. The morphology of C1 and C2 vertebrae present major differences with respect to the C3-C5 levels. Therefore, data pertinent to C1 and C2 were analyzed separately, while those of C3-C5 were combined. For each vertebral level, 2-sample mean t-tests were conducted to investigate gender dependent differences in BMD or bone volume. One-way ANOVA followed by post-hoc Tukey test was used to investigate any significant effect of vertebral level (5 levels) on BMD or bone volume. When investigating regional distribution of BMD within vertebral levels, female and male data were initially analyzed separately, and then combined if no significant gender-dependent difference was observed. Specifically, when investigating the mineral density of C1, one-way ANOVA followed by post-hoc Tukey test was used to individuate any significant effect of bone region (4 regions) on the BMD distribution within the vertebra. The same approach was used for investigating the effect of bone region (14 regions) on the BMD of C2. When analyzing data from C3, C4 and C5, BMD data were initially separated by gender and vertebral level, and then combined if no significant difference due to gender or vertebral level was observed. One-way ANOVA followed by post-hoc Tukey test was used to individuate any significant effect of bone region (12 regions) on the BMD distribution. For all tests performed, the level of significance was set to α = 0.05. Outliers elimination, if needed, was conducted via Grubbs test.

Results

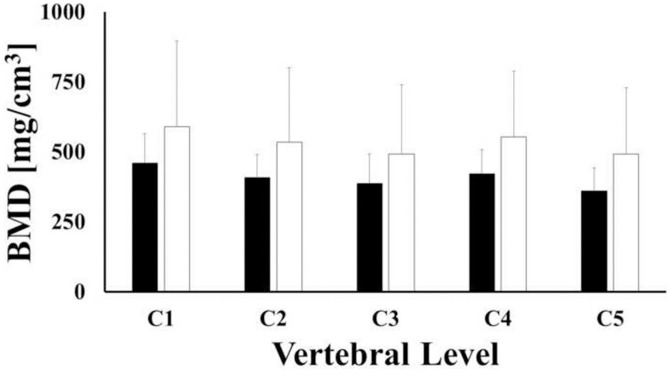
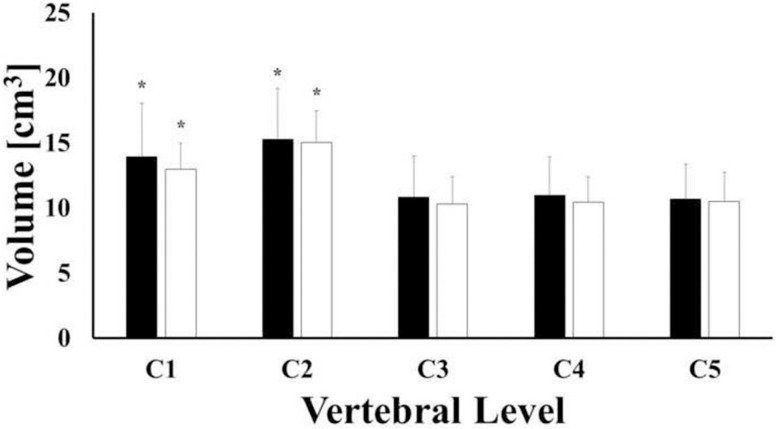
For all the vertebral levels investigated, BMD values of female vertebrae were larger than those found in male samples, although differences were not statistically significant (p-value > 0.05). For both female and male vertebrae, the largest values of BMD were found in C1 (CI: 435.7, 587.3 mg/cm3), followed by C4 (CI: 397.6, 549.3.3 mg/cm3) and C2 (CI: 381.6, 533.2 mg/cm3). The lowest values corresponded to C3 (CI: 353.3, 504.9 mg/cm3) and C5 (CI: 337.8, 492.8 mg/cm3) levels, see Fig 3. For each vertebral level, the mean values of bone volumes of male vertebrae were larger than those of female ones, but not statistically different (p-value > 0.05). For both female and male samples, the mean volumes of C1 (CI: 12.37, 14.8 cm3) and C2 (CI: 13.99, 16.42 cm3) were significantly larger (p-value <0.001) than those of C3 (CI: 9.41, 11.84 cm3), C4 (CI: 9.58, 12.0 cm3) and C5 (CI: 9.37, 11.85 cm3), see Fig 4.

Fig 3. Mean values of bone mineral density across vertebral levels for female (white) and male (black) samples.

Fig 3

Bars indicate one standard deviation.

Fig 4. Mean values of bone volume across vertebral levels for female (white) and male (black) samples.

Fig 4

Statistical significance (p-value < 0.05) is denoted by (*). Bars indicate one standard deviation.

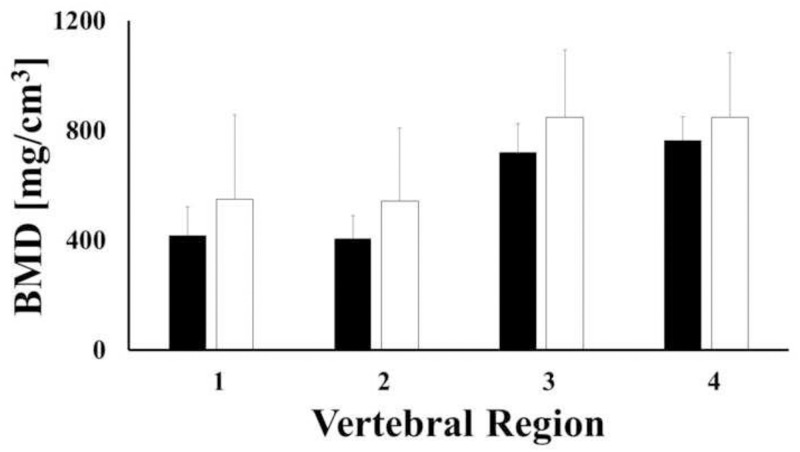
When investigating the regional distribution of bone density in C1, it was found that the largest values of BMD were observed in the posterior portion of the vertebra (regions 3 and 4) for both female and male samples. Statistically significant differences were found in only male samples when comparing BMD values in regions 1 and 2 to those of regions 3 and 4 (p-value < 0.001), see Fig 5. For each region investigated, BMD of female samples was not significantly different from that of male samples (p-value > 0.05). When combining female and male samples together, BMD values in regions 3 and 4 (693.7 and 720.3 mg/cm3, respectively) was approximately double the BMD observed in regions 1 and 2. A summary of the descriptive statistics for each bone region, together with statistical grouping is reported in Table 1.

Fig 5. Mean values of bone mineral density across regions of C1 for female (white) and male (black) samples.

Fig 5

Bars indicate one standard deviation.

Table 1. Descriptive statistics of BMD in C1.

Values of BMD are reported in terms of mg/cm3.

Region N Mean SD Min Max Group
1 23 357.3 138.3 162.9 692.7 A
2 23 354.8 143.8 176.3 742.3 A
3 23 693.7 316 214.5 1391.3 B
4 23 720.3 334.2 135.3 1352.7 B

Letters identify statistical groups.

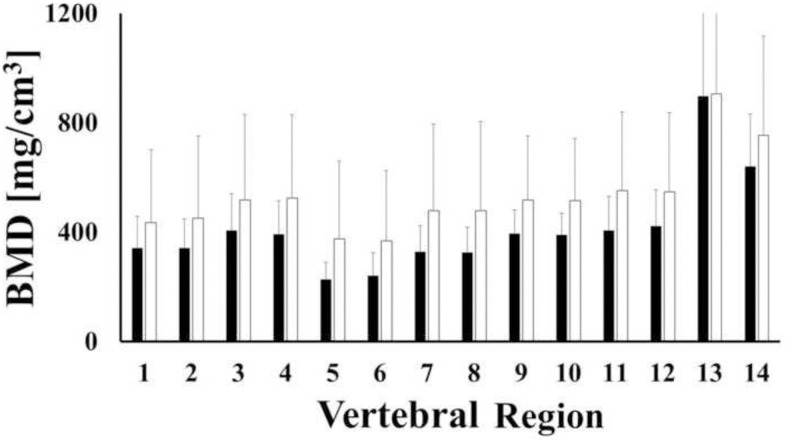
Bone densities in C2 female and male samples were similar, see Fig 6. When combining female and male data together, significant regional variations of BMD were observed, with the highest values found in the dens (608.4 and 823 mg/cm3), followed by the lamina and spinous process (386.1 and 393.8 mg/cm3) and the posterior aspect of the vertebral body (366.3 and 372.5 mg/cm3). No statistically significant differences were found in the remaining regions (p-value > 0.05). Descriptive statistics and grouping are reported in Table 2.

Fig 6. Mean values of bone mineral density across regions of C2 for female (white) and male (black) samples.

Fig 6

Bars indicate one standard deviation.

Table 2. Descriptive statistics of BMD in C2.

Values of BMD are reported in terms of mg/cm3.

Region N Mean SD Min Max Group
1 23 301.4 189.4 73.4 860.7 AB
2 23 307.5 207.2 55.2 874.8 AB
3 23 372.5 222.5 98.9 1040.8 A
4 23 366.3 216.8 103.1 1022.7 A
5 23 140.7 61.0 37.2 257.2 B
6 23 213.6 179.3 40.8 669.9 AB
7 23 310.8 216.8 77.7 971.9 AB
8 23 249.2 111.6 78.0 496.6 AB
9 23 340.5 120.0 159.6 606.0 AB
10 23 338.7 121.7 158.5 677.0 AB
11 23 386.1 210.7 87.3 980.4 A
12 23 393.8 210.7 96.8 1056.3 A
13 23 823.0 329.4 314.3 1470.9 C
14 23 608.4 269.8 202.4 764.6 D

Letters identify statistical groups.

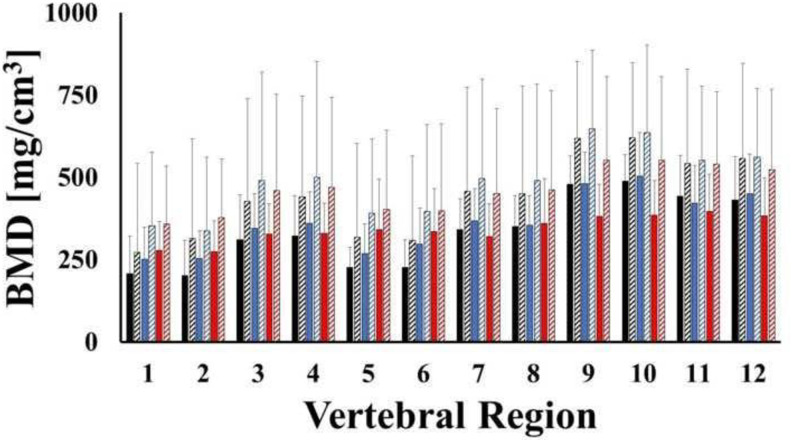
The mean values of BMD in bone regions of C3, C4 and C5 are reported in Fig 7. No statistical differences were observed among female and male samples. The lateral masses, together with the lamina and the spinous processes (from 470.3 to 517.6 mg/cm3) were characterized by the largest values of BMD, followed by the posterior portion of the vertebral body (from 380.5 to 400.1 mg/cm3). The lowest BMD values were found in the anterior portion of the vertebral body (from, 278.2 to 318.4 mg/cm3). A summary of the descriptive statistics for each bone region, together with statistical grouping is reported in Table 3.

Fig 7. Mean values of bone mineral density across regions of C3 (black), C4 (blues) and C5 (red) for male (solid) and female (stripes) samples.

Fig 7

Bars indicate one standard deviation.

Table 3. Descriptive statistics of BMD in C3-5.

Values of BMD are reported in terms of mg/cm3.

Region n Mean SD Min Max Group
1 69 278.3 139.5 81.7 838.9 D
2 69 282.8 150.9 69.4 839.7 D
3 69 380.5 198.5 162.5 1195.6 BCD
4 69 390.3 206.3 159.4 1248.1 BC
5 69 315 171.9 74.5 837.2 CD
6 69 318.4 176 76.2 975.2 CD
7 69 393.6 193.6 125.6 1143.3 BC
8 69 400.1 197 152.4 1102.4 BC
9 69 511.3 192.4 182.6 1081.3 A
10 69 517.6 194.4 245.8 1142 A
11 69 470.3 179.1 211.1 928 AB
12 69 472.5 180.5 213.3 908.8 AB

Letters identify statistical groups.

Discussion

Although not always statistically significant, the results reported in this study suggest that gender may influence both mineral density and volume of cervical vertebrae. Specifically, the authors found out that the average values of vertebrae BMD in female specimens were larger than those found in male specimens across all levels. The opposite gender trend was observed for the average vertebral volumes, see Figs 3 and 4. Despite the fact that these results are in agreement with several similar prior studies [18,19,2225], they contradict the conventional wisdom that associates lower BMD to females compared to males. As speculated by Anderst and co-workers [18,19], in contrast to gender biomechanical load variations inherent in other musculoskeletal regions (e.g. hip, lumbar spine, etc.), the mechanical loads on female and male cervical spines might be similar. Our data also indicate that the female cervical vertebrae are smaller than male vertebrae (Fig 4). Accordingly, the magnitude of the mechanical stress acting on female cervical vertebrae is greater and requires higher bone strength, which is positively related to bone density [26,27]. This could possibly explain why our average female specimen BMD values were higher than those from males.

The average volumes of the vertebrae measured in this study were comparable in magnitude and trend to those previously reported, with C2 being the largest (~16 cm3), followed by C1 (~14cm3), and C3-C5 (~10 cm3) [18,19]. In contrast, for all the vertebral levels investigated, the BMD values were smaller than those previously reported in similar analyses [19,28]. However, it should be considered that the demographic composition of the vertebral samples used in those studies included young adults and/or adults. The principal contribution of this study is that it specifically targets geriatric human cervical spine (age 74 ± 9.3 y.o.). Therefore, lower BMD levels, compared to a younger specimen population, would be expected. Also, in agreement with previous studies [18], our results demonstrate that the highest BMD values were found in C1. Furthermore, the second highest BMD values were found in C4 and subsequently decreased at relative rostral and caudal vertebral levels. Previous studies have reported a different trend, with the largest BMD values detected at C5 compared to C2-C4 and C6-C7 segments [22,23,2830]. These differences in BMD by vertebral levels may be due to variations is an individual’s physiological conditions, which would alter the magnitude of mechanical load experienced by a particular vertebra over time. The higher value of BMD in C5 reported in young and adults can be attributed to this level being exposed to a larger mechanical load [18,19], as Wolff’s Law would predict. The fact that the geriatric vertebrae used in this study demonstrated higher BMD values at C4 compared to C5 may suggest a different in-vivo mechanical load distribution across vertebral levels in the elderly spine. This would be reasonable to expect in view of the postural changes that typically occur in the neck with ageing [31].

The distributions of BMD across different anatomical regions of each vertebral level were also investigated. The choice of the specific anatomical region subdivision was motivated to document BMD quality in the anterior and posterior vertebral body (8 regions), as well as the lateral masses (2 regions) since these are the locations where fixation hardware is usually implanted. Two additional regions (including the lamina and the spinous process) were also investigated as this is where bone grafts can be harvested from. In general, for each level considered, the highest BMD values were measured in the posterior regions of the bone, while the lowest BMD values were detected in the anterior regions. Specifically, in C3-C5, the average BMD of the lateral masses, the lamina and the posterior vertebral body were 65%, 55% and 30% larger than those found in the anterior vertebral body, respectively (Fig 7 and Table 3). Differences of these magnitudes across similar anatomical regions have been reported in studies on both young and adult cohorts [18,19]. The trends of bone density distribution in C2 were similar to those trends observed in the lower vertebral levels (Table 2), with the exception of the dens, whose average BMD was approximately 200% larger than the other anatomical regions in the vertebra, see Fig 6. This was also in agreement with similar measurements conducted on young adult cervical spines [18]. Consistent with all of the other vertebral levels, the posterior region of C1 was characterized by a larger BMD than the anterior portion, see Table 1. To date, only Anderst et al. have analyzed the mineral density distribution in C1, and these investigators found the anterior C1 region to possess the highest BMD [18]. It should be noted that in their study, C1 was split in three anatomical regions which were, in order of BMD magnitudes, the anterior arch, the posterior arch and the lateral masses. In contrast, the anatomical partition utilized in this study combined the anterior arch and the lateral masses. This may explain the discrepancy between our results and those of Anderst et al. The BMD distribution of the vertebral bodies hereby reported agrees with computed tomographic osteoabsorptiometry measurements of mineral density in 80 cervical vertebral endplates which shows that density of the posterolateral region of the endplate was greater than that in the anterior region [32].

Some limitations must be noted. This analysis was based on 23 cervical spines. A larger sample size would allow further generalizing the results hereby reported. For instance, a larger number of specimens would have allowed a multifactorial analysis (e.g., including vertebral level, gender, BMI, anatomical location, etc.) to identify those factors that are more influential on the distribution of BMD in cervical vertebrae. Nevertheless, our findings provide important preliminary insights on the BMD distribution in geriatric cervical spines and how this differentiates from that of young and adult spines. Furthermore, this study is limited by the chosen resolution of the CT and by the user discretion in identifying the landmarks. Both limitations are common to other similar densitometric studies that have been performed on clinically obtained CT data previously published [33,34]. The significant variations identified in this study will allow the development of deep learning algorithms targeted to the identification of the relevant volumes as performed in more recent studies [35].

In conclusion, the results of this study may suggest that gender could have an effect on both bone volume and density across all the levels of the cervical spine, with female having smaller vertebrae with higher BMD. There is a general agreement of the results of this contribution with those of previous studies. However, some age-related effects have also been observed: 1) the BMD of our elderly vertebrae is generally lower than that found in young and adult cohorts; 2) the BMD distribution across cervical levels in elderly is different from that of younger population. Finally, lateral-posterior regions of the vertebrae, including transverse processes, lateral masses, and spinous process regions for C3-C5, as well as in the dens for C2, were characterized by the highest values of BMD. Importantly, at each level, the posterior portion of the vertebral body possessed higher BMD that the anterior one. This information suggests that, in the elderly, surgical fixation of the posterior elements should be preferred to anterior ones.

Supporting information

S1 File

(XLSX)

Data Availability

All relevant data are within the paper and its Supporting information files.

Funding Statement

The author(s) received no specific funding for this work.

References

  • 1.Golob JF, Claridge JA, Yowler CJ, Peerless JR. (2008) Isolated cervical spine fractures in the elderly: a deadly injury. Journal of Trauma and Acute Care Surgery. 64(2):311–15. doi: 10.1097/TA.0b013e3181627625 [DOI] [PubMed] [Google Scholar]
  • 2.Harris MB, Reichmann WM, Bono CM, Bouchard K, Corbett KL, Warholic N. (2010) Mortality in elderly patients after cervical spine fractures. The Journal of Bone and Joint Surgery American. volume 92(3):567. doi: 10.2106/JBJS.I.00003 [DOI] [PMC free article] [PubMed] [Google Scholar]
  • 3.Malik SA, Murphy M, Connolly P, O’Byrne J. (2008) Evaluation of morbidity, mortality and outcome following cervical spine injuries in elderly patients. European Spine Journal. 17(4):585–91. doi: 10.1007/s00586-008-0603-3 [DOI] [PMC free article] [PubMed] [Google Scholar]
  • 4.Fehlings MG, Tetreault L, Nater A, Choma T, Harrop J, Mroz T, et al. (2015) The aging of the global population: the changing epidemiology of disease and spinal disorders. Neurosurgery. 77(Suppl1):S1–S5. doi: 10.1227/NEU.0000000000000953 [DOI] [PubMed] [Google Scholar]
  • 5.Ortman JM, Velkoff VA, Hogan H. (2014) An aging nation: the older population in the United States.
  • 6.Pal D, Sell P, Grevitt M. (2011) Type II odontoid fractures in the elderly: an evidence-based narrative review of management. European Spine Journal. 20(2):195–204. doi: 10.1007/s00586-010-1507-6 [DOI] [PMC free article] [PubMed] [Google Scholar]
  • 7.Dailey AT, Hart D, Finn MA, Schmidt MH, Apfelbaum RI. (2010) Anterior fixation of odontoid fractures in an elderly population. Journal of Neurosurgery: Spine. 12(1):1–8. doi: 10.3171/2009.7.SPINE08589 [DOI] [PubMed] [Google Scholar]
  • 8.Taitsman LA, Altman DT, Hecht AC, Pedlow FX. (2008) Complications of cervical halo-vest orthoses in elderly patients. Orthopedics. 31(5):446. [DOI] [PubMed] [Google Scholar]
  • 9.Chapman J, Smith JS, Kopjar B, Vaccaro AR, Arnold P, Shaffrey CI, et al. (2013) The AOSpine North America Geriatric Odontoid Fracture Mortality Study: a retrospective review of mortality outcomes for operative versus nonoperative treatment of 322 patients with long-term follow-up. Spine. 38(13):1098. doi: 10.1097/BRS.0b013e318286f0cf [DOI] [PMC free article] [PubMed] [Google Scholar]
  • 10.Pearson AM, Martin BI, Lindsey M, Mirza SK. (2016) C2 vertebral fractures in the Medicare population: incidence, outcomes, and costs. JBJS. 98(6):449–56. [DOI] [PubMed] [Google Scholar]
  • 11.Andersson S, Rodrigues M, Olerud C. (2009) Odontoid fractures: high complication rate associated with anterior screw fixation in the elderly. European Spine Journal. 9(1):56–9. [DOI] [PMC free article] [PubMed] [Google Scholar]
  • 12.Grob D, Crisco JJ, Panjabi MM, Wang P, Dvorak J. (1992) Biomechanical evaluation of four different posterior atlantoaxial fixation techniques. Spine. 17(5):480–90. doi: 10.1097/00007632-199205000-00003 [DOI] [PubMed] [Google Scholar]
  • 13.Magerl FSCS, Seemann PS. (1987) Stable posterior fusion of the atlas and axis by transarticular screw fixation. Vienna: Springer.
  • 14.Harms J, Melcher RP. (2001) Posterior C1–C2 fusion with polyaxial screw and rod fixation. Spine. 26(22):2467–71. doi: 10.1097/00007632-200111150-00014 [DOI] [PubMed] [Google Scholar]
  • 15.Lee SH, Kim ES, Sung JK, Park YM, Eoh W. (2010) Clinical and radiological comparison of treatment of atlantoaxial instability by posterior C1–C2 transarticular screw fixation or C1 lateral mass-C2 pedicle screw fixation. Journal of Clinical Neuroscience. 17(7):886–92. [DOI] [PubMed] [Google Scholar]
  • 16.Rajinda P, Towiwat S, Chirappapha P. (2017) Comparison of outcomes after atlantoaxial fusion with C1 lateral mass–C2 pedicle screws and C1–C2 transarticular screws. European Spine Journal. 26(4):1064–72. doi: 10.1007/s00586-016-4829-1 [DOI] [PubMed] [Google Scholar]
  • 17.Hussein AI, Jackman TM, Morgan SR, Barest GD, Morgan EF. (2013) The intravertebral distribution of bone density: correspondence to intervertebral disc health and implications for vertebral strength. Osteoporosis international. 24(12):3021–30. doi: 10.1007/s00198-013-2417-3 [DOI] [PMC free article] [PubMed] [Google Scholar]
  • 18.Anderst WJ, West T, Donaldson WF, Lee JY. (2017) Cervical spine bone density in young healthy adults as a function of sex, vertebral level and anatomic location. European Spine Journal. 26(9):2281–89. doi: 10.1007/s00586-017-5119-2 [DOI] [PubMed] [Google Scholar]
  • 19.Anderst WJ, Thorhauer ED, Lee JY, Donaldson WF, Kang JD. (2011) Cervical spine bone mineral density as a function of vertebral level and anatomic location. The Spine Journal. 11(7):659–67. doi: 10.1016/j.spinee.2011.05.007 [DOI] [PMC free article] [PubMed] [Google Scholar]
  • 20.Johnston JD, Masri BA, Wilson DR. (2009) Computed tomography topographic mapping of subchondral density (CT-TOMASD) in osteoarthritic and normal knees: methodological development and preliminary findings. Osteoarthritis and Cartilage. 17(10):1319–26. doi: 10.1016/j.joca.2009.04.013 [DOI] [PubMed] [Google Scholar]
  • 21.Fedorov A, Beichel R, Kalpathy-Cramer J, Finet J, Fillion-Robin JC, Pujol S, et al. (2012) 3D Slicer as an image computing platform for the Quantitative Imaging Network Magnetic resonance imaging. 30(9):1323–41. doi: 10.1016/j.mri.2012.05.001 [DOI] [PMC free article] [PubMed] [Google Scholar]
  • 22.Yoganandan N, Pintar FA, Stemper BD, et al. (2006) Trabecular bone density of male human cervical and lumbar vertebrae. Bone. 39:336–44. doi: 10.1016/j.bone.2006.01.160 [DOI] [PubMed] [Google Scholar]
  • 23.Yoganandan N, Pintar FA, Stemper BD, et al. (2006) Bone mineral density of human female cervical and lumbar spines from quantitative computed tomography. Spine. 31:73–6. doi: 10.1097/01.brs.0000192684.12046.93 [DOI] [PubMed] [Google Scholar]
  • 24.Jarvinen TL, Kannus P, Sievanen H. (2003) Estrogen and bone—a reproductive and locomotive perspective. J Bone Miner Res. 18:1921–31. doi: 10.1359/jbmr.2003.18.11.1921 [DOI] [PubMed] [Google Scholar]
  • 25.Havill LM, Mahaney MC, Binkley T, Specker BL. (2007) Effects of genes, sex, age, and activity on BMC, bone size, and areal and volumetric BMD. J Bone Miner Res. 22(5):737–46. doi: 10.1359/jbmr.070213 [DOI] [PubMed] [Google Scholar]
  • 26.Helgason B, Perilli E, Schileo E, Taddei F, Brynjólfsson S, Viceconti M. (2008) Mathematical relationships between bone density and mechanical properties: a literature review. Clinical Biomechanics. 23(2):135–46. doi: 10.1016/j.clinbiomech.2007.08.024 [DOI] [PubMed] [Google Scholar]
  • 27.Ammann P, Rizzoli R. (2003) Bone strength and its determinants. Osteoporosis international. 14(3):13–8. doi: 10.1007/s00198-002-1345-4 [DOI] [PubMed] [Google Scholar]
  • 28.Kandziora F, Pflugmacher R, Scholz M, et al. (2001) Comparison between sheep and human cervical spines: an anatomic, radiographic, bone mineral density, and biomechanical study. Spine. 26:1028–37. doi: 10.1097/00007632-200105010-00008 [DOI] [PubMed] [Google Scholar]
  • 29.Ordway NR, Lu YM, Zhang X, Cheng CC, Fang H, Fayyazi AH. (2007) Correlation of cervical endplate strength with CT measured subchondral bone density. European Spine Journal. 16(12):2104–09. doi: 10.1007/s00586-007-0482-z [DOI] [PMC free article] [PubMed] [Google Scholar]
  • 30.Curylo LJ, Lindsey RW, Doherty BJ, LeBlanc A. (1996) Segmental variations of bone mineral density in the cervical spine. Spine. 21(3):319–22. doi: 10.1097/00007632-199602010-00013 [DOI] [PubMed] [Google Scholar]
  • 31.Quek J, Pua YH, Clark RA, Bryant AL. (2013) Effects of thoracic kyphosis and forward head posture on cervical range of motion in older adults. Manual Therapy. 18(1):65–71. doi: 10.1016/j.math.2012.07.005 [DOI] [PubMed] [Google Scholar]
  • 32.Muller-Gerbl M, Weisser S, Linsenmeier U. (2008) The distribution of mineral density in the cervical vertebral endplates. European Spine Journal.17:432–438 doi: 10.1007/s00586-008-0601-5 [DOI] [PMC free article] [PubMed] [Google Scholar]
  • 33.Štern D, Vrtovec T, Pernuš F, Likar B, editors. (2011) Segmentation of vertebral bodies in CT and MR images based on 3D deterministic models. Medical Imaging 2011: Image Processing.
  • 34.Hardisty M, Wright T, Campbell M, Burke M, Atenafu E, Cawricz M, et al. (2020) CT based quantitative measures of the stability of fractured metastatically involved vertebrae treated with spine stereotactic body radiotherapy. Clinical & Experimental Metastasis. 37(5):575–84. doi: 10.1007/s10585-020-10049-9 [DOI] [PubMed] [Google Scholar]
  • 35.Kumar S, Nayak KP, Hareesh KS. (2012) Semiautomatic method for segmenting pedicles in vertebral radiographs. Procedia Technology.6:39–48. [Google Scholar]

Decision Letter 0

Ryan K Roeder

Transfer Alert

This paper was transferred from another journal. As a result, its full editorial history (including decision letters, peer reviews and author responses) may not be present.

27 Apr 2022

PONE-D-22-03568Characterization of Regional Variation of Bone Mineral Density in the Geriatric Human Cervical Spine by Quantitative Computer TomographyPLOS ONE

Dear Dr. Travascio,

Thank you for submitting your manuscript to PLOS ONE. After careful consideration, we feel that it has merit but does not fully meet PLOS ONE’s publication criteria as it currently stands. Therefore, we invite you to submit a revised version of the manuscript that addresses each point raised during the review process. Both reviewers questioned statistical methods. Reviewer 1 pointed out inconsistencies in the abstract and study motivation, and suggested comparison to other methods and data in the literature. Reviewer 2 pointed out inconsistencies between results and conclusions.

Please submit your revised manuscript by Jun 11 2022 11:59PM. If you will need more time than this to complete your revisions, please reply to this message or contact the journal office at plosone@plos.org. When you're ready to submit your revision, log on to https://www.editorialmanager.com/pone/ and select the 'Submissions Needing Revision' folder to locate your manuscript file.

Please include the following items when submitting your revised manuscript:

  • A rebuttal letter that responds to each point raised by the academic editor and reviewer(s). You should upload this letter as a separate file labeled 'Response to Reviewers'.

  • A marked-up copy of your manuscript that highlights changes made to the original version. You should upload this as a separate file labeled 'Revised Manuscript with Track Changes'.

  • An unmarked version of your revised paper without tracked changes. You should upload this as a separate file labeled 'Manuscript'.

If you would like to make changes to your financial disclosure, please include your updated statement in your cover letter. Guidelines for resubmitting your figure files are available below the reviewer comments at the end of this letter.

If applicable, we recommend that you deposit your laboratory protocols in protocols.io to enhance the reproducibility of your results. Protocols.io assigns your protocol its own identifier (DOI) so that it can be cited independently in the future. For instructions see: https://journals.plos.org/plosone/s/submission-guidelines#loc-laboratory-protocols. Additionally, PLOS ONE offers an option for publishing peer-reviewed Lab Protocol articles, which describe protocols hosted on protocols.io. Read more information on sharing protocols at https://plos.org/protocols?utm_medium=editorial-email&utm_source=authorletters&utm_campaign=protocols.

We look forward to receiving your revised manuscript.

Kind regards,

Ryan K. Roeder, PhD

Academic Editor

PLOS ONE

Journal Requirements:

When submitting your revision, we need you to address these additional requirements.

1. Please ensure that your manuscript meets PLOS ONE's style requirements, including those for file naming. The PLOS ONE style templates can be found at

https://journals.plos.org/plosone/s/file?id=wjVg/PLOSOne_formatting_sample_main_body.pdf and

https://journals.plos.org/plosone/s/file?id=ba62/PLOSOne_formatting_sample_title_authors_affiliations.pdf

2. In your Data Availability statement, you have not specified where the minimal data set underlying the results described in your manuscript can be found. PLOS defines a study's minimal data set as the underlying data used to reach the conclusions drawn in the manuscript and any additional data required to replicate the reported study findings in their entirety. All PLOS journals require that the minimal data set be made fully available. For more information about our data policy, please see http://journals.plos.org/plosone/s/data-availability.

Upon re-submitting your revised manuscript, please upload your study’s minimal underlying data set as either Supporting Information files or to a stable, public repository and include the relevant URLs, DOIs, or accession numbers within your revised cover letter. For a list of acceptable repositories, please see http://journals.plos.org/plosone/s/data-availability#loc-recommended-repositories. Any potentially identifying patient information must be fully anonymized.

Important: If there are ethical or legal restrictions to sharing your data publicly, please explain these restrictions in detail. Please see our guidelines for more information on what we consider unacceptable restrictions to publicly sharing data: http://journals.plos.org/plosone/s/data-availability#loc-unacceptable-data-access-restrictions. Note that it is not acceptable for the authors to be the sole named individuals responsible for ensuring data access.

We will update your Data Availability statement to reflect the information you provide in your cover letter.

3. We note that you have stated that you will provide repository information for your data at acceptance. Should your manuscript be accepted for publication, we will hold it until you provide the relevant accession numbers or DOIs necessary to access your data. If you wish to make changes to your Data Availability statement, please describe these changes in your cover letter and we will update your Data Availability statement to reflect the information you provide.

4. PLOS requires an ORCID iD for the corresponding author in Editorial Manager on papers submitted after December 6th, 2016. Please ensure that you have an ORCID iD and that it is validated in Editorial Manager. To do this, go to ‘Update my Information’ (in the upper left-hand corner of the main menu), and click on the Fetch/Validate link next to the ORCID field. This will take you to the ORCID site and allow you to create a new iD or authenticate a pre-existing iD in Editorial Manager. Please see the following video for instructions on linking an ORCID iD to your Editorial Manager account: https://www.youtube.com/watch?v=_xcclfuvtxQ

5. Please review your reference list to ensure that it is complete and correct. If you have cited papers that have been retracted, please include the rationale for doing so in the manuscript text, or remove these references and replace them with relevant current references. Any changes to the reference list should be mentioned in the rebuttal letter that accompanies your revised manuscript. If you need to cite a retracted article, indicate the article’s retracted status in the References list and also include a citation and full reference for the retraction notice.

[Note: HTML markup is below. Please do not edit.]

Reviewers' comments:

Reviewer's Responses to Questions

Comments to the Author

1. Is the manuscript technically sound, and do the data support the conclusions?

The manuscript must describe a technically sound piece of scientific research with data that supports the conclusions. Experiments must have been conducted rigorously, with appropriate controls, replication, and sample sizes. The conclusions must be drawn appropriately based on the data presented.

Reviewer #1: Yes

Reviewer #2: No

**********

2. Has the statistical analysis been performed appropriately and rigorously?

Reviewer #1: Yes

Reviewer #2: Yes

**********

3. Have the authors made all data underlying the findings in their manuscript fully available?

The PLOS Data policy requires authors to make all data underlying the findings described in their manuscript fully available without restriction, with rare exception (please refer to the Data Availability Statement in the manuscript PDF file). The data should be provided as part of the manuscript or its supporting information, or deposited to a public repository. For example, in addition to summary statistics, the data points behind means, medians and variance measures should be available. If there are restrictions on publicly sharing data—e.g. participant privacy or use of data from a third party—those must be specified.

Reviewer #1: Yes

Reviewer #2: Yes

**********

4. Is the manuscript presented in an intelligible fashion and written in standard English?

PLOS ONE does not copyedit accepted manuscripts, so the language in submitted articles must be clear, correct, and unambiguous. Any typographical or grammatical errors should be corrected at revision, so please note any specific errors here.

Reviewer #1: Yes

Reviewer #2: Yes

**********

5. Review Comments to the Author

Please use the space provided to explain your answers to the questions above. You may also include additional comments for the author, including concerns about dual publication, research ethics, or publication ethics. (Please upload your review as an attachment if it exceeds 20,000 characters)

Reviewer #1: The authors present a detailed compilation of cervical spine bone mineral density values apportioned by relevant anatomical sites in a geriatric cohort. Said apportioning is achieved through an elaborate workflow where the volumetric model obtained by segmentation is processed with a variety of CAD programs. The manuscript is well-written and its contribution of data for tissue sourced from older adult donors is welcome, as there is scarce data on this topic in the literature.

However, some questions arise after reading the manuscript:

The authors state that odontoid fractures as a motivator for this research, but do not include that region in the results. Were the specimens only consisting of the base of the cranium to C5 or did they include the whole head? The materials and methods section mentions orienting the cervical column in a supine position and that the qCT image volume “included the entire head”. Please clarify this for consistency’s sake. If the head was available, why not report the base of the cranium BMD as well? Lastly, it would have been more complete reporting if C6-C7 were included, but it seems that the specimens only spanned from C1 to C5.

The abstract mentions that BMD was reported in Hounsfield Units (which is a measurement of attenuation), but the tables show data converted to g/cm3 and the charts show data in mg/cm3. Make sure this is consistent across the document.

The zone subdivision (1 through 4) makes sense anatomically and clinically. Was there any other rationale to subdivide yet even further each vertebra into the 12 or 14 smaller sub-zones?

Data about the cohort that would be useful to have in a manuscript of this type are cause of death, BMI, bone quality (osteoporotic or osteopenic), and if possible, the cervical Cobb angles to characterize the spinal curvature. This last parameter would have helped to discuss the fact that C4 and C5 higher values were reported, presumably due to load.

While the method to obtain the data is scientifically sound, comparisons to other methodologies used for this purpose would be useful, especially the use of DXA which is the clinical gold-standard to evaluate bone quality. Another method that has not been discussed by the authors and is very accurate (which would also have avoided the elaborate virtual partitioning of the vertebrae) is CT Osteoabsorptiometry. In a seminal paper by Dr Muller-Gerbl (PMID 18193299), they report these very values for the cervical spine. Comparison against this method would also be useful.

The choice of aggregating data into groups ignoring gender or level is an interesting one. Was this due to the sample size? Was a power analysis conducted for this sample? Admittedly, this is not a large population study that can provide a very large sample size, but including these divisions by level, gender, BMI, anatomical location, etc. are useful when analyzing the data looking for which factor is the more influential.

In the Discussion section, the first paragraph mentions that head loads in both genders should be similar. That is the common assumption, however, body habitus and perhaps overall proportions may play a role in this. Do you have anthropomorphometric data to this effect? (not necessarily from your donors, that is probably difficult to trace), but in general?

In summary, this is a well-received contribution to the description of the cervical spine tissue material properties, but needs some minor modifications for completeness before the manuscript can be ready for publication.

Typos/Minor changes (please include line numbers next time, for easier reporting of edits)

========================================================

The first sentence of the second paragraph in the Abstract should start with “Data trends suggest…”

Regression coefficient should be R^2 (superscript) instead of just "R2". (Journal review website does not allow superscript characters)

DISCUSSION subtitle currently reads DISUCSSION.

Figure captions, what are the error bars? (SD?)

Reviewer #2: This is a good study that expands the body of knowledge regarding BMD levels and distribution within the human spine, specifically the cervical vertebrae. The study is well-designed: the partitioning of the vertebrae helps to provide insight to BMD distribution in the analyzed vertebrae, and the statistical tests used are appropriate.

Revisions are suggested primarily due to some of the conclusions of the study. The final paragraph begins by stating that 'this study indicates that gender has an effect on bone volume and density across all levels of the cervical spine...' However, the study's statistical analysis did not find any significant differences in BMD values (p-value > 0.05). Given the relatively small sample size, and a p-value that is described only as greater than 0.05, this conclusion is not supported by the data. This conclusion also creates an inconsistency in the report, as the lack of difference between male and female BMD is used as justification for combining data samples at multiple points in the study.

In addition, the final paragraph claims that 'BMD distribution...in elderly is different from that of younger population, likely due to postural changes occurring with ageing.' I agree that it is certainly possible (even probable) that postural changes may affect this, but the way it is currently worded seems overstated, and that these changes are due solely to postural changes. Further studies/evidence would be needed to support the claim's current wording that these distribution changes are likely due to postural changes. Hormonal or metabolic changes associated with aging may play a significant or predominant role in this.

The main conclusion of the study seems to be that BMD is higher in the posterior regions of the vertebral body as compared to the anterior regions of the vertebral body. Mention could also be made that BMD was highest in the lateral/posterior regions of the vertebrae, including transverse processes/lateral masses and spinous process regions for C3-C5, as well as in the dens for C2.

**********

6. PLOS authors have the option to publish the peer review history of their article (what does this mean?). If published, this will include your full peer review and any attached files.

If you choose “no”, your identity will remain anonymous but your review may still be made public.

Do you want your identity to be public for this peer review? For information about this choice, including consent withdrawal, please see our Privacy Policy.

Reviewer #1: No

Reviewer #2: Yes: Tyler C. Kreipke

[NOTE: If reviewer comments were submitted as an attachment file, they will be attached to this email and accessible via the submission site. Please log into your account, locate the manuscript record, and check for the action link "View Attachments". If this link does not appear, there are no attachment files.]

While revising your submission, please upload your figure files to the Preflight Analysis and Conversion Engine (PACE) digital diagnostic tool, https://pacev2.apexcovantage.com/. PACE helps ensure that figures meet PLOS requirements. To use PACE, you must first register as a user. Registration is free. Then, login and navigate to the UPLOAD tab, where you will find detailed instructions on how to use the tool. If you encounter any issues or have any questions when using PACE, please email PLOS at figures@plos.org. Please note that Supporting Information files do not need this step.

PLoS One. 2022 Jul 8;17(7):e0271187. doi: 10.1371/journal.pone.0271187.r002

Author response to Decision Letter 0


2 May 2022

Reviewers' comments:

We thank the Reviewers for the insightful comments and useful suggestions provided. We have conducted a revision of the manuscript as suggested. Changes throughout the text have been carried out as per Reviewers requests. In particular, the ‘Discussion’ section has been edited to include further discussion points and needed clarifications, as per Reviewers’ input. As a result, a new reference has been added to the manuscript. Also, the figures captions have been modified to specify the meaning of the bars. Minor changes throughout the manuscript have been implemented for consistency with the major changes included in this revision. The following are the detailed responses to the Reviewers’ comments. Revisions to the manuscript are highlighted in yellow.

Reviewer #1:

The authors present a detailed compilation of cervical spine bone mineral density values apportioned by relevant anatomical sites in a geriatric cohort. Said apportioning is achieved through an elaborate workflow where the volumetric model obtained by segmentation is processed with a variety of CAD programs. The manuscript is well-written and its contribution of data for tissue sourced from older adult donors is welcome, as there is scarce data on this topic in the literature. However, some questions arise after reading the manuscript:

1. The authors state that odontoid fractures as a motivator for this research, but do not include that region in the results. Were the specimens only consisting of the base of the cranium to C5 or did they include the whole head? The materials and methods section mentions orienting the cervical column in a supine position and that the qCT image volume “included the entire head”. Please clarify this for consistency’s sake. If the head was available, why not report the base of the cranium BMD as well?

Response: We would like to specify that with ‘odontoid’ we meant the ’odontoid process’ which is located in the anterior-superior portion of C2. We have clarified this in the abstract, as well as in the introduction. Our specimens also included the head, so also the cranium was scanned. While we agree on the value of documenting the bone mineral density at the base of the cranium, we did not report information on this anatomical region as our study focused on the cervical spine.

2. Lastly, it would have been more complete reporting if C6-C7 were included, but it seems that the specimens only spanned from C1 to C5.

Response: We completely agree. However, our samples did not include C6 and C7. This is because we focused on vertebral levels closer to C2, given that the most prevalent vertebral fractures in elderly occur at the odontoid process in C2.

3. The abstract mentions that BMD was reported in Hounsfield Units (which is a measurement of attenuation), but the tables show data converted to g/cm3 and the charts show data in mg/cm3. Make sure this is consistent across the document.

Response: we edited the abstract to clarify that the BMD was calculated from the Hounsfield units via calibration phantom. This device allows us to convert HU into mg/cm3. See the Methods and Findings portion of the abstract, it reads: “The BMD was calculated from the Hounsfield units via calibration phantom”.

4. The zone subdivision (1 through 4) makes sense anatomically and clinically. Was there any other rationale to subdivide yet even further each vertebra into the 12 or 14 smaller sub-zones?

Response: C3-5 were split in 12 zones to document the BMD of the vertebral body (8 zones) and the lateral masses (2 zones) since these are the anatomical locations where hardware is generally implanted. Finally, BMD quality in posterior processes (2 more zones) is relevant to evaluate the potential quality of bone grafts. The C2 included 2 additional zones to specifically document the dens, which is a unique characteristic of this vertebra. We have added this clarification in the 3rd paragraph of ‘Discussion’, it reads: “The choice of the specific anatomical region subdivision was motivated to document BMD quality in the anterior and posterior vertebral body (8 regions), as well as the lateral masses (2 regions) since these are the locations where fixation hardware is usually implanted. Two additional regions (including the lamina and the spinous process) were also investigated as this is where bone grafts can be harvested from.”

5. Data about the cohort that would be useful to have in a manuscript of this type are cause of death, BMI, bone quality (osteoporotic or osteopenic), and if possible, the cervical Cobb angles to characterize the spinal curvature. This last parameter would have helped to discuss the fact that C4 and C5 higher values were reported, presumably due to load.

Response: The BMI values were included in the specimens description (see ‘Specimens’ subsection of Materials and Methods). Unfortunately, information on cause of death was not available. Bone quality data can be directly available from the measurements performed in this study, but classification in normal, osteopoenic and osteoporotic is not possible as these categories are not defined for cervical spine. Finally, it was not possible to determine the Cobb angle as our samples came already dissected from C5 level to the head. While we agree that this could have been a valuable information, we believe that the correlation of Cobb angle to BMD distribution would have been out of the scope of this work.

6. While the method to obtain the data is scientifically sound, comparisons to other methodologies used for this purpose would be useful, especially the use of DXA which is the clinical gold-standard to evaluate bone quality. Another method that has not been discussed by the authors and is very accurate (which would also have avoided the elaborate virtual partitioning of the vertebrae) is CT Osteoabsorptiometry. In a seminal paper by Dr Muller-Gerbl (PMID 18193299), they report these very values for the cervical spine. Comparison against this method would also be useful.

Response: We appreciate the suggestions of the Reviewer for improving the quality of this contribution. Unfortunately, DXA is not a routine evaluation tool in the cervical spine [see Yoganandan et al.2006, Bone]. Due to the anatomy of the lower cervical spine, measurements of the entire cervical spine are technically challenging with DXA due to projection artifacts [Korovessis et al.(1994) Eur Spine J; Ordway et al.(2007) Eur Spine J]. Therefore, to our best knowledge, there are no studies reporting DXA values of cervical vertebrae in humans. We also thank the Reviewer for bringing to our attention the important contribution of Muller-Gerbl and co-workers. We enriched our discussion by comparing our results of BMD distribution in the vertebral bodies to the CT osteoabsorptiometry measurements of bone mineral distribution in endplates measured by Muller-Gerbl et al., see the end of the 3rd paragraph of ‘Discussion’, it reads: “The BMD distribution of the vertebral bodies hereby reported agrees with computed tomographic osteoabsorptiometry measurements of mineral density in 80 cervical vertebral endplates which shows that density of the posterolateral region of the endplate was greater than that in the anterior region [35]”.

7. The choice of aggregating data into groups ignoring gender or level is an interesting one. Was this due to the sample size? Was a power analysis conducted for this sample? Admittedly, this is not a large population study that can provide a very large sample size, but including these divisions by level, gender, BMI, anatomical location, etc. are useful when analyzing the data looking for which factor is the more influential.

Response: All the data reported in the figures 5-7 are segregated by gender (male/female) and vertebral level (c1 to c5), and vertebral region. Since no statistically significant difference were found across gender and level (for the case of C3-C5), we decided to pool the measurements together to increase the sample size. Hence, with a convenience sample of 23 spines, we conducted a post hoc power analysis. We found that our power is larger than 90% when trying to identify differences in BMD across regions of the vertebral bodies, for all the levels investigated. As noted in the limitations of the analysis (see fourth paragraph of ‘Discussion’), the results provided in this study represent preliminary insights on the BMD distribution in geriatric cervical spines. Given the limited number of spines investigated, fragmentation of the data in additional subgroups including also BMI would have further reduced the sample size (and the power) for the statistical considerations reported. We have noted this limitation in the 4th paragraph of ‘Discussion’, it reads: “A larger sample size would allow further generalizing the results hereby reported. For instance, a larger number of specimens would have allowed a multifactorial analysis (e.g., including vertebral level, gender, BMI, anatomical location, etc.) to identify those factors that are more influential on the distribution of BMD in cervical vertebrae.”

8. In the Discussion section, the first paragraph mentions that head loads in both genders should be similar. That is the common assumption, however, body habitus and perhaps overall proportions may play a role in this. Do you have anthropomorphometric data to this effect? (not necessarily from your donors, that is probably difficult to trace), but in general?

Response: To our best knowledge, we do not have information on potential differences in cervical spine loading across genders. The statement on similarity of the loading magnitudes is a speculation proposed by Anderst and co-workers we referred to in our contribution. We agree with the Reviewer that other factors, like posture and habitus, may influence the loading of the cervical spine. We mitigated the statement in the discussion clarifying that “As speculated by Anderst and co-workers […], mechanical loads on female and male cervical spines might be similar”.

9. In summary, this is a well-received contribution to the description of the cervical spine tissue material properties, but needs some minor modifications for completeness before the manuscript can be ready for publication.

Response: We appreciate the comments of the Reviewer and believe that this revision process has significantly improved the quality of our work.

10. Typos/Minor changes (please include line numbers next time, for easier reporting of edits)

========================================================

The first sentence of the second paragraph in the Abstract should start with “Data trends suggest…”

Response: done as suggested.

11. Regression coefficient should be R^2 (superscript) instead of just "R2". (Journal review website does not allow superscript characters)

Response: correction made. Thanks

12. DISCUSSION subtitle currently reads DISUCSSION.

Response: thank you for noticing that. Typo corrected.

13. Figure captions, what are the error bars? (SD?)

Response: figure captions for figures 3, 4, 5, 6 and 7 were modified to explain that the bar represents 1 standard deviation.

Reviewer #2

This is a good study that expands the body of knowledge regarding BMD levels and distribution within the human spine, specifically the cervical vertebrae. The study is well-designed: the partitioning of the vertebrae helps to provide insight to BMD distribution in the analyzed vertebrae, and the statistical tests used are appropriate.

1. Revisions are suggested primarily due to some of the conclusions of the study. The final paragraph begins by stating that 'this study indicates that gender has an effect on bone volume and density across all levels of the cervical spine...' However, the study's statistical analysis did not find any significant differences in BMD values (p-value > 0.05). Given the relatively small sample size, and a p-value that is described only as greater than 0.05, this conclusion is not supported by the data. This conclusion also creates an inconsistency in the report, as the lack of difference between male and female BMD is used as justification for combining data samples at multiple points in the study.

Response: We agree with the Reviewer and edited the paragraph to better reflect the actual findings of this study. It reads: ”…the results of this study may suggest that gender could have an effect on both bone volume and density across all the levels of the cervical spine…”.

2. In addition, the final paragraph claims that 'BMD distribution...in elderly is different from that of younger population, likely due to postural changes occurring with ageing.' I agree that it is certainly possible (even probable) that postural changes may affect this, but the way it is currently worded seems overstated, and that these changes are due solely to postural changes. Further studies/evidence would be needed to support the claim's current wording that these distribution changes are likely due to postural changes. Hormonal or metabolic changes associated with aging may play a significant or predominant role in this.

Response: We agree with the Reviewer and removed the statement from the manuscript.

3. The main conclusion of the study seems to be that BMD is higher in the posterior regions of the vertebral body as compared to the anterior regions of the vertebral body. Mention could also be made that BMD was highest in the lateral/posterior regions of the vertebrae, including transverse processes/lateral masses and spinous process regions for C3-C5, as well as in the dens for C2.

Response: In agreement with the reviewer, we edited the discussion to integrate this observation, now it reads: “Finally, lateral-posterior regions of the vertebrae, including transverse processes, lateral masses, and spinous process regions for C3-C5, as well as in the dens for C2, were characterized by the highest values of BMD. Importantly, at each level, the posterior portion of the vertebral body possessed higher BMD that the anterior one. This information suggests that, in the elderly, surgical fixation of the posterior elements should be preferred to anterior ones.”

Attachment

Submitted filename: Responses to reviewers comments.docx

Decision Letter 1

James Mockridge

27 Jun 2022

Characterization of Regional Variation of Bone Mineral Density in the Geriatric Human Cervical Spine by Quantitative Computer Tomography

PONE-D-22-03568R1

Dear Dr. Travascio,

We’re pleased to inform you that your manuscript has been judged scientifically suitable for publication and will be formally accepted for publication once it meets all outstanding technical requirements.

Within one week, you’ll receive an e-mail detailing the required amendments. When these have been addressed, you’ll receive a formal acceptance letter and your manuscript will be scheduled for publication.

An invoice for payment will follow shortly after the formal acceptance. To ensure an efficient process, please log into Editorial Manager at http://www.editorialmanager.com/pone/, click the 'Update My Information' link at the top of the page, and double check that your user information is up-to-date. If you have any billing related questions, please contact our Author Billing department directly at authorbilling@plos.org.

If your institution or institutions have a press office, please notify them about your upcoming paper to help maximize its impact. If they’ll be preparing press materials, please inform our press team as soon as possible -- no later than 48 hours after receiving the formal acceptance. Your manuscript will remain under strict press embargo until 2 pm Eastern Time on the date of publication. For more information, please contact onepress@plos.org.

Kind regards,

James Mockridge

Staff Editor

PLOS ONE

Editor's comments:

Reviewer #2 has indicated that there are some minor text errors to correct, so please do these before submitting your final files. 

Reviewers' comments:

Reviewer's Responses to Questions

Comments to the Author

1. If the authors have adequately addressed your comments raised in a previous round of review and you feel that this manuscript is now acceptable for publication, you may indicate that here to bypass the “Comments to the Author” section, enter your conflict of interest statement in the “Confidential to Editor” section, and submit your "Accept" recommendation.

Reviewer #1: All comments have been addressed

Reviewer #2: All comments have been addressed

**********

2. Is the manuscript technically sound, and do the data support the conclusions?

The manuscript must describe a technically sound piece of scientific research with data that supports the conclusions. Experiments must have been conducted rigorously, with appropriate controls, replication, and sample sizes. The conclusions must be drawn appropriately based on the data presented.

Reviewer #1: Yes

Reviewer #2: Yes

**********

3. Has the statistical analysis been performed appropriately and rigorously?

Reviewer #1: Yes

Reviewer #2: Yes

**********

4. Have the authors made all data underlying the findings in their manuscript fully available?

The PLOS Data policy requires authors to make all data underlying the findings described in their manuscript fully available without restriction, with rare exception (please refer to the Data Availability Statement in the manuscript PDF file). The data should be provided as part of the manuscript or its supporting information, or deposited to a public repository. For example, in addition to summary statistics, the data points behind means, medians and variance measures should be available. If there are restrictions on publicly sharing data—e.g. participant privacy or use of data from a third party—those must be specified.

Reviewer #1: Yes

Reviewer #2: Yes

**********

5. Is the manuscript presented in an intelligible fashion and written in standard English?

PLOS ONE does not copyedit accepted manuscripts, so the language in submitted articles must be clear, correct, and unambiguous. Any typographical or grammatical errors should be corrected at revision, so please note any specific errors here.

Reviewer #1: Yes

Reviewer #2: Yes

**********

6. Review Comments to the Author

Please use the space provided to explain your answers to the questions above. You may also include additional comments for the author, including concerns about dual publication, research ethics, or publication ethics. (Please upload your review as an attachment if it exceeds 20,000 characters)

Reviewer #1: The authors have addressed satisfactorily all comments. Thank you.

Reviewer #2: Comments and questions regarding the study have been satisfactorily addressed, and I believe that the authors have produced a quality study that will advance the knowledge of the field.

Upon reading the revised manuscript, I noted few small typos that could be addressed:

1. The title currently reads "...Quantitative Computer Tomography" instead of "...Quantitative Computed Tomography".

2. In the QCT Image Acquisition subsection of Materials and Methods, it reads "...0.5 x 0.5 mm in-plane pixel resolution..." instead of "...0.5 x 0.5 mm^2 in-plane pixel resolution...".

3. Near the end of the 2nd paragraph in Discussion, it reads "Wolff Law" instead of "Wolff's Law".

4. In the caption for Figure 3, there is no space between "male" and "(black)".

**********

7. PLOS authors have the option to publish the peer review history of their article (what does this mean?). If published, this will include your full peer review and any attached files.

If you choose “no”, your identity will remain anonymous but your review may still be made public.

Do you want your identity to be public for this peer review? For information about this choice, including consent withdrawal, please see our Privacy Policy.

Reviewer #1: No

Reviewer #2: Yes: Tyler Kreipke

**********

Acceptance letter

James Mockridge

29 Jun 2022

PONE-D-22-03568R1

Characterization of Regional Variation of Bone Mineral Density in the Geriatric Human Cervical Spine by Quantitative Computer Tomography

Dear Dr. Travascio:

I'm pleased to inform you that your manuscript has been deemed suitable for publication in PLOS ONE. Congratulations! Your manuscript is now with our production department.

If your institution or institutions have a press office, please let them know about your upcoming paper now to help maximize its impact. If they'll be preparing press materials, please inform our press team within the next 48 hours. Your manuscript will remain under strict press embargo until 2 pm Eastern Time on the date of publication. For more information please contact onepress@plos.org.

If we can help with anything else, please email us at plosone@plos.org.

Thank you for submitting your work to PLOS ONE and supporting open access.

Kind regards,

PLOS ONE Editorial Office Staff

on behalf of

Dr James Mockridge

Staff Editor

PLOS ONE


Articles from PLoS ONE are provided here courtesy of PLOS

RESOURCES