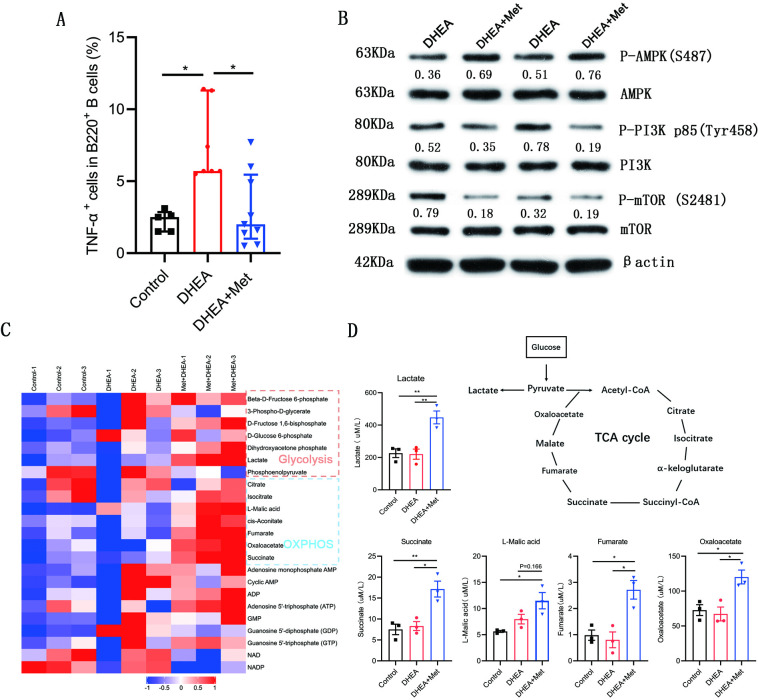
Figure 8. Metformin inhibits tumor necrosis factor-alpha (TNF-α) production, alters AMPK/PI3K/mTOR phosphorylation and induces metabolic reprogramming in pathological B cells from dehydroepiandrosterone (DHEA)-induced polycystic ovary syndrome (PCOS) mice.
(A) Percentage of TNF-α+ cells in splenic CD19+ B cells by flow cytometric analysis (n=5–9 mice per group). (B) Western blot of representative images and quantification analysis of the ratios of phosphorylated (P-) AMPK (S487)/AMPK, P-PI3K p85 (Tyr458)/PI3K p85, and P-mTOR (S2481)/mTOR in splenic B cells from DHEA-induced PCOS mice (n=2 mice per group). (C) The heat-map analysis of energy metabolites in splenic B cells was analyzed by mass spectrometry (n=3 mice per group). (D) Differential energy metabolites were quantitatively analyzed by mass spectrometry (n=3 mice per group). For (A), p values were determined by Kruskal-Wallis test followed by Dunn’s post-hoc test and data are presented as medians with interquartile ranges. For (D), p values were determined by one-way ANOVA with Bonferroni’s multiple comparison post-hoc test and data are presented as means ± SEM. *p<0.05; **p<0.01.

