Abstract
Background
MRI-derived proton density fat fraction (PDFF) is an accurate, reliable, and safe biologic marker for use in the noninvasive diagnosis of hepatic steatosis in patients with nonalcoholic fatty liver disease (NAFLD). Because of the cost and limited availability of MRI, it is necessary to develop an accurate method to diagnose NAFLD with potential point-of-care access.
Purpose
To compare the diagnostic accuracy of the quantitative US (QUS) fat fraction (FF) estimator with that of the controlled attenuation parameter (CAP) in the diagnosis of NAFLD using contemporaneous MRI-derived PDFF as the reference standard.
Materials and Methods
Participants with or suspected of having NAFLD were prospectively recruited at the NAFLD Research Center between July 2015 and July 2019. All participants underwent MRI-derived PDFF measurement, transient elastography with CAP measurement, and QUS. QUS FF was derived using computed QUS parameters from the acquired radiofrequency US data using a calibrated reference phantom. The area under the receiver operating characteristic curve (AUC) was calculated to assess the accuracy of QUS FF and CAP in the diagnosis of hepatic steatosis (defined as MRI-derived PDFF ≥ 5%). AUCs were compared using the DeLong test.
Results
A total of 123 participants were included (mean age, 52 years ± 13 [SD]; 67 [54%] women). Of these participants, 100 (81%) had MRI-derived PDFF of 5% or more. QUS FF had a significantly higher AUC for diagnosis of NAFLD than did CAP (0.92 [95% CI: 0.87, 0.98] vs 0.79 [95% CI: 0.67, 0.90], P = .03). QUS FF had a sensitivity of 98% (98 of 100) and a specificity of 48% (11 of 23). CAP had a sensitivity of 87% (87 of 100) and a specificity of 57% (13 of 23).
Conclusion
The quantitative US fat fraction estimator is more accurate than the controlled attenuation parameter in the diagnosis of hepatic steatosis in patients with or suspected of having nonalcoholic fatty liver disease.
© RSNA, 2022
Online supplemental material is available for this article.
See also the editorial by Ito in this issue.
Summary
The quantitative US fat fraction estimator using the Lizzi-Feleppa midband and envelope statistic was more accurate than the controlled attenuation parameter in the diagnosis of nonalcoholic fatty liver disease and quantification of liver fat content.
Key Results
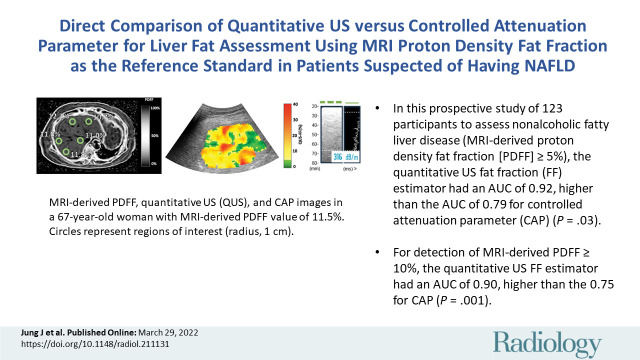
■ In this prospective study of 123 participants to assess nonalcoholic fatty liver disease (MRI-derived proton density fat fraction [PDFF] ≥5%), the quantitative US fat fraction (FF) estimator had an area under the receiver operating characteristic curve (AUC) of 0.92, higher than the AUC of 0.79 for controlled attenuation parameter (CAP) (P = .03).
■ For detection of an MRI-derived PDFF of 10% or more, the quantitative US FF estimator had an AUC of 0.90, higher than the 0.75 for CAP (P = .001).
Introduction
Nonalcoholic fatty liver disease (NAFLD), the most common chronic liver disease in the United States, is defined as the presence of hepatic steatosis of 5% or more at imaging or histologic analysis, without secondary causes of fat deposition (1). Although MRI-derived proton density fat fraction (PDFF) is considered the reference standard with which to detect and quantify liver fat in clinical trials, it is limited as a large-scale screening modality by its cost and lack of availability (2). Ideally, a modality should be noninvasive and accurate and offer point-of-care access to detect NAFLD and clinically assess hepatic steatosis in patients with NAFLD (3).
Conventional US is the most common image-based modality used for NAFLD assessment because of its wide availability and low cost (4). However, conventional US is limited by its lack of quantitative accuracy and reproducibility due to operator dependence (5). Mild steatosis (on the order of 5% of patients) can be misdiagnosed because of often-encountered concomitant obesity (6).
When compared with conventional US, controlled attenuation parameter (CAP) and quantitative US (QUS) offer greater quantitative accuracy while still providing potential for point-of-care access (7). CAP, measured with a vibration-controlled transient elastography device, enables rapid assessment of steatosis and liver fibrosis (8). CAP has been shown to correlate with histologic grading of hepatic steatosis (9,10); however, the optimal cutoff values using CAP vary substantially across studies and are not standardized (7,11).
QUS has been developed to overcome the qualitative nature of US B-mode imaging (12). QUS uses techniques, such as spectral analysis, envelope statistics of backscattered signals, or speed of sound, to quantify liver fat and was shown to have high interexamination repeatability and high intersonographer and interscanner reproducibility (13–15). Recently, QUS fat fraction (FF) estimator, derived from QUS parameters such as Lizzi-Feleppa midband and envelope statistics, has been developed to enable direct conversion from QUS to corresponding liver FF (16).
Both QUS and CAP provide potential point-of-care diagnosis of NAFLD; however, the comparative accuracy of these modalities in the diagnosis of NAFLD in patients at risk for NAFLD is not known. Thus, this study aims to compare the diagnostic accuracy of the QUS FF estimator with that of CAP in the detection of hepatic steatosis in a well-characterized prospective cohort of participants suspected of having NAFLD using contemporaneous MRI-derived PDFF as the reference standard. We also evaluated diagnostic accuracy in the detection of MRI-derived PDFF of 10% or more, a common eligibility criterion for nonalcoholic steatohepatitis–related pharmacologic trials.
Materials and Methods
This was a Health Insurance Portability and Accountability Act–compliant and institutional review board–approved prospective cross-sectional study that included a well-characterized cohort with or suspected of having NAFLD. Our study was supported in part by Siemens Healthineers through a research grant and a US scanner loaned to the University of California at San Diego. The authors controlled the information submitted for publication.
Study Design
Participants were consecutively recruited at the NAFLD Research Center between July 2015 and July 2019 [R.L. >10 years of experience]. Some participants in the current study (62 of 123 [50%]) were part of a previously reported study (16) that aimed to establish a QUS NAFLD classifier and QUS FF estimator. Written informed consent was obtained before participants were enrolled in this institutional review board–approved study.
All participants underwent a standardized research visit that included detailed medical history taking, physical examination, and anthropometric measurement. All participants were assessed with MRI-derived PDFF, QUS, and CAP to quantify liver fat. Those who were not able to complete all MRI-derived PDFF, QUS, and CAP assessments were excluded from the study. The median interval between QUS and MRI-derived PDFF was 0 days (IQR, 0–12 days). The median interval between CAP and MRI-derived PDFF was 14 days (IQR, 4–34 days).
Inclusion and Exclusion Criteria
Participants aged at least 18 years who had or were suspected of having NAFLD were included in the study. Participants who met any of the following criteria were excluded from the study: clinical, laboratory, or histologic evidence of liver disease other than NAFLD; substantial alcohol consumption (≥14 drinks per week for men, ≥7 drinks per week for women); use of steatogenic or hepatoxic medication; inability to undergo MRI (because of claustrophobia, metallic implants, or body circumference exceeding the bore of the MRI scanner); major systemic illnesses; or any other conditions determined by the investigator to affect the participant’s ability to adhere to study requirements.
MRI Protocol
MRI-derived PDFF served as the reference standard, as it provided a quantitative measurement of liver fat content that correlated with liver biopsy steatosis grade (2,17) and MR spectroscopy findings (18). Previous studies also have shown MRI-derived PDFF outperforms US modalities, such as US or CAP, in the quantification of liver fat content, justifying the use of MRI-derived PDFF as the reference standard (6,19). Detailed procedures used to acquire MRI-derived PDFF data are provided in Appendix E1 (online). A trained image analyst (A.S.B., 2 years of experience) who was blinded to QUS and CAP results placed circular regions of interest (radius, 1 cm) in each of the nine Couinaud segments (20,21). Average MRI-derived PDFF values from liver segments five through eight were calculated and used as the reference standard for hepatic fat content to match QUS and CAP data that were obtained from the right hepatic lobe.
QUS Data Acquisition
QUS liver examinations were performed using a Siemens S3000 (Siemens Healthineers) unit with a 4C1 (1–4 MHz nominal) or 6C1HD (1–6 MHz nominal) transducer by one or two of six registered diagnostic medical sonographers trained in the research protocol. To eliminate potential confounding physiologic effects, participants were asked to fast for 4 hours before the US examination. Each participant underwent at least one same-day scanning session, but some underwent as many as four sessions. The multiple sessions were performed as part of separate studies that assessed the interexamination repeatability and interoperator and interscanner reproducibility of QUS parameter measurements (13,14), which showed that QUS parameter measurements are repeatable and reproducible. A detailed description of QUS data acquisition is provided in Appendix E2 (online).
QUS FF Estimation Derivation
Seven representative QUS parameters (ie, attenuation coefficient, backscatter coefficient, Lizzi-Feleppa slope, intercept, midband fit, and envelope statistics parameters k and µ) were computed from the acquired radiofrequency US data by using a previously described procedure (16). A detailed explanation of each parameter is provided in Appendix E3 (online). The computation was performed offline by a biomedical engineer (A.H., >10 years of experience) using a custom MATLAB (MathWorks) software tool. QUS parameters were computed using the data corresponding to fields of interest drawn freehand by a trained analyst (A.H., >10 years of experience) within the margins of the liver boundary. For each QUS parameter, five measurements per session were averaged to yield one value (16). When there were data from multiple sessions, only data from the first session were used.
QUS FF was derived according to the procedure previously detailed (16) (Appendix E4 [online]). Briefly, a generalized linear regression model was developed to predict QUS FF using the computed QUS parameters. Stepwise regression was used for parameter selection. QUS- and MRI-derived PDFF data were used for model training, with MRI-derived PDFF being the reference standard. QUS FF data were generated with a leave-one-out cross-validation procedure. For each participant, QUS FF was derived by using the model trained with the QUS- and MRI-derived PDFF data of all other participants. After derivation, each participant was classified as having NAFLD using a QUS FF cut point of 5% or more. QUS FF of 10% or more was used to diagnose MRI-derived PDFF of 10% or more. Additionally, for illustrative purposes, representative parametric QUS FF maps were created, as explained in Appendix E5 (online).
CAP Measurement
CAP measurements were obtained using a FibroScan 502 Touch device (model 2.0.5; Echosens) and an M Probe or XL Probe by a trained technician (E.M., 3 years of experience) who was blinded to clinical findings and other imaging results. Detailed methods have been described previously (8). Participants were asked to fast for 4 hours before the visit. For the procedure, participants were placed in the supine position with their right arm behind their head and their right leg over their left leg. Then, the technician acquired 10 successful measurements of the right lobe and selected the median value. The technician used the M (3.5 MHz) or XL (2.5 MHz) probe to assess liver fat content. When instructed by the FibroScan device, the XL probe was used. For CAP, cut points of 288 dB/m or more and 306 dB/m or more were used to diagnose NAFLD (defined as MRI-derived PDFF ≥5%) and MRI-derived PDFF of 10% or more (10), respectively. The sensitivity analysis about the CAP optimal cut points is shown in Appendix E6 (online) and Tables E1 and E2 (online).
Outcome Measures
The primary outcome was the diagnosis of NAFLD at imaging, as defined by MRI-derived PDFF of 5% or more. The secondary outcome was detection of hepatic fat content of 10% or more, as defined by MRI-derived PDFF of 10% or more. Participants with MRI-derived PDFF of 10% or more have been investigated in this study, as the cut point has been widely used as an enrollment criterion for nonalcoholic steatohepatitis–related pharmacologic trials (NCT03551522, NCT04073368, NCT02912260).
Statistical Analyses
Receiver operating characteristic (ROC) curve analyses were used to compare the performance of QUS FF with that of CAP in the detection of NAFLD (defined as MRI-derived PDFF ≥5%) and MRI-derived PDFF of 10% or more. For each ROC analysis, the area under the ROC curve (AUC), sensitivity, specificity, and positive and negative predictive values were calculated. The DeLong test was used to compare the AUCs of QUS and CAP (22). Interquartile range was defined as the difference between the third and first quartiles. Univariate Pearson correlation coefficients were used to calculate the correlations between QUS and MRI-derived PDFF and between CAP and MRI-derived PDFF. Linear regression slope, intercept, and R2 value were evaluated. Limits of agreement were defined as bias ± 1.96 [SD]. Ninety percent Winsorization was used to adjust outliers for a CAP and MRI-derived PDFF scatterplot (Appendix E7 [online]) (23). An experienced biostatistician (R.B., >10 years of experience) analyzed the data using SAS software (version 9.4; SAS Institute). Two-tailed P ≤ .05 was indicative of a significant difference.
On the basis of prior research studies with MRI-derived PDFF as the reference standard, we assumed the AUC of CAP to be 0.80 (95% CI: 0.70, 0.90) in the detection of NAFLD (10), and we conservatively assumed the AUC of QUS FF was 0.93 (24). We used an approximate correlation between CAP and MRI-derived PDFF of 0.5 (25) and estimated a sample size of 117 participants was needed to achieve a power of 0.80 with α = .05 (26).
Results
Participant Characteristics
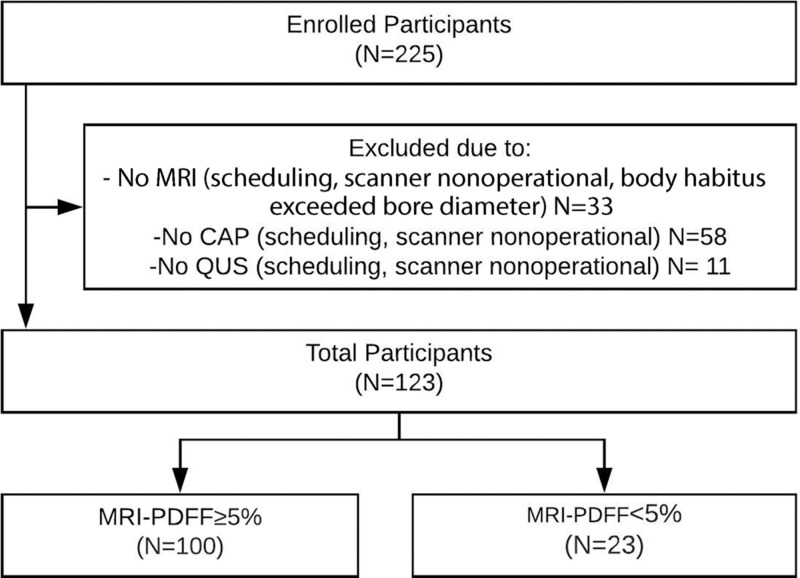
A total of 123 prospectively recruited participants (mean age, 52 years ± 13; 67 [54%] women, 56 [46%] men) with or suspected of having NAFLD with contemporaneous MRI-derived PDFF, QUS, and CAP were included in this study. A detailed study schema is presented in Figure 1. Baseline patient characteristics and imaging results are presented in Table 1.
Figure 1:
Derivation of the study cohort. CAP = controlled attenuation parameter, QUS = quantitative US, PDFF = proton density fat fraction.
Table 1:
Patient Characteristics
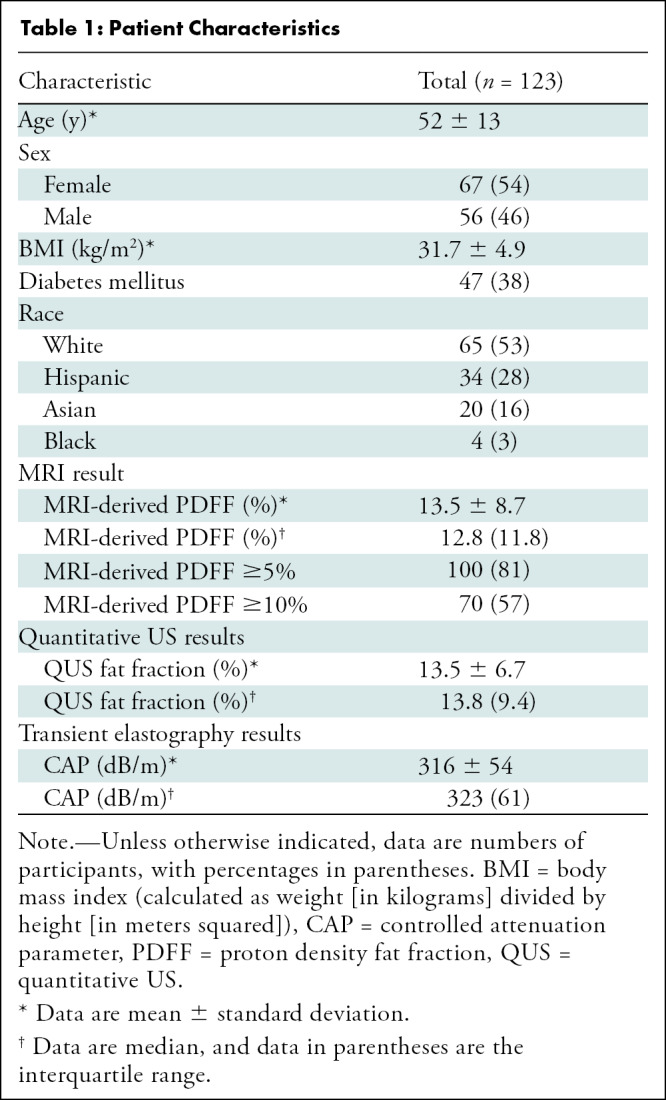
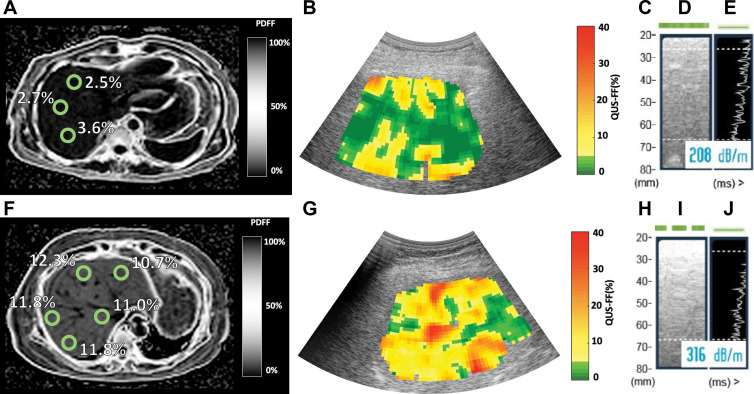
The cohort had a mean body mass index (calculated as weight in kilograms divided by height in meters squared) of 31.7 ± 5.0. One hundred (81%) participants had NAFLD (defined as MRI-derived PDFF ≥5%). Seventy (57%) participants had MRI-derived PDFF of 10% or more. Median MRI-derived PDFF, QUS FF, and CAP were 12.8% (IQR, 11.8%), 13.8% (IQR, 9.4%), and 323 dB/m (IQR, 61 dB/m), respectively. Representative images of MRI-derived PDFF, QUS, and CAP from two participants with MRI-derived PDFFs of 2.6% and 11.5% are shown in Figure 2.
Figure 2:
MRI-derived proton density fat fraction (PDFF), quantitative US (QUS), and controlled attenuation parameter (CAP) images in two representative participants. MRI-derived PDFF values were 2.6% in a 45-year-old man (top row) and 11.5% in a 67-year-old woman (bottom row). For CAP, valid image representation closest to the reported value has been selected as the representative image. (A, F) Representative MRI-derived PDFF images. Circular regions of interest (radius, 1 cm) have been placed on each of the nine Couinaud segments. For this analysis, MRI-derived PDFF values from liver segments five through eight were averaged and used as the reference standard for hepatic fat content. (B, G) Representative QUS fat fraction (FF) images. B-mode reconstructed US images including colorized FF maps (the parametric maps are not intended to show the distribution of fat in the liver; thus, average QUS FF value across the entire field of interest was recorded). Representative CAP images with (C, H) depth explored (in millimeters), (D, I) time-motion mode, and (E, J) amplitude mode.
Comparison of QUS FF Estimator and with CAP in the Diagnosis of NAFLD
QUS FF had a significantly higher AUC for diagnosis of NAFLD (defined by MRI-derived PDFF ≥5%) than did CAP (0.92 [95% CI: 0.87, 0.98] vs 0.79 [95% CI: 0.67, 0.90], P = .03). For QUS, QUS FF of 5% or more was used to diagnose NAFLD. CAP of 288 dB/m or more was used, as suggested by Caussy and colleagues (10). Table 2 shows cross-tabulation of QUS and CAP in relation to diagnosis of NAFLD. QUS had a sensitivity of 98% (95% CI: 93, 100) (98 of 100) and a specificity of 48% (95% CI: 27, 69) (11 of 23), whereas CAP had a sensitivity of 87% (95% CI: 79, 93) (87 of 100) and a specificity of 57% (95% CI: 35, 77) (13 of 23) (Table 3). QUS and CAP had similar positive predictive values (89%, [98 of 110] vs 90% [87 of 97]). QUS had a higher negative predictive value compared with CAP (85% [11 of 13] vs 50% [13 of 26]).
Table 2:
Cross-Tabulation between QUS, CAP, and MRI-derived PDFF of 5% or Greater
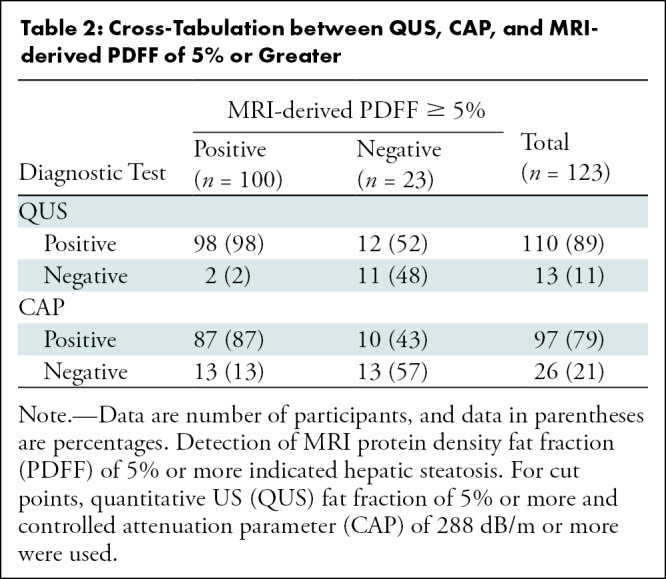
Table 3:
Comparison between QUS and CAP Performance in Detection of MRI-derived PDFF of 5% or More (Hepatic Steatosis) and MRI-derived PDFF of 10% or More (Common Eligibility Criterion for Clinical Trials)
Comparison between QUS FF Estimator and CAP in Detection of MRI-derived PDFF of 10% or More
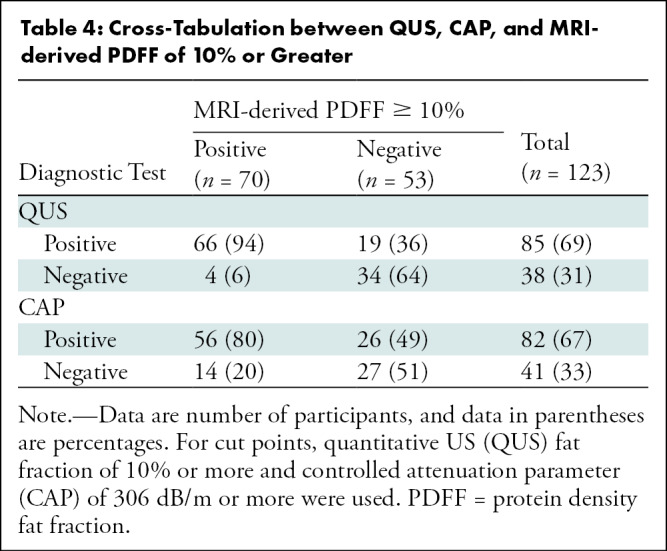
QUS FF had a significantly higher AUC for the detection of MRI-derived PDFF of 10% or more than did CAP (0.90 [95% CI: 0.85, 0.95] vs 0.75 [95% CI: 0.66, 0.84], P = .001), and the difference was clinically relevant and statistically significant. For cut points, QUS FF of 10% or more was used to detect MRI-derived PDFF of 10% or more. CAP of 306 dB/m or more was used, as suggested by Caussy and colleagues (10). Table 4 shows cross-tabulation of QUS and CAP in relation to detection of MRI-derived PDFF of 10% or more. In the detection of participants with MRI-derived PDFF of 10% or more, QUS had a sensitivity of 94% (95% CI: 86, 98) (66 of 70) and a specificity of 64% (95% CI: 50, 77) (34 of 53), whereas CAP had a sensitivity of 80% (95% CI: 69, 89) (56 of 70) and a specificity of 51% (95% CI: 37, 65) (27 of 53) (Table 3). QUS also had a higher positive predictive value compared with CAP (78% [66 of 85] vs 68% [56 of 82]) and a higher negative predictive value (90% [34 of 38] vs 66% [27 of 41]).
Table 4:
Cross-Tabulation between QUS, CAP, and MRI-derived PDFF of 10% or Greater
Agreement between QUS FF Estimator and MRI-derived PDFF and between CAP and MRI-derived PDFF
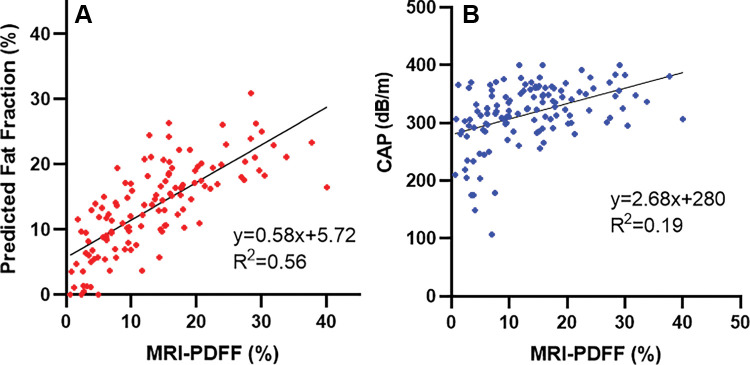
Agreement between QUS FF and MRI-derived PDFF across the entire range of PDFF values is shown on the Bland-Altman plot and scatterplot (Figs 3, 4A). The mean bias between QUS FF and across the range of MRI-derived PDFF values was –0.01% (P = .98). The 95% limits of agreement were 11.3% and –11.4%. Linear regression of QUS FF against MRI-derived PDFF yielded a slope of 0.58, an intercept of 5.7%, and an R2 value of 0.56. The Pearson correlation coefficient was 0.75 (P < .001) for QUS FF versus MRI-derived PDFF. A Winsorized linear regression model for QUS and CAP is described in Appendix E7 (online).
Figure 3:
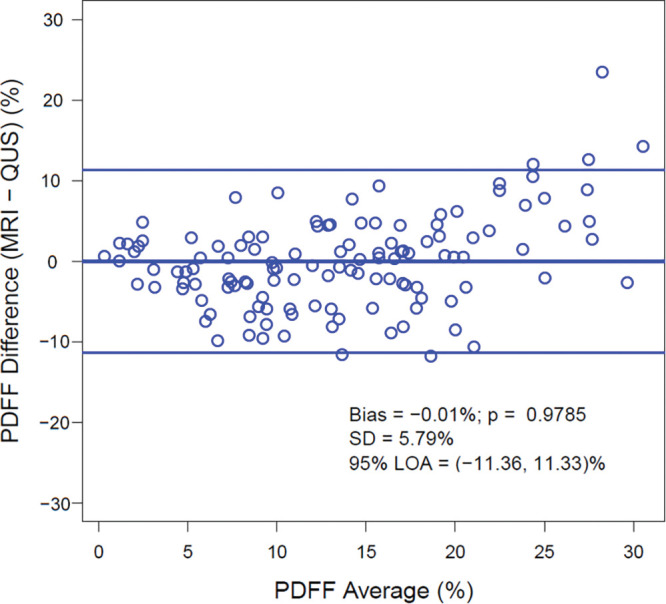
Bland-Altman plot shows the difference between MRI-derived proton density fat fraction (PDFF) and quantitative US (QUS) fat fraction estimator across the entire range of PDFF values. LOA = limits of agreement.
Figure 4:
Scatterplots of (A) quantitative US fat fraction estimator (QUS-FF) versus MRI-derived proton density fat fraction (PDFF) and (B) controlled attenuation parameter (CAP) versus MRI-derived PDFF, along with the linear regression line.
As there is no direct conversion formula between CAP and MRI-derived PDFF, agreement between CAP and MRI-derived PDFF is shown using a scatterplot (Fig 4B). Linear regression of CAP against MRI-derived PDFF yielded a slope of 2.6, an intercept of 280 dB/m, and an R2 value of 0.19. Pearson correlation coefficient was 0.44 (P < .001) for CAP versus MRI-derived PDFF.
Discussion
With the prevalence of nonalcoholic fatty liver disease (NAFLD) increasing in the global population, a noninvasive widely accessible modality with which to detect NAFLD remains an unmet need to clinically assess hepatic steatosis in patients with NAFLD. Although US-based modalities, such as quantitative US (QUS) fat fraction (FF) estimator and controlled attenuation parameter (CAP), have been developed to provide potential point-of-care diagnosis of NAFLD, there has been no comparison between diagnostic accuracy of these modalities in patients at risk for NAFLD. Thus, we sought to compare the two imaging modalities in a well-characterized prospective cross-sectional observational study of participants with or suspected of having NAFLD. QUS FF had a significantly higher area under the receiver operating characteristic curve compared with CAP in the diagnosis of NAFLD (0.92 vs 0.79, P = .03). Likewise, QUS FF was significantly more accurate than CAP in the detection of participants with MRI-derived proton density FF (PDFF) of 10% or more (0.90 vs 0.75, P = .001). QUS FF estimation shows promise as a potential method for hepatic steatosis screening and as a potential diagnostic enrichment biologic marker in the identification of patients who could benefit from pharmacologic trials. High screening failure rates are reported in nonalcoholic steatohepatitis–related pharmacologic trials because participants did not meet the MRI-derived PDFF criteria, regardless of their prescreened CAP results (27). The high positive predictive value of QUS in the diagnosis of MRI-derived PDFF of 10% or more might help reduce the screening failure rate for nonalcoholic steatohepatitis–related pharmacologic trials to less than 30%.
Recently, several studies have proposed use of the attenuation coefficient or backscatter coefficient from the analysis of US echoes to accurately estimate liver fat (7). Although different QUS methods, such as US-guided attenuation parameter (28), attenuation coefficient (29), or attenuation imaging (30), show promise in having similar or high AUC in the detection of hepatic steatosis, those studies included a relatively small number of patients compared with CAP, which warrants verifying their utility in a larger population to verify optimal cut points. Our study validates the findings of Han et al (16) regarding the agreement of QUS FF with MRI-derived PDFF in quantifying and diagnosing hepatic steatosis. More studies are needed to compare diagnostic accuracy of proprietary attenuation imaging methods from different manufacturers (ie, Canon, Hologic, GE Healthcare, Siemens, SuperSonic, and Hitachi).
Our study is also consistent with prior studies that showed that although the FibroScan device (which includes vibration-controlled transient elastography and CAP) has advantages in enabling simultaneous assessment of steatosis and fibrosis, CAP has only moderate accuracy in the detection of hepatic fat content of 5% or more (30). Although CAP has varying optimal cut points for diagnosis of NAFLD (4) and has a low coefficient of determination (Fig 4), QUS FF correlates directly with MRI-derived PDFF results, which makes it easy to use without deriving yet another cut point (Figs 3, 4). Although the specificity of QUS FF was low in the diagnosis of hepatic steatosis, the negative predictive value of QUS FF was lower than that of CAP (85% vs 50%). This suggests that further investigations are needed in primary care settings to reduce false-positive rates.
Several studies suggested that the severity of hepatic steatosis may correlate with lobular inflammation, fibrosis, and presence of steatohepatitis (31). Among patients with no fibrosis at baseline, patients with high liver fat (MRI-derived PDFF ≥15.7%) had a higher proportion of fibrosis progression compared with those with lower liver fat content (MRI-derived PDFF <15.7%) (32). However, detection of and screening for NAFLD are not routinely performed in primary care, diabetes, or obesity clinics because of cost-benefit uncertainties in diagnostic testing and lack of available treatments (33). Pending validation in independent studies, QUS methods may help lower misclassification rate for diagnosis of NAFLD so patients who do not have disease will not need further evaluation. Moreover, it is technically possible to integrate algorithms such as ours into the US machine to automatically display parametric maps (such as those in Fig 2B), allowing inline analysis and documentation of results.
There are some notable limitations in our study. QUS FF was trained with QUS and MRI-derived PDFF data from this study. However, a leave-one-out cross-validation procedure helped minimize bias by deriving QUS FF of each participant without using their own MRI-derived PDFF results. QUS in its current implementation needs phantom calibration, and fields of interest should be drawn manually. However, one-dimensional convolutional neural network algorithms have shown promise by providing a phantom-free approach using raw radiofrequency US data for liver fat quantification (34). In addition, participants were biased toward NAFLD, as 81% of participants had MRI-derived PDFF of 5% or more. However, the cohort portrays the full spectrum of patients seen in a hepatology clinic. Thus, it provides a context for physicians to use QUS to diagnose NAFLD among patients suspected of having NAFLD. Further studies are needed to validate these findings in a primary care or diabetes clinic. Also, the three methods of fat assessment were not always performed on the same day. Finally, we acknowledge that there may be a more complex model for CAP that delineates its relationship with hepatic fat content. Similar to liver fibrosis measurements, growing literature suggests a possibility of novel combination of imaging-based measurements with blood-based biologic markers to achieve greater diagnostic accuracy (35).
In conclusion, in a prospective cohort of participants with or suspected of having nonalcoholic fatty liver disease, we showed that the quantitative US fat fraction (FF) estimator is more accurate than the controlled attenuation parameter in the detection of hepatic steatosis at a MRI-derived proton density FF threshold of 5% or more and 10% or more. Further research will focus on developing a point-of-care quantitative US device for physicians to further extend the availability of this promising technology.
Supported by National Institute of Diabetes and Digestive and Kidney Disease (R01DK106419) and Siemens Healthineers.
Disclosures of conflicts of interest: J.J. No relevant relationships. A.H. No relevant relationships. E.M. No relevant relationships. R.B. No relevant relationships. R.R.L. No relevant relationships. A.S.B. No relevant relationships. M.P.A. No relevant relationships. J.W.E. No relevant relationships. W.D.O. No relevant relationships. K.J.F. Member of Radiology editorial board; consultant for GE Healthcare; grants from Median, Pfizer, GE, and Bayer. C.B.S. Consultant to Blade, Boehringer, and Epigenomics; grants from GE, Siemens, Philips, Bayer, Gilead, and Pfizer; lectures for Pfizer and Medscape; royalties from Wolters Kluwer; stock in Livivos; travel expenses paid by Sun Yat-Sen University; lab service agreements with Enanta, Gilead, ICON, Intercept, Nusirt, Shire, Synageva, and Takeda; consulting under auspices of institution for Advanced Magnetic Resonance Analytics, Bristol Myers Squibb, Exact Sciences, GE Digital, and IBM Watson; unpaid advisor to Quantix Bio. R.L. Institution received grants from Arrowhead Pharmaceuticals, AstraZeneca, Boehringer-Ingelheim, Bristol Myers Squibb, Eli Lilly, Galectin Therapeutics, Galmed Pharmaceuticals, Gilead, Hanmi, Intercept, Inventiva, Ionis, Janssen, Madrigal Pharmaceuticals, Merck, NGM Biopharmaceuticals, Novo Nordisk, Merck, Pfizer, Sonic Incytes, and Terns Pharmaceuticals; consultant to Aardvark Therapeutics, Altimmune, Anylam/Regeneron, Amgen, Arrowhead Pharmaceuticals, AstraZeneca, Bristol Myers Squibb, CohBar, Eli Lilly, Galmed, Gilead, Glympse Bio, Hightide, Inipharma, Intercept, Inventiva, Ionis, Janssen, Madrigal, Metacrine, NGM Biopharmaceuticals, Novartis, Novo Nordisk, Merck, Pfizer, Sagimet, Theratechnologies, 89 Bio, Terns Pharmaceuticals, and Viking Therapeutics; cofounder of LipoNexus.
Abbreviations:
- AUC
- area under the ROC curve
- CAP
- controlled attenuation parameter
- FF
- fat fraction
- NAFLD
- nonalcoholic fatty liver disease
- PDFF
- proton density FF
- QUS
- quantitative US
- ROC
- receiver operating characteristic
References
- 1. Younossi ZM , Koenig AB , Abdelatif D , Fazel Y , Henry L , Wymer M . Global epidemiology of nonalcoholic fatty liver disease-Meta-analytic assessment of prevalence, incidence, and outcomes . Hepatology 2016. ; 64 ( 1 ): 73 – 84 . [DOI] [PubMed] [Google Scholar]
- 2. Dulai PS , Sirlin CB , Loomba R . MRI and MRE for non-invasive quantitative assessment of hepatic steatosis and fibrosis in NAFLD and NASH: Clinical trials to clinical practice . J Hepatol 2016. ; 65 ( 5 ): 1006 – 1016 . [DOI] [PMC free article] [PubMed] [Google Scholar]
- 3. Rinella ME . Nonalcoholic fatty liver disease: a systematic review . JAMA 2015. ; 313 ( 22 ): 2263 – 2273 . [DOI] [PubMed] [Google Scholar]
- 4. Castera L , Friedrich-Rust M , Loomba R . Noninvasive Assessment of Liver Disease in Patients With Nonalcoholic Fatty Liver Disease . Gastroenterology 2019. ; 156 ( 5 ): 1264 – 1281.e4 . [DOI] [PMC free article] [PubMed] [Google Scholar]
- 5. Machado MV , Cortez-Pinto H . Non-invasive diagnosis of non-alcoholic fatty liver disease. A critical appraisal . J Hepatol 2013. ; 58 ( 5 ): 1007 – 1019 . [DOI] [PubMed] [Google Scholar]
- 6. Paige JS , Bernstein GS , Heba E , et al . A Pilot Comparative Study of Quantitative Ultrasound, Conventional Ultrasound, and MRI for Predicting Histology-Determined Steatosis Grade in Adult Noalcoholic Fatty Liver Disease . AJR Am J Roentgenol 2017. ; 208 ( 5 ): W168 – W177 . [DOI] [PMC free article] [PubMed] [Google Scholar]
- 7. Ferraioli G , Soares Monteiro LB . Ultrasound-based techniques for the diagnosis of liver steatosis . World J Gastroenterol 2019. ; 25 ( 40 ): 6053 – 6062 . [DOI] [PMC free article] [PubMed] [Google Scholar]
- 8. Sasso M , Beaugrand M , de Ledinghen V , et al . Controlled attenuation parameter (CAP): a novel VCTETM guided ultrasonic attenuation measurement for the evaluation of hepatic steatosis: preliminary study and validation in a cohort of patients with chronic liver disease from various causes . Ultrasound Med Biol 2010. ; 36 ( 11 ): 1825 – 1835 . [DOI] [PubMed] [Google Scholar]
- 9. Petroff D , Blank V , Newsome PN , et al . Assessment of hepatic steatosis by controlled attenuation parameter using the M and XL probes: an individual patient data meta-analysis . Lancet Gastroenterol Hepatol 2021. ; 6 ( 3 ): 185 – 198 . [DOI] [PubMed] [Google Scholar]
- 10. Caussy C , Alquiraish MH , Nguyen P , et al . Optimal threshold of controlled attenuation parameter with MRI-PDFF as the gold standard for the detection of hepatic steatosis . Hepatology 2018. ; 67 ( 4 ): 1348 – 1359 . [DOI] [PMC free article] [PubMed] [Google Scholar]
- 11. Ferraioli G . CAP for the detection of hepatic steatosis in clinical practice . Lancet Gastroenterol Hepatol 2021. ; 6 ( 3 ): 151 – 152 . [DOI] [PubMed] [Google Scholar]
- 12. Ferraioli G , Berzigotti A , Barr RG , et al . Quantification of Liver Fat Content with Ultrasound: A WFUMB Position Paper . Ultrasound Med Biol 2021. ; 47 ( 10 ): 2803 – 2820 . [DOI] [PubMed] [Google Scholar]
- 13. Han A , Andre MP , Deiranieh L , et al . Repeatability and Reproducibility of the Ultrasonic Attenuation Coefficient and Backscatter Coefficient Measured in the Right Lobe of the Liver in Adults With Known or Suspected Nonalcoholic Fatty Liver Disease . J Ultrasound Med 2018. ; 37 ( 8 ): 1913 – 1927 . [DOI] [PMC free article] [PubMed] [Google Scholar]
- 14. Han A , Labyed Y , Sy EZ , et al . Inter-sonographer reproducibility of quantitative ultrasound outcomes and shear wave speed measured in the right lobe of the liver in adults with known or suspected non-alcoholic fatty liver disease . Eur Radiol 2018. ; 28 ( 12 ): 4992 – 5000 . [DOI] [PMC free article] [PubMed] [Google Scholar]
- 15. Dioguardi Burgio M , Imbault M , Ronot M , et al . Ultrasonic Adaptive Sound Speed Estimation for the Diagnosis and Quantification of Hepatic Steatosis: A Pilot Study . Ultraschall Med 2019. ; 40 ( 6 ): 722 – 733 . [DOI] [PubMed] [Google Scholar]
- 16. Han A , Zhang YN , Boehringer AS , et al . Assessment of Hepatic Steatosis in Nonalcoholic Fatty Liver Disease by Using Quantitative US . Radiology 2020. ; 295 ( 1 ): 106 – 113 . [DOI] [PMC free article] [PubMed] [Google Scholar]
- 17. Tang A , Tan J , Sun M , et al . Nonalcoholic fatty liver disease: MR imaging of liver proton density fat fraction to assess hepatic steatosis . Radiology 2013. ; 267 ( 2 ): 422 – 431 . [DOI] [PMC free article] [PubMed] [Google Scholar]
- 18. Loomba R , Sirlin CB , Ang B , et al . Ezetimibe for the treatment of nonalcoholic steatohepatitis: assessment by novel magnetic resonance imaging and magnetic resonance elastography in a randomized trial (MOZART trial) . Hepatology 2015. ; 61 ( 4 ): 1239 – 1250 . [DOI] [PMC free article] [PubMed] [Google Scholar]
- 19. Imajo K , Kessoku T , Honda Y , et al . Magnetic Resonance Imaging More Accurately Classifies Steatosis and Fibrosis in Patients With Nonalcoholic Fatty Liver Disease Than Transient Elastography . Gastroenterology 2016. ; 150 ( 3 ): 626 – 637.e7 . [DOI] [PubMed] [Google Scholar]
- 20. Tang A , Desai A , Hamilton G , et al . Accuracy of MR imaging-estimated proton density fat fraction for classification of dichotomized histologic steatosis grades in nonalcoholic fatty liver disease . Radiology 2015. ; 274 ( 2 ): 416 – 425 . [DOI] [PMC free article] [PubMed] [Google Scholar]
- 21. Bonekamp S , Tang A , Mashhood A , et al . Spatial distribution of MRI-Determined hepatic proton density fat fraction in adults with nonalcoholic fatty liver disease . J Magn Reson Imaging 2014. ; 39 ( 6 ): 1525 – 1532 . [DOI] [PMC free article] [PubMed] [Google Scholar]
- 22. DeLong ER , DeLong DM , Clarke-Pearson DL . Comparing the areas under two or more correlated receiver operating characteristic curves: a nonparametric approach . Biometrics 1988. ; 44 ( 3 ): 837 – 845 . [PubMed] [Google Scholar]
- 23. Dixon WJ . Simplified Estimation from Censored Normal Samples . The Annals of Mathematical Statistics 1960. ; 31 ( 2 ): 385 – 391 . 387 . [Google Scholar]
- 24. Lin SC , Heba E , Wolfson T , et al . Noninvasive Diagnosis of Nonalcoholic Fatty Liver Disease and Quantification of Liver Fat Using a New Quantitative Ultrasound Technique . Clin Gastroenterol Hepatol 2015. ; 13 ( 7 ): 1337 – 1345.e6 . [DOI] [PMC free article] [PubMed] [Google Scholar]
- 25. Hajian-Tilaki K . Sample size estimation in diagnostic test studies of biomedical informatics . J Biomed Inform 2014. ; 48 : 193 – 204 . [DOI] [PubMed] [Google Scholar]
- 26. Hanley JA , McNeil BJ . A method of comparing the areas under receiver operating characteristic curves derived from the same cases . Radiology 1983. ; 148 ( 3 ): 839 – 843 . [DOI] [PubMed] [Google Scholar]
- 27. Tamaki N , Ajmera V , Loomba R . Non-invasive methods for imaging hepatic steatosis and their clinical importance in NAFLD . Nat Rev Endocrinol 2022. ; 18 ( 1 ): 55 – 66 . [DOI] [PMC free article] [PubMed] [Google Scholar]
- 28. Fujiwara Y , Kuroda H , Abe T , et al . The B-Mode Image-Guided Ultrasound Attenuation Parameter Accurately Detects Hepatic Steatosis in Chronic Liver Disease . Ultrasound Med Biol 2018. ; 44 ( 11 ): 2223 – 2232 . [DOI] [PubMed] [Google Scholar]
- 29. Tamaki N , Koizumi Y , Hirooka M , et al . Novel quantitative assessment system of liver steatosis using a newly developed attenuation measurement method . Hepatol Res 2018. ; 48 ( 10 ): 821 – 828 . [DOI] [PubMed] [Google Scholar]
- 30. Ferraioli G , Maiocchi L , Raciti MV , et al . Detection of Liver Steatosis With a Novel Ultrasound-Based Technique: A Pilot Study Using MRI-Derived Proton Density Fat Fraction as the Gold Standard . Clin Transl Gastroenterol 2019. ; 10 ( 10 ): e00081 . [DOI] [PMC free article] [PubMed] [Google Scholar]
- 31. Masarone M , Rosato V , Dallio M , et al . Role of Oxidative Stress in Pathophysiology of Nonalcoholic Fatty Liver Disease . Oxid Med Cell Longev 2018. ; 2018 : 9547613 . [DOI] [PMC free article] [PubMed] [Google Scholar]
- 32. Ajmera V , Park CC , Caussy C , et al . Magnetic Resonance Imaging Proton Density Fat Fraction Associates With Progression of Fibrosis in Patients With Nonalcoholic Fatty Liver Disease . Gastroenterology 2018. ; 155 ( 2 ): 307 – 310.e2 . [DOI] [PMC free article] [PubMed] [Google Scholar]
- 33. Chalasani N , Younossi Z , Lavine JE , et al . The diagnosis and management of nonalcoholic fatty liver disease: Practice guidance from the American Association for the Study of Liver Diseases . Hepatology 2018. ; 67 ( 1 ): 328 – 357 . [DOI] [PubMed] [Google Scholar]
- 34. Han A , Byra M , Heba E , et al . Noninvasive Diagnosis of Nonalcoholic Fatty Liver Disease and Quantification of Liver Fat with Radiofrequency Ultrasound Data Using One-dimensional Convolutional Neural Networks . Radiology 2020. ; 295 ( 2 ): 342 – 350 . [DOI] [PMC free article] [PubMed] [Google Scholar]
- 35. Jung J , Loomba RR , Imajo K , et al . MRE combined with FIB-4 (MEFIB) index in detection of candidates for pharmacological treatment of NASH-related fibrosis . Gut 2021. ; 70 ( 10 ): 1946 – 1953 . [DOI] [PMC free article] [PubMed] [Google Scholar]


