Abstract
Background
CT biomarkers both inside and outside the pancreas can potentially be used to diagnose type 2 diabetes mellitus. Previous studies on this topic have shown significant results but were limited by manual methods and small study samples.
Purpose
To investigate abdominal CT biomarkers for type 2 diabetes mellitus in a large clinical data set using fully automated deep learning.
Materials and Methods
For external validation, noncontrast abdominal CT images were retrospectively collected from consecutive patients who underwent routine colorectal cancer screening with CT colonography from 2004 to 2016. The pancreas was segmented using a deep learning method that outputs measurements of interest, including CT attenuation, volume, fat content, and pancreas fractal dimension. Additional biomarkers assessed included visceral fat, atherosclerotic plaque, liver and muscle CT attenuation, and muscle volume. Univariable and multivariable analyses were performed, separating patients into groups based on time between type 2 diabetes diagnosis and CT date and including clinical factors such as sex, age, body mass index (BMI), BMI greater than 30 kg/m2, and height. The best set of predictors for type 2 diabetes were determined using multinomial logistic regression.
Results
A total of 8992 patients (mean age, 57 years ± 8 [SD]; 5009 women) were evaluated in the test set, of whom 572 had type 2 diabetes mellitus. The deep learning model had a mean Dice similarity coefficient for the pancreas of 0.69 ± 0.17, similar to the interobserver Dice similarity coefficient of 0.69 ± 0.09 (P = .92). The univariable analysis showed that patients with diabetes had, on average, lower pancreatic CT attenuation (mean, 18.74 HU ± 16.54 vs 29.99 HU ± 13.41; P < .0001) and greater visceral fat volume (mean, 235.0 mL ± 108.6 vs 130.9 mL ± 96.3; P < .0001) than those without diabetes. Patients with diabetes also showed a progressive decrease in pancreatic attenuation with greater duration of disease. The final multivariable model showed pairwise areas under the receiver operating characteristic curve (AUCs) of 0.81 and 0.85 between patients without and patients with diabetes who were diagnosed 0–2499 days before and after undergoing CT, respectively. In the multivariable analysis, adding clinical data did not improve upon CT-based AUC performance (AUC = 0.67 for the CT-only model vs 0.68 for the CT and clinical model). The best predictors of type 2 diabetes mellitus included intrapancreatic fat percentage, pancreatic fractal dimension, plaque severity between the L1 and L4 vertebra levels, average liver CT attenuation, and BMI.
Conclusion
The diagnosis of type 2 diabetes mellitus was associated with abdominal CT biomarkers, especially measures of pancreatic CT attenuation and visceral fat.
© RSNA, 2022
Summary
Deep learning methods demonstrated an association between abdominal CT biomarkers and the diagnosis of type 2 diabetes mellitus.
Key Results
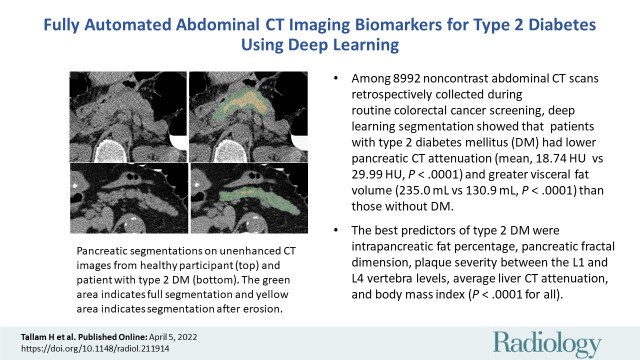
■ Among 8992 noncontrast abdominal CT scans that were retrospectively collected during routine colorectal cancer screening and then underwent deep learning–based pancreatic segmentation, patients with type 2 diabetes mellitus had lower pancreatic CT attenuation (mean, 18.74 HU ± 16.54 vs 29.99 HU ± 13.41, respectively; P < .0001) and greater visceral fat volume (mean, 235.0 mL ± 108.6 vs 130.9 mL ± 96.3; P < .0001) than those without type 2 diabetes mellitus.
■ The best predictors of type 2 diabetes mellitus from a multivariable analysis included intrapancreatic fat percentage, pancreatic fractal dimension, plaque severity between the L1 and L4 vertebra levels, average liver CT attenuation, and body mass index (P < .0001 for all).
Introduction
Type 2 diabetes mellitus is a common disease affecting approximately 13% of all U.S. adults; an additional 34.5% meet the criteria for prediabetes (1). It often develops over several years, with a slow onset of symptoms. Without intervention, patients with impaired blood glucose tests have been shown to develop type 2 diabetes up to 8 years after their initial blood test, indicating a long prodrome phase (2). This slow onset contributes to the approximately 45.8% of undiagnosed adult cases of diabetes globally (3).
CT is a potentially useful modality for diagnosing type 2 diabetes. CT is already widely used in clinical practice and can provide information on morphologic characteristics of the pancreas. For example, studies have shown that the pancreas of a patient with diabetes has a smaller volume than that of a person without diabetes, with an increased amount of intrapancreatic fat and hence lower CT attenuation (4–8).
CT biomarkers outside the pancreas may also play an important role. Patients with type 2 diabetes may have more severe atherosclerosis in pancreas-bound arteries, including the splenic artery in the peripancreatic region, and may show signs of liver disease (9,10). Visceral fat and muscle mass may also be good predictors of type 2 diabetes (11,12).
Although previous work on this topic has shown significant results, those studies have had limitations. Most used manual methods whereby a radiologist or trained specialist identified the pancreas on medical images and then evaluated imaging biomarkers. Because of the time and effort this takes, the study samples have been small, with fewer than 50 patients each. Even in a meta-analysis that combined 17 imaging-based diabetes studies, only a total of 1139 patients with type 2 diabetes mellitus were evaluated across CT, MRI, and US (5).
Previous studies have shown how to leverage the plethora of information available from CT images for the opportunistic screening for various conditions beyond the clinical indication. Examples include screening for osteoporosis, cardiovascular events, and metabolic syndrome (13,14). Yet, opportunistic screening for predicting type 2 diabetes remains lacking. Thus, in this study, we investigated abdominal CT biomarkers for type 2 diabetes in a large clinical data set using fully automated deep learning.
Materials and Methods
Patients
The institutional review board and Office of Human Research Subjects Protection at the respective institutions approved this retrospective cohort study. We used a data set collected from consecutive patients undergoing routine CT colonography (CTC) at the University of Wisconsin Hospital & Clinics (UWHC), Madison, from 2004 to 2016. All patients who underwent routine CTC in the supine position were included unless their CT images were damaged or they were missing clinical data. Diagnosis of type 2 diabetes mellitus was identified through a systematic electronic health record search algorithm. We searched for diagnosis and date of any abnormal glucose test results, including diagnosis of type 2 diabetes. Patients whose scans could not be accurately processed with the automated pancreas segmentor developed for this study were also removed.
The CTC data set used for this study has also been used in other published works (14–19). Our study differs from the others in that it pertains to biomarkers of type 2 diabetes specifically and used automated pancreatic segmentations on noncontrast CT scans, whereas the other studies focused on biomarkers of other disease states (eg, atherosclerotic plaque burden or metabolic syndrome) using different models of detection.
CT Study Protocols
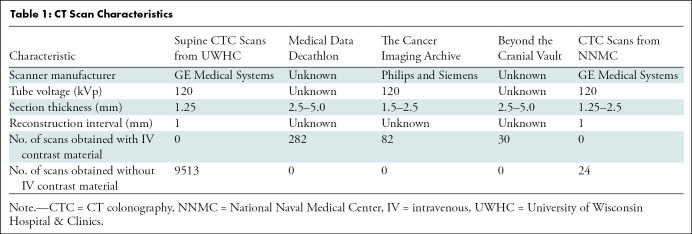
Transverse abdominal CT images were obtained with the patient in the supine position without intravenous contrast material for CT colonography. As previously described (18), patients underwent bowel preparation with cleansing and oral contrast agents. Then the bowel was distended using carbon dioxide delivered through a rectal tube under low pressure. Images were reconstructed with 1.25-mm-thick sections and 1-mm section intervals. Reconstruction parameters were adjusted on the basis of patient size. A soft-tissue algorithm was applied for reconstruction. The tube voltage used was 120 kVp. CT image characteristics are shown in Table 1.
Table 1:
CT Scan Characteristics
Deep Learning Algorithm for Pancreas Segmentation
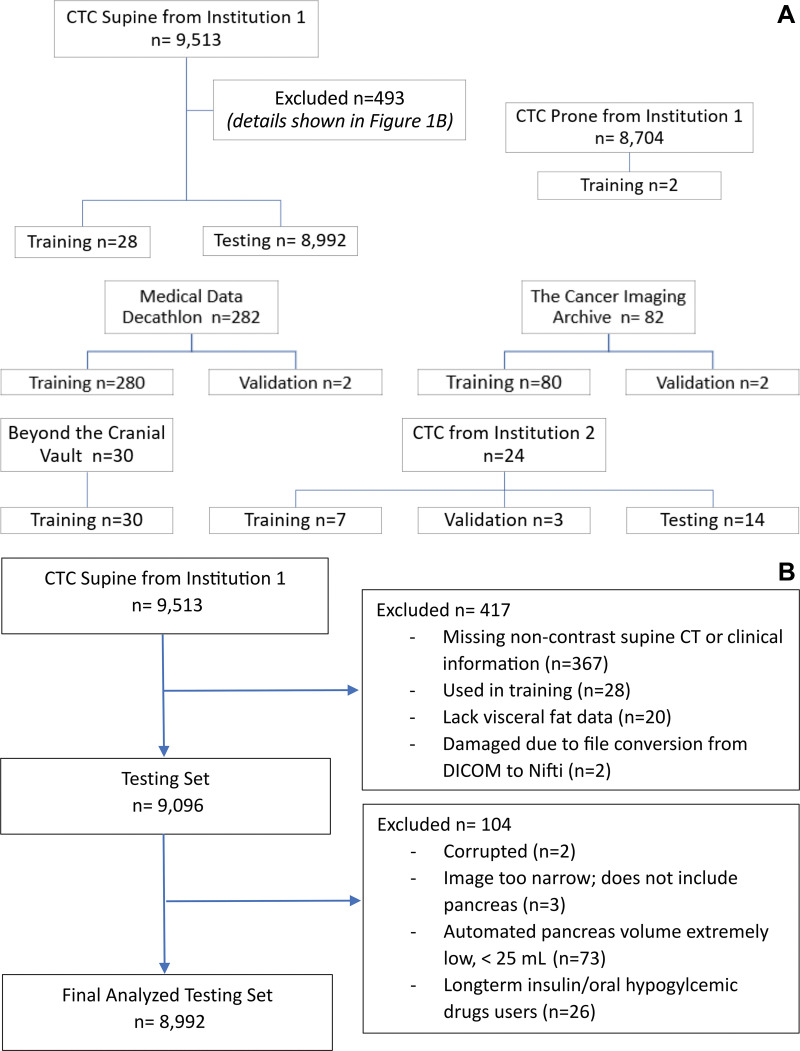
The data set used to develop this deep learning software on PyTorch consisted of ground-truth labels for 280 intravenous contrast-enhanced CT images from the Medical Data Decathlon (20), 82 contrast-enhanced CT images from The Cancer Imaging Archive (21), 30 contrast-enhanced CT images from the Beyond the Cranial Vault challenge (22,23), 24 noncontrast CTC images from the National Naval Medical Center, Bethesda, Md (24), and 55 noncontrast CTC images from UWHC. These 471 images were divided into training, validation, and test sets. Of the 424 CT images used for training, 40 were noncontrast CT scans and 384 were contrast-enhanced CT scans. Eight images were used for validation. Fourteen noncontrast CTC images from the National Naval Medical Center and 25 noncontrast CTC images from UWHC were used as test sets. Figure 1A shows a Standards for Reporting Diagnostic Accuracy chart of the training, validation, and testing splits. Further details of the deep learning software development are provided in Appendix E1 (online).
Figure 1:
Standards for Reporting Diagnostic Accuracy flowcharts. (A) Chart shows patient flow in deep learning model development. Institution 1 is the University of Wisconsin Hospital & Clinics, and institution 2 is the National Naval Medical Center. (B) Chart shows patient flow in clinical study. CTC = CT colonography, DICOM = Digital Imaging and Communications in Medicine.
Four rounds of active learning were performed to develop a three-dimensional U-net model. After each round, outliers were identified (as described in Appendix E1 [online]) and manually segmented using 3D Slicer (version 4.11.20210226). In total, 30 CTC images were added to the training data set for this indication (Fig 1A). The pancreas segmentations obtained from active learning were weighted four times higher when the data set was sampled during training. The three-dimensional U-net model was saved at three different stages of training (24 000, 26 000, and 29 000 iterations). The three models were combined to create a “temporal ensemble” in which the three models were run and their soft max outputs were averaged to get a final result. Postprocessing was performed to select the largest connected component.
Determination of Pancreas Features
For each CT image, several measurements were taken from the automated pancreas segmentations: CT attenuation in Hounsfield units (average, SD, and median), pancreatic volume in milliliters, intrapancreatic fat percentage, and three-dimensional fractal dimension. Intrapancreatic fat percentage was determined using the fraction of voxels between –190 HU and –30 HU in the pancreatic segmentation. Fractal dimension analysis was done using a box counting method programmed with Python 3.8 (https://github.com/ChatzigeorgiouGroup/FractalDimension).
The automated pancreatic segmentations were postprocessed with erosions to minimize partial volume effects that could adversely affect pancreas CT attenuation and fat content measurements. Morphologic erosions of 2 mm in the x, y, and z directions were applied in three dimensions to remove any edges of the pancreatic segmentations that may not be accurate. The erosion algorithm used is scipy.ndimage.morphology.binary_erosion. Both original and eroded pancreas volumes were subsequently used for analysis of pancreatic fat content and CT attenuation in Hounsfield units for all patients.
Extrapancreatic biomarkers were also analyzed, including visceral fat, abdominal and peripancreatic atherosclerotic plaque (measured in Agatston scores), average liver and muscle CT attenuation, and muscle volume. Details of how these measurements were obtained are included in Appendix E1 (online).
Verification of Deep Learning Model
We performed a subanalysis after stratifying patients according to the percentage of measured visceral fat. Patients were split into quintiles ranging from low to high visceral fat. This analysis was motivated by the understanding that the amount of visceral fat in a patient has a substantial impact on the success of a deep learning method for pancreas segmentation (25). Five patients were randomly chosen from each of these five visceral fat groups. The pancreas was manually segmented on the CT images for these 25 selected cases by a trained research assistant (H.T.) and subsequently checked by a board-certified radiologist with 28 years of postresidency experience (R.M.S.). Readers were blinded to clinical information associated with CT images during development and verification of the deep learning model. All labels were produced using 3D Slicer.
Analysis of Inter- and Intraobserver Variability
To assess interobserver variability of the segmentations, the same 25 randomly selected test cases that were used to assess deep learning performance were relabeled by another board-certified radiologist (S.L., with 12 years of postresidency experience). The second observer produced manual pancreas segmentations for the same 25 cases while blinded to the first observer’s segmentations. For the intraobserver variability study, the 25 cases were segmented once again by the first observer 1 month after the ground truth or first batch of segmentations was produced. The second batch of segmentations was checked by the same radiologist who checked the first batch.
Statistical Analysis
The manual segmentations for the 25 randomly selected cases (described in the Verification of Deep Learning Model section) acted as ground-truth segmentations. They were then compared with their corresponding automated segmentations using standard metrics: Dice similarity coefficient (DSC), Hausdorff distance, Jaccard index, average symmetric surface distance, and relative average volume difference. One-way analysis of variance for these metrics was performed with the five visceral fat groups. A linear regression was done to compare DSCs with the relative percentages of visceral fat. The measurements of CT attenuation, volume, fat content, and fractal dimension were also compared between the automated and manual segmentations with the paired sample t test.
For the intraobserver analysis, the ground-truth segmentations were compared with manual segmentations produced by a second observer using DSC, Hausdorff distance, Jaccard index, average symmetric surface distance, and relative average volume difference. For the interobserver study, the first and second batches of segmentations were compared using the same metrics.
A series of univariable and multivariable logistic regressions were then performed to determine the best predictors of type 2 diabetes. Participants were categorized into three groups: those with type 2 diabetes, those with dysglycemia, and those without diabetes. The group with diabetes did not include patients with type 1 diabetes mellitus; only patients with type 2 diabetes were included. The groups with diabetes and dysglycemia were further subdivided into four groups depending on the time between diagnosis and CT. These groups consisted of those who underwent CT at least 2500 days before diagnosis of diabetes, those who underwent CT 0–2499 days before diagnosis, those who underwent CT 0–2499 days after diagnosis, and those who underwent CT at least 2500 days after diagnosis. In the multinomial logistic regression (ie, generalized logit model), the response variable was the type 2 diabetes diagnosis, with only the nondiabetic group and four diabetic groups included (ie, with five nominal categories) (Table E1 [online]). The explanatory variables consisted of 28 factors, including 23 CT-derived factors and five clinical factors (sex, age, body mass index [BMI], BMI >30 kg/m2, and height), as shown in Table E2 (online).
For the univariable analysis, multinomial logistic regression models were fitted for each of the 28 explanatory variables individually. For the multivariable analysis, a stepwise approach was used to determine the optimal set of explanatory variables. Reported P values were not adjusted for multiple testing. Instead, a general rule-of-thumb P value threshold of .0018 (0.05/28) was used for determining whether to include variables in the final model. The best set of predictors was determined with stepwise logistic regression from among CT-derived factors only, from clinical factors only, and from the combination of both. A secondary approach was also used, in which the stepwise method was combined with the addition of the lowest Schwarz information criterion to determine the optimal set of explanatory variables. All statistical analyses were performed with SAS software, version 9.4 (SAS Institute). Analyses included obtaining pairwise areas under the receiver operating characteristic curve (AUCs) with 95% CIs and predicted probabilities of falling into each patient group based on multivariable analysis. The multilevel AUCs were obtained using the SAS macro %MultAUC (26).
Results
Patient Characteristics
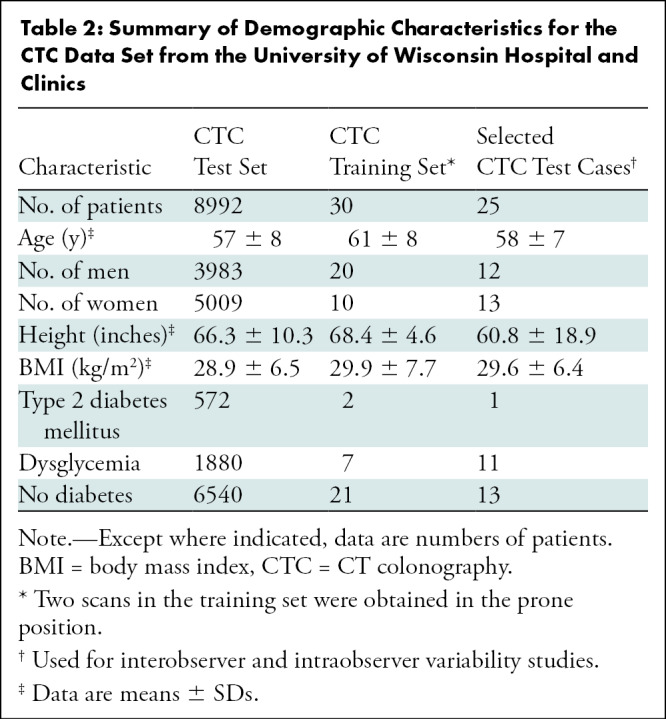
Our data set consisted of 8992 patients (mean age, 57 years ± 8 [SD]; 5009 women), of whom 572 were diagnosed with type 2 diabetes and 1880 with dysglycemia. There was no overlap between diagnoses of diabetes and dysglycemia. Patient demographic characteristics are shown in Table 2. A Standards for Reporting Diagnostic Accuracy chart showing patient flow is shown in Figure 1B.
Table 2:
Summary of Demographic Characteristics for the CTC Data Set from the University of Wisconsin Hospital and Clinics
Accuracy of Pancreas Segmentation
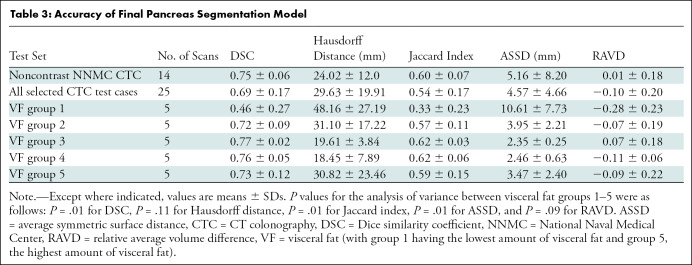
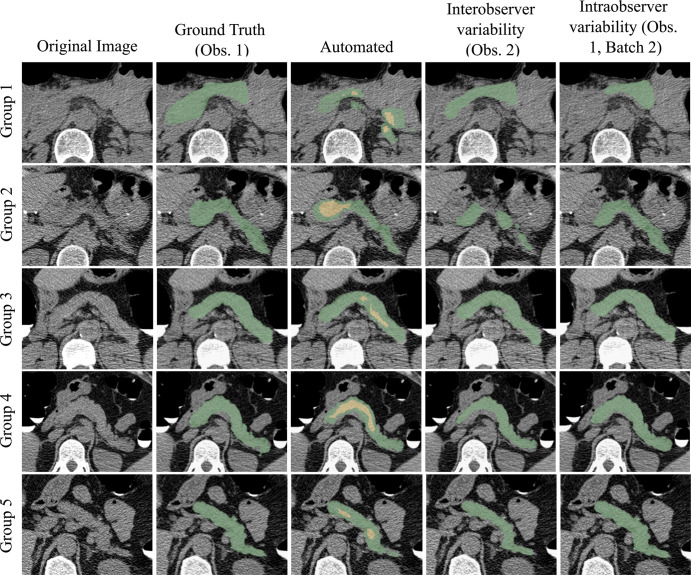
The deep learning model had a mean DSC of 0.69 ± 0.17 and a mean Jaccard index of 0.54 ± 0.17 (Table 3). Patients with low visceral fat percentage had lower accuracies for pancreas segmentation. There were differences among the five visceral fat groups for the DSC (P = .01), Jaccard index (P = .01), and average symmetric surface distance (P = .01). Group 1, with the lowest visceral fat percentage, had poorer scores than groups 2–5 (P < .05). There was no evidence of a difference among the five groups for Hausdorff distance (P = .11) and relative average volume difference (P = .094). There was a positive correlation between DSC with the relative percentages of visceral fat (r2 = 0.17; P = .04). Patients with visceral fat percentage greater than 15% had consistently higher DSCs (Fig E1 [online]). Figure 2 shows examples of the various segmentations performed on images in patients from the five different visceral fat groups.
Table 3:
Accuracy of Final Pancreas Segmentation Model
Figure 2:
Pancreas segmentations in patients from each of the five visceral fat groups. Segmentation performance is better for patients with higher visceral fat (group 5 being the highest). Visceral fat percentages at the L1 level for the specific patients shown here were 9.81% in group 1, 13.72% in group 2, 20.19% in group 3, 27.88% in group 4, and 32.42% in group 5; Dice similarity coefficients were 0.36, 0.62, 0.78, 0.81, and 0.86, respectively. In the automated segmentation images, the green area indicates full segmentation and the yellow area indicates segmentation after erosion. Obs. = observer.
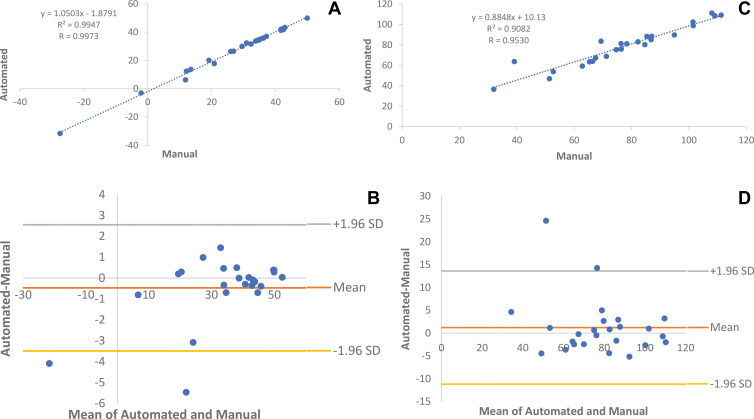
On the basis of paired sample t tests, no evidence of a difference was found for any metrics between manual and automated pancreas segmentations (Table E3 [online]). Linear regressions and Bland-Altman plots showed minimal differences in average Hounsfield units (r2 = 0.99, P < .001; Bland-Altman 95% limits of agreement: –3.49 to 2.55 HU) and total pancreas volume (r2 = 0.91, P < .001; Bland-Altman 95% limits of agreement: –11.18 to 13.60 mL) in the automated and manual segmentations (Fig 3).
Figure 3:
Automated and manual measurements for 25 randomly selected patients who underwent supine CT colonography. (A, B) Comparison of average CT attenuation in Hounsfield units with (A) linear regression and (B) Bland-Altman plots (r2 = 0.99, P < .001; Bland-Altman 95% limits of agreement: –3.49 to 2.55 HU). (C, D) Comparison of pancreas volume in milliliters with (C) linear regression and (D) Bland-Altman plots (r2 = 0.91, P < .001; Bland-Altman 95% limits of agreement: –11.18 to 13.60 mL).
Inter- and Intraobserver Variability
In the interobserver variability study, the mean DSC and Jaccard index were 0.69 ± 0.09 and 0.53 ± 0.11, respectively, showing relative consistency between the two observers. In the intraobserver variability study, the mean DSC and Jaccard index were 0.81 ± 0.10 and 0.69 ± 0.13, respectively. The complete results of the interobserver and intraobserver variability analyses are shown in Table 4.
Table 4:
Inter- and Intraobserver Variability Study Results
Associations between Imaging Findings and Diagnosis of Diabetes and Dysglycemia
From the univariable analysis on each of the 28 explanatory variables, multilevel AUCs ranged from 0.51 to 0.62; the three highest AUCs corresponded to visceral fat volume, BMI, and average pancreas CT attenuation (Table E4 [online]). Patients with diabetes had, on average, lower pancreas CT attenuation (mean, 18.74 HU ± 16.54 vs 29.99 HU ± 13.41, respectively; P < .0001) and greater visceral fat volume (mean, 235.0 mL ± 108.6 vs 130.9 mL ± 96.3; P < .0001) than participants without diabetes.
In the multivariable analysis, the final model, which included both CT-derived and clinical factors (sex, age, BMI, BMI >30 kg/m2, and height), produced a multilevel AUC of 0.68 (Table E5 [online]). This value is similar to the multilevel AUCs for the model with only CT-derived factors and the model with only clinical factors (0.67 and 0.63, respectively) (Table E5 [online]). The optimal set of predictors chosen in the final model included intrapancreatic fat percentage (in total and eroded volumes), pancreas fractal dimension, severity of plaque in the L1–L4 vertebra level (determined with the Agatston score), average liver CT attenuation, and BMI (P <.0001 for all six variables). Adding clinical data did not improve upon CT-based AUC performance, as shown in Table E5 (online). The final multivariable model resulted in high pairwise AUCs ranging from 0.81 to 0.92, as shown in Table 5.
Table 5:
Pairwise AUCs from Multivariable Analysis
With the addition of the Schwarz information criterion for variable selection in the multivariable models, fewer variables were selected (shown in Table E5 [online]). In the final model (CT-derived and clinical), with the Schwarz information criterion, visceral fat volume replaced several pancreatic measurements. There was no significant difference in AUCs with the addition of the Schwarz information criterion, and the variables that were no longer selected after the addition of the Schwarz information criterion in the final model also had low P values (P < .0001 for all removed variables). For these reasons and the clinical relevance of the variables that were not selected after the addition of the Schwarz information criterion, we elected to keep the results obtained before the addition of the Schwarz information criterion.
All odds ratios (ORs) and their 95% CIs for the optimal predictors chosen in the final multivariable model are shown in Figure E2 (online). Healthy participants without diabetes are the reference group for all ORs. The ORs for intrapancreatic fat from the total and eroded volume ranged from 1.16 to 1.25 and from 0.82 to 0.90, respectively. The ORs for pancreas fractal dimension ranged from 0.37 to 1.22. Note that the values for fractal dimension were multiplied by 10 to normalize the ORs. The ORs for severity of plaque (determined categorically) between patients with an Agatston score of 0 and those with an Agatston score greater than 300 ranged from 1.73 to 3.60. The Agatston scores used were divided by 100 to also normalize the ORs. The ORs for average liver CT attenuation and BMI ranged from 0.96 to 0.99 and from 1.08 to 1.13, respectively.
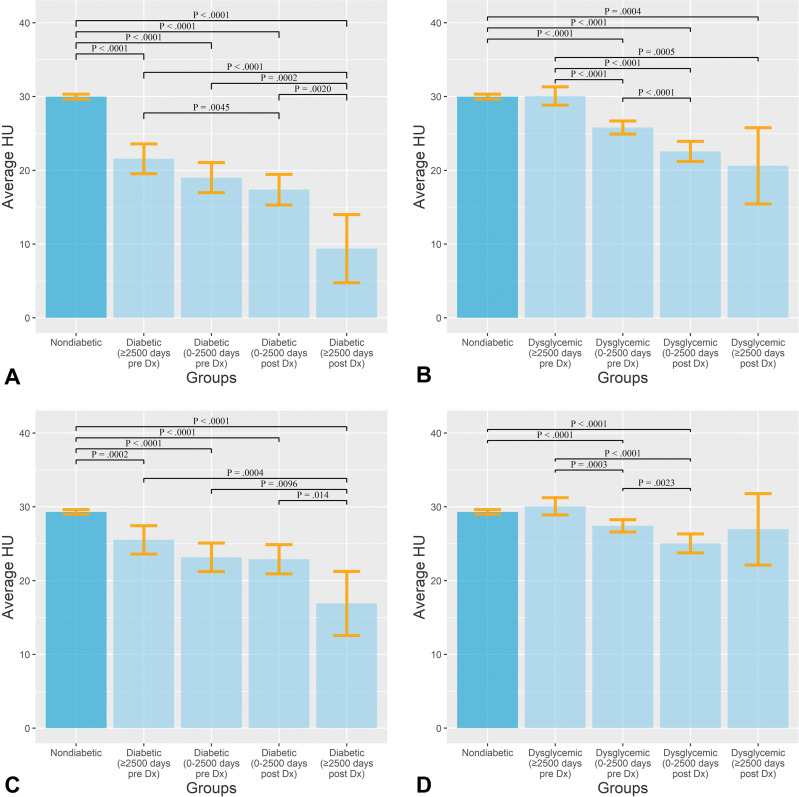
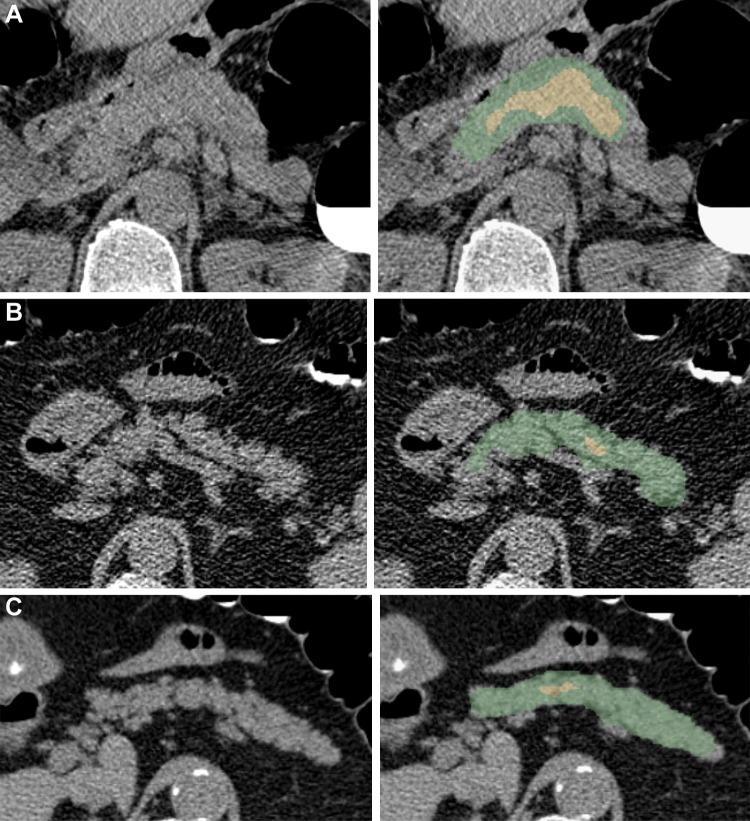
In a further analysis of average pancreas attenuation in all groups, we found not only that patients with diabetes and dysglycemia had lower mean attenuation values compared with patients in the nondiabetic groups but also that the longer the duration of disease or prodrome phase, the lower the average attenuation (Fig 4). Example images in patients with and without diabetes are shown in Figure 5. On the basis of the final multivariable model with the optimal set of CT-derived and clinical predictors, we estimated the probabilities of a patient falling into the nondiabetic or diabetic group as a function of intrapancreatic fat. This resulted in distinct patterns between the nondiabetic and diabetic groups (Fig E3 [online]).
Figure 4:
(A, B) Bar graphs show average Hounsfield units of pancreas in patients with (A) type 2 diabetes mellitus and (B) dysglycemia compared with participants without diabetes. (C, D) Bar graphs show average Hounsfield units of pancreas after controlling for body mass index in patients with (C) type 2 diabetes and (D) dysglycemia compared with participants without diabetes. Error bars show 95% CIs. Numbers in parentheses are the times between diagnosis (Dx) and imaging.
Figure 5:
Examples of pancreas segmentations on unenhanced axial abdominal CT images in healthy participants and patients with type 2 diabetes mellitus. Images on left are original CT images, and images on right show segmentations overlaid on the original CT images. (A) Images in a nondiabetic 61-year-old man with average pancreas CT attenuation of 35.50 HU ± 47.96 and pancreatic volume of 97.6 mL. (B) Images in a 59-year-old man with type 2 diabetes who was diagnosed 144 days before CT. Average pancreas CT attenuation was 20.66 HU ± 81.99 and pancreatic volume was 77.10 mL. (C) Images in a 67-year-old man with type 2 diabetes who was diagnosed 595 days after CT. Average pancreas CT attenuation was 18.46 HU ± 48.30 and pancreatic volume was 72.88 mL. The green area indicates full segmentation and the yellow area indicates segmentation after erosion.
Associations of Pancreas Volume with Age and Sex
Pancreas volume decreased with age (Fig E4 [online]). On average, men had larger pancreas volumes than women (P < .001).
Discussion
In this study, we aimed to investigate several fully automated deep learning–based CT biomarkers that may be associated with the presence of type 2 diabetes mellitus in a large data set of patients undergoing CT screening for colorectal cancer. Our results indicate that machine-to-person variability for the deep learning software was comparable to the person-to-person variability, as we found no evidence of a difference between the deep learning Dice similarity coefficient (DSC) and the interobserver DSC (mean, 0.69 ± 0.17 vs 0.69 ± 0.09; P = .92). The intraobserver DSC (mean, 0.81 ± 0.10) was also very high, proving reliability in the ground-truth segmentations. Through a univariable analysis, we found that patients with diabetes had, on average, lower pancreatic CT attenuation (mean, 18.74 HU ± 16.54 vs 29.99 HU ± 13.41; P < .0001) and greater visceral fat volume (mean, 235.0 mL ± 108.6 vs 130.9 mL ± 96.3; P < .0001) than participants without diabetes. The multivariable analysis showed that the CT-derived factors had considerable predictive power. Of the six variables selected as the optimal set of predictors in the final multivariable model, five were CT-derived: intrapancreatic fat percentage in total and eroded volumes, pancreas fractal dimension, plaque severity between the L1 and L4 vertebra levels, and average liver CT attenuation (P < .0001 for all; pairwise areas under the receiver operating characteristic curve ranged from 0.81 to 0.92). This proves the final model’s ability to discern patients with type 2 diabetes before and after diagnosis from participants without diabetes.
The pancreas segmentations achieved through deep learning were accurate and reproducible, with a mean DSC of 0.69 ± 0.17. Although higher DSCs have been reported for pancreas segmentation at contrast-enhanced CT, little work, if any, has been done with noncontrast CT, which is a more challenging problem (15). The intra- and interobserver variabilities were consistent with those found in the literature for contrast-enhanced CT (27,28). This result is notable given the difficulty of pancreas segmentation on relatively high-noise, low-radiation-dose noncontrast CTC images.
This study showed that patients with type 2 diabetes had, on average, lower average pancreas, muscle, and liver CT attenuation; higher SD in pancreas CT attenuation; and lower pancreas fractal dimension. These findings point to high amounts of peri-organ and intra-organ fat, which are related to and consistent with previous work showing that patients with diabetes tend to accumulate more visceral and intrapancreatic fat than do persons without diabetes (5,6,8,11). Interestingly, several previous studies showed that patients with type 2 diabetes had smaller pancreas volumes than matched healthy controls, whereas our study did not find the same result (4,5,7). Patients with type 2 diabetes showed no significant difference in pancreas volume when compared with those who did not have diabetes after adjustment for BMI. This may be due to a difference in analysis methods. It has also been previously reported that patients with type 2 diabetes specifically show parenchymal tissue loss compared with healthy individuals (7). Perhaps the loss of parenchymal tissue in patients with type 2 diabetes is offset by the increase in intrapancreatic fat. A higher amount of abdominal plaque in patients with type 2 diabetes compared with those without diabetes is consistent with the literature. However, with the technique we used, we could not prove that there is more plaque in pancreas-bound arteries in the peripancreatic region in patients with type 2 diabetes (9,10). The multivariable analysis in our study using both pancreatic and extrapancreatic features is a novel approach and, to our knowledge, has not been shown in previous studies. Of note, the multivariable model with only CT-derived and clinical factors achieved high AUCs without serum markers such as glucose and hemoglobin A1c.
This study had expected limitations involving the use of deep learning software for pancreas segmentation. The pancreas can be difficult to segment both manually and automatically on low-radiation-dose noncontrast CTC images, particularly in patients with little visceral fat (25). These challenges were addressed as best as possible through active learning and the use of various training data. Nonetheless, the model achieved DSCs averaging 0.69 on the selected CTC test cases, which is state-of-the-art deep learning performance for pancreas segmentation at noncontrast CT (29). In addition, limitations were tied to the retrospective design of the study. For example, study participants had a CT scanning date that ranged from 5055 days before diabetes diagnosis to 4822 days after diagnosis. This added complexity to how the data were analyzed; patients with diabetes had to be separated into four groups based on time since diagnosis. Although these four groups are referred to as diabetes groups, the stage of disease in these patients at the time of CT could not be determined because this may vary person to person. It should be noted that diabetes is known to have slow symptom onset, with a large prodrome phase that can last up to 8 years (2). Hence, patients in these groups were assumed to have sufficiently similar health conditions to be grouped together. Another limitation was that the final model did not include additional clinical factors such as race and/or ethnicity, family history, blood lipid level, hypertension, blood glucose levels, and hemoglobin A1c level. This might have improved the final model.
In conclusion, our study shows that through a multivariable approach, we can use fully automated abdominal CT biomarkers for the opportunistic detection and prediction of type 2 diabetes mellitus at CT performed for other indications. In the field of medical image analysis, improvement in automated pancreas segmentations and its application to clinical problems is needed (30). This study is a step toward the wider use of automated methods to address clinical challenges. Future work may be focused on predicting type 2 diabetes in a prospective study. The current study may also inform future research on the reasons for the changes that occur in morphologic characteristics of the pancreas in patients with diabetes. However, we ultimately hope that the CT biomarkers investigated herein might inform diagnosis of early stages of type 2 diabetes and allow patients to make lifestyle changes to alter the course.
Acknowledgments
Acknowledgment
This work utilized the computational resources of the National Institutes of Health high-performance computing Biowulf cluster.
P.J.P. and R.M.S are co-senior authors.
Supported by the Intramural Research Program of the National Institutes of Health, Clinical Center.
Disclosures of conflicts of interest: H.T. Medical school scholarship from RSNA to attend the 2021 annual meeting. D.C.E. No relevant relationships. S.L. No relevant relationships. P.W. No relevant relationships. P.J.P. Consulting fees from Bracco and Zebra; stock or stock options in SHINE, Elucent, and Cellectar. R.M.S. Grants from PingAn; patent royalties and/or software licenses from iCAD, Philips, ScanMed, PingAn, and Translation Holdings; member of the Radiology: AI editorial board.
Abbreviations:
- AUC
- area under the receiver operating characteristic curve
- BMI
- body mass index
- CTC
- CT colonography
- DSC
- Dice similarity coefficient
- OR
- odds ratio
- UWHC
- University of Wisconsin Hospital and Clinics
References
- 1. US Preventive Services Task Force ; Davidson KW , Barry MJ , et al . Screening for prediabetes and type 2 diabetes: US Preventive Services Task Force recommendation statement . JAMA 2021. ; 326 ( 8 ): 736 – 743 . [DOI] [PubMed] [Google Scholar]
- 2. Lindström J , Ilanne-Parikka P , Peltonen M , et al . Sustained reduction in the incidence of type 2 diabetes by lifestyle intervention: follow-up of the Finnish Diabetes Prevention Study . Lancet 2006. ; 368 ( 9548 ): 1673 – 1679 . [DOI] [PubMed] [Google Scholar]
- 3. Beagley J , Guariguata L , Weil C , Motala AA . Global estimates of undiagnosed diabetes in adults . Diabetes Res Clin Pract 2014. ; 103 ( 2 ): 150 – 160 . [DOI] [PubMed] [Google Scholar]
- 4. DeSouza SV , Singh RG , Yoon HD , Murphy R , Plank LD , Petrov MS . Pancreas volume in health and disease: a systematic review and meta-analysis . Expert Rev Gastroenterol Hepatol 2018. ; 12 ( 8 ): 757 – 766 . [DOI] [PubMed] [Google Scholar]
- 5. Garcia TS , Rech TH , Leitão CB . Pancreatic size and fat content in diabetes: a systematic review and meta-analysis of imaging studies . PLoS One 2017. ; 12 ( 7 ): e0180911 . [DOI] [PMC free article] [PubMed] [Google Scholar]
- 6. Gilbeau JP , Poncelet V , Libon E , Derue G , Heller FR . The density, contour, and thickness of the pancreas in diabetics: CT findings in 57 patients . AJR Am J Roentgenol 1992. ; 159 ( 3 ): 527 – 531 . [DOI] [PubMed] [Google Scholar]
- 7. Saisho Y , Butler AE , Meier JJ , et al . Pancreas volumes in humans from birth to age one hundred taking into account sex, obesity, and presence of type-2 diabetes . Clin Anat 2007. ; 20 ( 8 ): 933 – 942 . [DOI] [PMC free article] [PubMed] [Google Scholar]
- 8. Al-Mrabeh A , Hollingsworth KG , Shaw JAM , et al . 2-year remission of type 2 diabetes and pancreas morphology: a post-hoc analysis of the DiRECT open-label, cluster-randomised trial . Lancet Diabetes Endocrinol 2020. ; 8 ( 12 ): 939 – 948 . [DOI] [PubMed] [Google Scholar]
- 9. Alexandre-Heymann L , Barral M , Dohan A , Larger E . Patients with type 2 diabetes present with multiple anomalies of the pancreatic arterial tree on abdominal computed tomography: comparison between patients with type 2 diabetes and a matched control group . Cardiovasc Diabetol 2020. ; 19 ( 1 ): 122 . [DOI] [PMC free article] [PubMed] [Google Scholar]
- 10. Tolman KG , Fonseca V , Dalpiaz A , Tan MH . Spectrum of liver disease in type 2 diabetes and management of patients with diabetes and liver disease . Diabetes Care 2007. ; 30 ( 3 ): 734 – 743 . [DOI] [PubMed] [Google Scholar]
- 11. Wu J , Gong L , Li Q , et al . A novel visceral adiposity index for prediction of type 2 diabetes and pre-diabetes in Chinese adults: a 5-year prospective study . Sci Rep 2017. ; 7 ( 1 ): 13784 . [DOI] [PMC free article] [PubMed] [Google Scholar]
- 12. Hong S , Chang Y , Jung HS , Yun KE , Shin H , Ryu S . Relative muscle mass and the risk of incident type 2 diabetes: A cohort study . PLoS One 2017. ; 12 ( 11 ): e0188650 . [DOI] [PMC free article] [PubMed] [Google Scholar]
- 13. Pickhardt PJ , Graffy PM , Perez AA , Lubner MG , Elton DC , Summers RM . Opportunistic screening at abdominal CT: use of automated body composition biomarkers for added cardiometabolic value . RadioGraphics 2021. ; 41 ( 2 ): 524 – 542 . [DOI] [PMC free article] [PubMed] [Google Scholar]
- 14. Pickhardt PJ , Graffy PM , Zea R , et al . Utilizing fully automated abdominal CT-based biomarkers for opportunistic screening for metabolic syndrome in adults without symptoms . AJR Am J Roentgenol 2021. ; 216 ( 1 ): 85 – 92 . [DOI] [PubMed] [Google Scholar]
- 15. Summers RM , Elton DC , Lee S , et al . Atherosclerotic plaque burden on abdominal CT: automated assessment with deep learning on noncontrast and contrast-enhanced scans . Acad Radiol 2021. ; 28 ( 11 ): 1491 – 1499 . [DOI] [PMC free article] [PubMed] [Google Scholar]
- 16. Pickhardt PJ , Graffy PM , Zea R , et al . Automated CT biomarkers for opportunistic prediction of future cardiovascular events and mortality in an asymptomatic screening population: a retrospective cohort study . Lancet Digit Health 2020. ; 2 ( 4 ): e192 – e200 . [DOI] [PMC free article] [PubMed] [Google Scholar]
- 17. Sandfort V , Yan K , Pickhardt PJ , Summers RM . Data augmentation using generative adversarial networks (CycleGAN) to improve generalizability in CT segmentation tasks . Sci Rep 2019. ; 9 ( 1 ): 16884 . [DOI] [PMC free article] [PubMed] [Google Scholar]
- 18. O’Connor SD , Graffy PM , Zea R , Pickhardt PJ . Does nonenhanced CT-based quantification of abdominal aortic calcification outperform the Framingham Risk Score in predicting cardiovascular events in asymptomatic adults? Radiology 2019. ; 290 ( 1 ): 108 – 115 . [DOI] [PubMed] [Google Scholar]
- 19. Perez AA , Pickhardt PJ , Elton DC , Sandfort V , Summers RM . Fully automated CT imaging biomarkers of bone, muscle, and fat: correcting for the effect of intravenous contrast . Abdom Radiol (NY) 2021. ; 46 ( 3 ): 1229 – 1235 . [DOI] [PubMed] [Google Scholar]
- 20. Simpson AL , Antonelli M , Bakas S , et al . A large annotated medical image dataset for the development and evaluation of segmentation algorithms . arXiv preprint arXiv:1902.09063. https://arxiv.org/abs/1902.09063. Posted February 25, 2019. [Google Scholar]
- 21.Roth HR, Lu L, Farag A, et al. DeepOrgan: multi-level deep convolutional networks for automated pancreas segmentation. In: Navab N, Hornegger J, Wells W, Frangi A, eds. Medical Image Computing and Computer-Assisted Intervention – MICCAI 2015. MICCAI 2015. Lecture Notes in Computer Science,vol 9349.Cham, Switzerland: Springer,2015; 556–564. [Google Scholar]
- 22. Xu Z , Lee CP , Heinrich MP , et al . Evaluation of six registration methods for the human abdomen on clinically acquired CT . IEEE Trans Biomed Eng 2016. ; 63 ( 8 ): 1563 – 1572 . [DOI] [PMC free article] [PubMed] [Google Scholar]
- 23. Landman B , Igelsias JE , Styner M , Langerak TR , Klein A . 2015 MICCAI Multi-Atlas Labeling Beyond the Cranial Vault — Workshop and Challenge . 10.7303/syn3193805. Published February 13, 2015. Accessed March 13, 2022. . [DOI] [Google Scholar]
- 24. Pickhardt PJ , Choi JR , Hwang I , et al . Computed tomographic virtual colonoscopy to screen for colorectal neoplasia in asymptomatic adults . N Engl J Med 2003. ; 349 ( 23 ): 2191 – 2200 . [DOI] [PubMed] [Google Scholar]
- 25. Bagheri MH , Roth H , Kovacs W , et al . Technical and clinical factors affecting success rate of a deep learning method for pancreas segmentation on CT . Acad Radiol 2020. ; 27 ( 5 ): 689 – 695 . [DOI] [PubMed] [Google Scholar]
- 26. Hand DJ , Till RJ . A simple generalisation of the area under the ROC curve for multiple class classification problems . Mach Learn 2001. ; 45 ( 2 ): 171 – 186 . [Google Scholar]
- 27. Suman G , Panda A , Korfiatis P , et al . Development of a volumetric pancreas segmentation CT dataset for AI applications through trained technologists: a study during the COVID 19 containment phase . Abdom Radiol (NY) 2020. ; 45 ( 12 ): 4302 – 4310 . [DOI] [PMC free article] [PubMed] [Google Scholar]
- 28. Panda A , Korfiatis P , Suman G , et al . Two-stage deep learning model for fully automated pancreas segmentation on computed tomography: comparison with intra-reader and inter-reader reliability at full and reduced radiation dose on an external dataset . Med Phys 2021. ; 48 ( 5 ): 2468 – 2481 . [DOI] [PubMed] [Google Scholar]
- 29.Sriram SA, Paul A, Zhu Y, Sandfort V, Pickhardt PJ, Summers RM. Multilevel UNet for pancreas segmentation from non-contrast CT scans through domain adaptation. In: Hahn K, Mazurowski MA, eds. Proceedings of SPIE: medical imaging 2020—computer-aided diagnosis. Vol 11314. Bellingham, Wash: International Society for Optics and Photonics, 2020; 113140K. [Google Scholar]
- 30. Kumar H , DeSouza SV , Petrov MS . Automated pancreas segmentation from computed tomography and magnetic resonance images: A systematic review . Comput Methods Programs Biomed 2019. ; 178 : 319 – 328 . [DOI] [PubMed] [Google Scholar]


