. 2022 Apr 5;304(1):85–95. doi: 10.1148/radiol.211914

Figure 5:

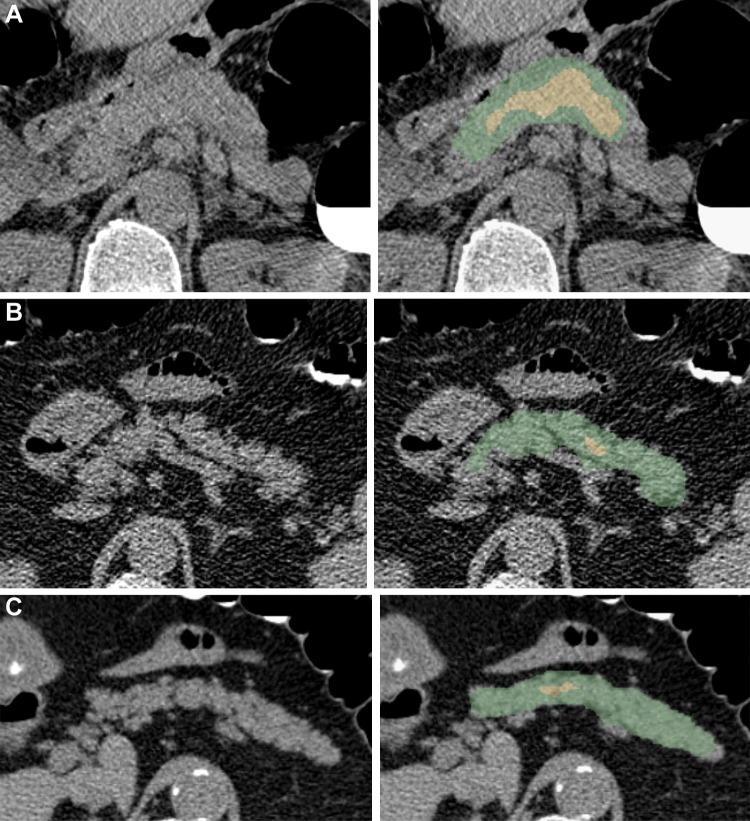
Examples of pancreas segmentations on unenhanced axial abdominal CT images in healthy participants and patients with type 2 diabetes mellitus. Images on left are original CT images, and images on right show segmentations overlaid on the original CT images. (A) Images in a nondiabetic 61-year-old man with average pancreas CT attenuation of 35.50 HU ± 47.96 and pancreatic volume of 97.6 mL. (B) Images in a 59-year-old man with type 2 diabetes who was diagnosed 144 days before CT. Average pancreas CT attenuation was 20.66 HU ± 81.99 and pancreatic volume was 77.10 mL. (C) Images in a 67-year-old man with type 2 diabetes who was diagnosed 595 days after CT. Average pancreas CT attenuation was 18.46 HU ± 48.30 and pancreatic volume was 72.88 mL. The green area indicates full segmentation and the yellow area indicates segmentation after erosion.

Examples of pancreas segmentations on unenhanced axial abdominal CT images in healthy participants and patients with type 2 diabetes mellitus. Images on left are original CT images, and images on right show segmentations overlaid on the original CT images. (A) Images in a nondiabetic 61-year-old man with average pancreas CT attenuation of 35.50 HU ± 47.96 and pancreatic volume of 97.6 mL. (B) Images in a 59-year-old man with type 2 diabetes who was diagnosed 144 days before CT. Average pancreas CT attenuation was 20.66 HU ± 81.99 and pancreatic volume was 77.10 mL. (C) Images in a 67-year-old man with type 2 diabetes who was diagnosed 595 days after CT. Average pancreas CT attenuation was 18.46 HU ± 48.30 and pancreatic volume was 72.88 mL. The green area indicates full segmentation and the yellow area indicates segmentation after erosion.