Abstract
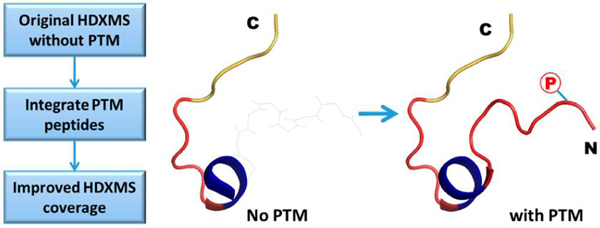
Hydrogen−deuterium exchange-mass spectrometry (HDXMS) is a powerful technology to characterize conformations and conformational dynamics of proteins and protein complexes. HDXMS has been widely used in the field of therapeutics for the development of protein drugs. Although sufficient sequence coverage is critical to the success of HDXMS, it is sometimes difficult to achieve. In this study, we developed a HDXMS data analysis strategy that includes parallel post-translational modification (PTM) scanning in HDXMS analysis. Using a membrane-delimited G protein-coupled receptor (vasopressin type 2 receptor; V2R) and a cytosolic protein (Na+/H+ exchanger regulatory factor-1; NHERF1) as examples, we demonstrate that this strategy substantially improves protein sequence coverage, especially in key structural regions likely including PTMs themselves that play important roles in protein conformational dynamics and function
Graphical Abstract

Hydrogen−deuterium exchange-mass spectrometry (HDXMS) directly measures changes in solvent accessibility and hydrogen bonding and is a powerful tool for characterizing conformations and conformational dynamics of proteins and protein complexes in solution.1–4 In recent years, advances in MS instrumentation, hydrogen−deuterium exchange (HDX) automation robotics, and informatics technologies have made HDXMS indispensable for many academic research laboratories and biopharmaceutical/biotech companies. HDXMS technology has been widely applied in protein therapeutics for the discovery and development of protein-based drugs.5–7
In an HDXMS experiment, a protein or protein complex is incubated at its physiological conditions in the buffer containing deuterium oxide (D2O). During the incubation process, exogenous deuterium (D or 2H) exchanges with hydrogen (H or 1H) in backbone amide positions at measurable rates that are affected by protein conformational changes and/or protein complex formation. Incorporation of D into a protein increases its mass. After completion of the HDX, the protein or protein complex is quickly digested by a protease (e.g., pepsin), and the resulting peptic peptides are separated by liquid chromatography (LC). A high resolution mass spectrometer is used to accurately measure changes in mass of peptides corresponding to different regions of the protein or protein complex.8–11
Sufficient protein coverage is critical to the success of HDXMS. To improve protein coverage, digestion tuning is often conducted to determine the optimal experimental conditions. Good protein coverage may be challenging to achieve due to the nature of the proteins and peptides. Some peptides, such as large or hydrophobic peptides, are difficult to ionize and analyze by MS. Further, purified proteins used in HDXMS experiments may have post-translational modifications (PTMs) that could significantly influence the protein conformations.7 However, many HDXMS experiments do not include PTM information. We hypothesized that incorporation of PTM information in HDXMS analysis will improve protein sequence coverage. Because PTMs are often located in key regions of proteins and are essential for protein functions, incorporation of PTMs could provide insight into these structurally and functionally important protein regions.
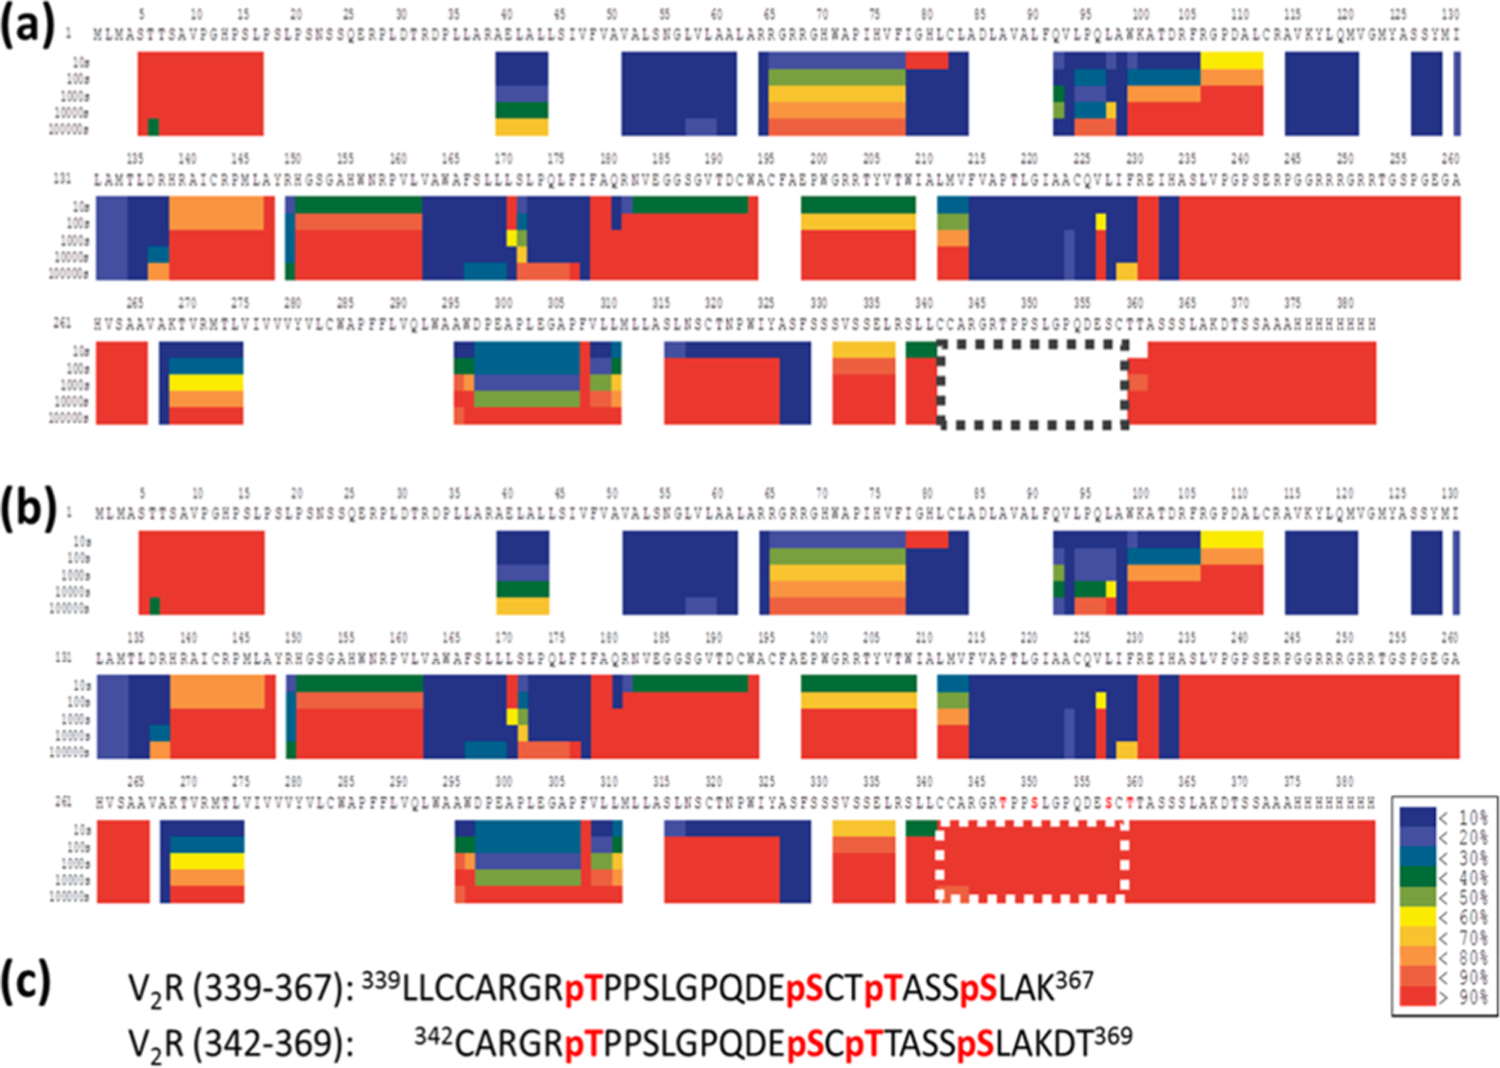
To test this hypothesis, we first used the human vasopressin type 2 receptor (V2R), a seven-transmembrane spanning, G protein-coupled receptor (GPCR), as an example. Overexpressed V2R protein was purified from Sf 9 cells as described previously.12,13 After digestion tuning to optimize experimental conditions, 75% protein sequence coverage was achieved for the purified V2R protein (Figures 1a and S1a and Supplementary Methods). However, to our surprise, no peptides were found between residues 340 and 365 in the C-tail, even though GPCR C-tails usually lack secondary structure (α-helices and β-sheets)14–16 and can theoretically freely undergo H−D exchange. We suspected the absence of protein coverage in the V2R C-tail region is due to PTMs because previous reports demonstrated that the V2R C-tail could be phosphorylated17–20 (Table S1). In addition, we performed phosphorylation search/analysis using the liquid chromatography with tandem mass spectrometry (LC/MS/MS) raw data sets collected from nondeuterated samples in HDXMS experiments. We discovered two quadruply phosphorylated peptides (Table S2 and Figure S2). When these peptic phosphopeptides (342CARGRTPPSLGPQDESCTTASSSLAKDT369 and 339LLCCARGRTPPSLGPQDESCTTASSSLAK367) were added to the peptide pool (Table S2) during HDXMS data analysis, the protein sequence coverage increased from 75% to 79%, and we gained coverage of the entire V2R C-tail (Figures 1b,c and S1b).
Figure 1.

Incorporation of PTM analysis improves V2R protein coverage of key structural regions in the HDXMS analysis. (a) Without considering PTMs, the HDXMS heat map of V2R indicated that there is no sequence coverage between residues 340 and 360 (boxed) in the C-tail. (b) After the phosphopeptides were added to the peptide pool during HDXMS analysis, the sequence coverage for residues 340−360 (boxed) was obtained. The figure here demonstrates the improved protein sequence coverage. Enlarged heat maps with a detailed description are shown in Figure S1. (c) Sequences of two peptic phosphopeptides are indicated. Phosphorylation sites are highlighted in red.
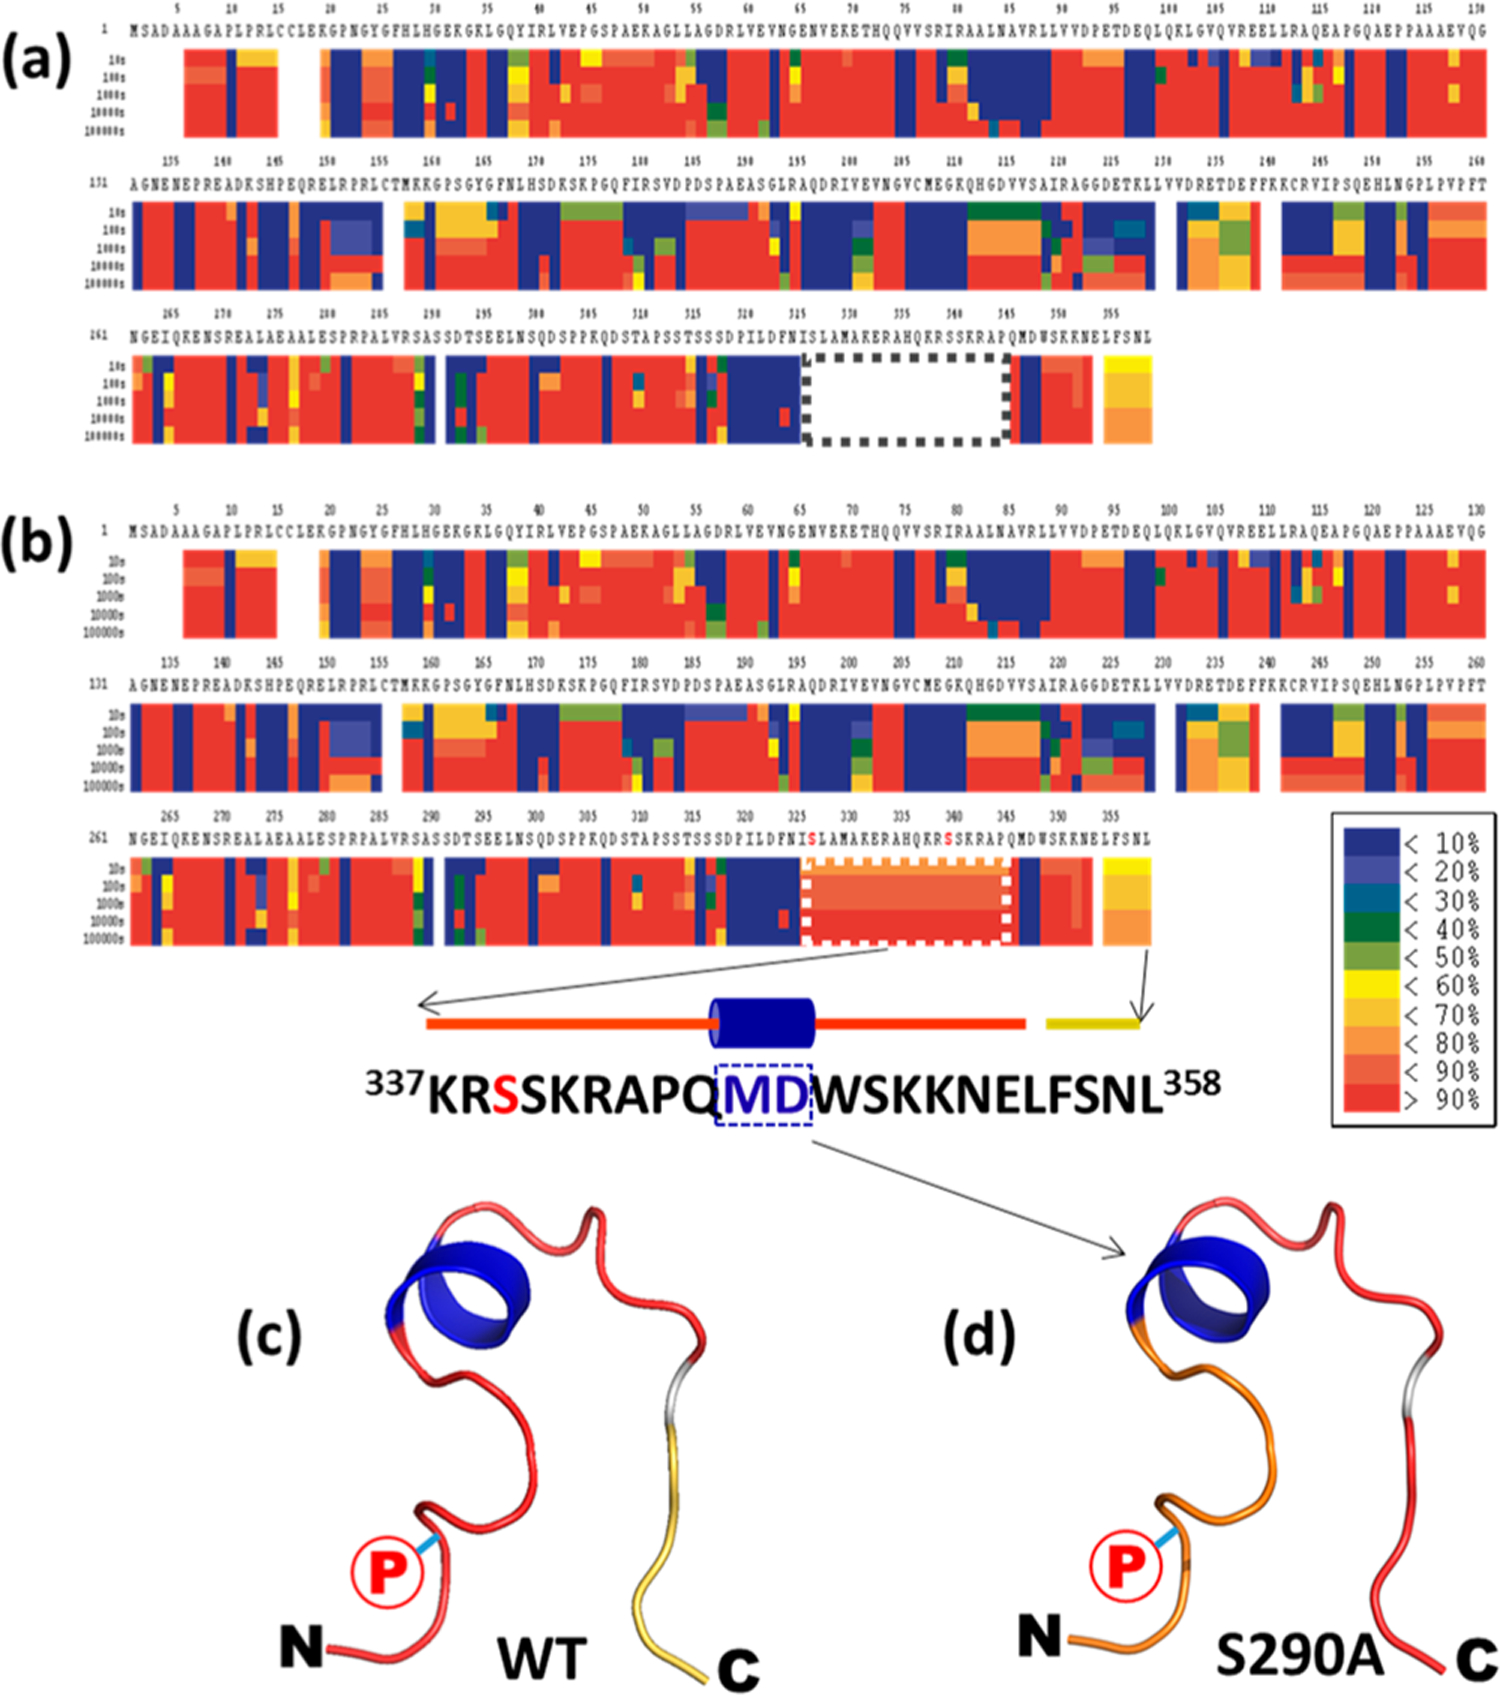
Similar issues to the V2R transmembrane protein were found during HDXMS analysis of Na+/H+ exchanger regulatory factor-1 (NHERF1), a cytosolic scaffold phosphoprotein that connects plasma membrane proteins, including receptors and transporters, with cytoskeletal proteins like actin. Regardless of phosphorylation modification, protein sequence in the distal C-terminal tail, critical for establishing the NHERF1 open/close conformational switch, was not covered. Specifically, overexpressed NHERF1 protein was purified from E. coli. After digestion tuning to optimize experimental conditions, 90% protein sequence coverage was achieved for purified NHERF1 (Figures 2a and S3a and Supplementary Methods). However, sequence coverage was lacking for several regions, including residues 325−344. We suspected that some residues in these regions are post-translationally modified, and these PTM-containing peptides were not included in the peptide pool (Table S3) used during HDXMS analysis. We conducted a literature search and found multiple PTM sites in these regions were previously reported21–26 (Table S4): S77, T95, T156, S162, S280, S290, S302, S339, and S340 are phosphorylation sites; K19 is an acetylation site; K50 and K101 are ubiquitination sites. We also performed phosphorylation search/analysis using the LC/MS/MS raw data collected from nondeuterated samples in HDXMS experiments. One doubly phosphorylated peptide containing phosphorylated pS326 and pS339 (319PILDFNISLAMAKERAHQKRSSKRA-PQM346) (Table S3 and Figure S4) was identified. When this phosphopeptide was included in the peptide pool during HDXMS analysis, the major 325−344 sequence gap of the previous analysis was recovered and protein coverage increased from 90% to 95% (Figures 2b and S3b). It is worthwhile to mention that the measured HDX rates for two residues “MD” in the NHERF1 C-tail were <10% even at 10 000 s, which agrees perfectly with our previous structural model27,28 in which these two residues are in the middle of a short α-helix composed of residues “QMDW” (Figures 2b–d and S3).
Figure 2.

Incorporation of PTMs in HDXMS data analysis improves protein coverage of NHERF1. (a) Without considering PTMs, the HDXMS heat map of NHERF1 showed no sequence coverage between residues 325 and 344 (boxed) in the C-tail. (b) After a phosphorylation-containing peptide was added to the peptide pool for HDXMS analysis, the sequence coverage for residues 325−344 (boxed) was obtained. (a) and (b) are used to demonstrate the improved protein sequence coverage. Enlarged heat maps are shown in Figure S2. (c, d) The HDX rates of the C-tail of WT and mutant S290A NHERF1 were mapped to the structural model of the C-tail of NHERF1. N- and C-termini of the C-tail are indicated. A phosphorylation site was labeled with a circled red P. Residues “MD” in the middle of the α-helix were more protected (blue) from HDX. In contrast, residues in the loop show variable D incorporation (red). The predicted structural model shown in (c) and (d) was built on the basis of the NHERF1 C-terminal 22 residues (sequences and cartoon representation were shown in (b)) using the program Leap (AMBER 9) as described previously.27,28 Shown are secondary structures in ribbon format.
The recovery of the 325−344 sequence permitted structural analysis of the NHERF1 C-tail region. In a follow-up study to compare the structural difference between WT and S290A mutant NHERF1 proteins, we found that the deuteration rate is faster in mutant S290A than in WT NHERF1, suggesting Ser290 dephosphorylation might promote the NHERF1 open conformation by releasing its C-terminal tail from PDZ2 as indicated by more deuterated C-tail in S290A than in WT NHERF1 (Figure 2c,d). This finding further led us to explore a mechanistic explanation of how Ser290 phosphorylationdependent conformation change regulates NPT2A-mediated phosphate transport.28 The results revealed extensive differential D incorporation within the unstructured linker region between PDZ2 and the ezrin-binding domain, reflecting global conformational changes. These findings increase our understanding of target protein-associated physiological activity. We also detected several ubiquitination sites during the PTM scanning of NHERF1, but we did not enroll ubiquitinated peptides because pepsin digestion of the NHERF1 protein does not yield ubiquitinated peptides with known masses.
In both cases, the phosphopeptides we identified contain more than one phosphor-group (quadruply and doubly phosphorylated peptides for V2R and NHERF1, respectively). It is possible that other forms of the same peptides with different numbers of phosphor-groups (e.g., 0, 1, 2, or 3, etc.) could also be present in the samples. After carefully checking the LC/MS/MS raw data collected in the HDXMS experiments for V2R and NHERF1, we found the phosphopeptides described above are the dominant forms and other possible versions of the phosphopeptides were not found in the MS/MS spectra. However, one should bear in mind that the presence of heterogeneous PTMs in a peptide may reveal complicated but useful structural information. For example, it is possible that different phosphorylated forms of a peptide are present in a sample at similar levels and HDX rates are obtained for all these phosphopeptides. In this scenario, any difference in HDX kinetics of different phosphopeptide isoforms reflects different impacts of different phosphorylation patterns or “barcodes” on protein structure at least in the phosphor-group bearing regions, although differences in other regions of the same protein are averaged if different isoforms of the phosphoprotein are not separated prior to HDXMS experiments.
Glycosylation is also a very common PTM, and many proteins isolated from eukaryotic cells are glycoproteins. For the V2R purified from Sf 9 cells, we perceived that sequence coverage was lacking for N-terminal residues 18−38, a region that contains an N-glycosylation consensus sequence of “Asn-X-Ser/Thr”, where X is any amino acid except proline. N22 in this consensus sequence “22NSS25” was reported to be N-glycosylated.29 Therefore, we suspected that missing coverage in this region might be due to lack of consideration for glycosylation. Since we did not know the glycan forms attached to N22, we attempted to predict the glycopeptides using GlycoMod,30 a tool to predict the possible oligosaccharide structures. Manually inspecting the LC/MS/MS raw data from the V2R nondeuterated samples and uploading masses of possible glycopeptides to GlycoMod predicted a glycopeptide “18PSLPS*NSSQE27” (Table S2 and Supplementary Methods). The region between residues 18 and 27 was recovered after this possible glycopeptide was included (Figure S5). The resulting HDX information for this recovered region might provide structural insight into ligand−V2R binding.
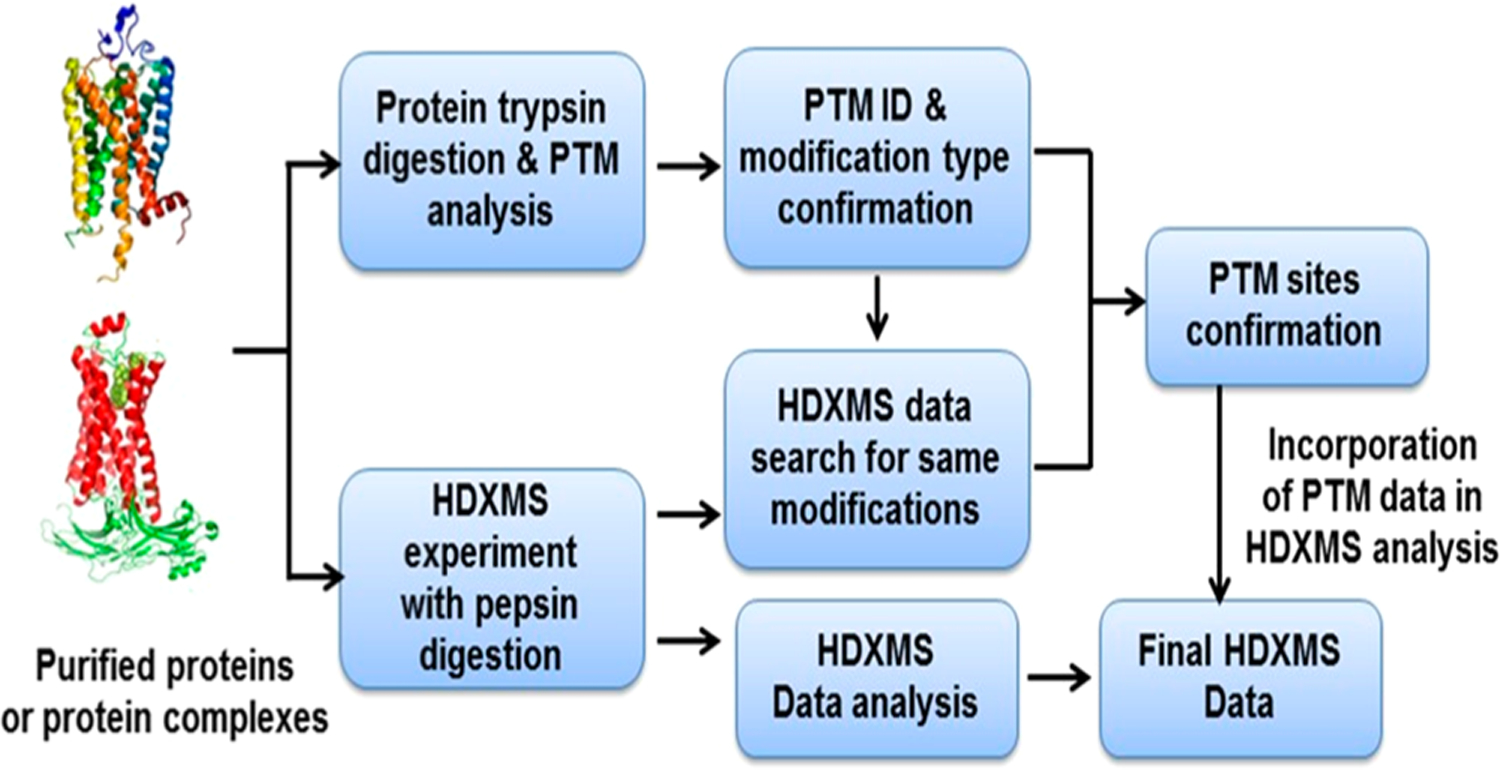
On the basis of these studies, we conclude that PTM scanning augments HDXMS analysis and improves protein sequence coverage of key structural regions in proteins. An experimental platform is thus recommended for HDXMS experiments (Figure 3). On this platform, parallel PTM scanning is incorporated into the HDXMS experiments as a routine procedure. The PTM scanning includes two steps. The first is to search for possible PTMs using available PTM databases or regular proteomic experiments, and the second step is to identify PTM-containing peptic peptides from the LC/MS/MS data collected from HDXMS experiments. Some well-curated PTM Web sites, such as PhosphoSitePlus,31 dbPTM,32 and GlycoMod, provide excellent resources for the first step in searching for possible PTMs for proteins of interest. In some cases, if there is no PTM record in the literature, one can use an aliquot of protein sample prepared for HDXMS and perform trypsin or other protease digestion followed by LC/MS/MS analysis. The collected LC/MS/MS data are subjected to database search scanning for possible PTMs, including phosphorylation, acetylation, methylation, and glycosylation (Table S5 and Supplementary Methods). It is generally not necessary to perform PTM enrichment for two reasons. First, the sensitivities of many modern mass spectrometers are capable of characterizing these PTMs from purified protein preparation. Second, PTM enrichment may possibly identify post-translationally modified peptides that are at low abundance and are not detected by HDXMS. However, for phosphorylation and glycosylation, electron transfer dissociation (ETD) can be used as a complementary alternative MS tool to preserve these liable modifications in both PTM identification and HDXMS experiments.33–37 After PTM types and sites are identified, one can proceed to the second step of PTM scanning and search for PTM-containing peptic peptides using LC/MS/MS data sets collected from nondeuterated samples. The resultant peptic peptides are manually confirmed by examining both MS1 and MS2 spectra. The confirmed PTM-containing peptic peptides are used in HDXMS data analysis. Addition of these PTM-containing peptides in the HDXMS peptide pool increases protein coverage and reveals structural information on key functional regions.
Figure 3.

Suggested HDXMS platform with parallel PTM scanning that improves protein coverage of key structural regions.
It is worth noting that recovering sequence coverage of glycan-containing regions of glycoproteins can present a challenge due to the complex nature of glycans. HDXMS analysis of N-linked glycoproteins can be performed by enzymatic deglycosylation using PNGase F prior to HDXMS since this enzyme efficiently removes most intact N-linked glycans.38 However, currently, there is no enzymatic equivalent to PNGase F for releasing intact O-linked glycans. Thus, the analysis of O-linked glycosylation is more difficult compared to N-linked glycosylation. Indeed, removing glycans may affect the conformation of a glycoprotein. To reveal structural information on native glycoprotein, it would be preferable to perform a complete glycosylation profiling to determine the glycosylation sites and the structures of glycans by LC/MS/MS.38 The information can then be included in processing of HDXMS data to identify glycopeptides and improve sequence coverage of the glycan containing regions (Figure S6a). An alternative approach to specifically improve sequence coverage of native N-linked glycoprotein is to perform deglycosylation after quenching of the HDX reaction (post-HDX) using a PNGase A at HDX quench conditions (i.e., at pH 2.5 and 0°C) (Figure S6b).39 These strategies should enhance protein sequence coverage and improve the ability to characterize the conformational properties of native glycoproteins, such as many protein-based pharmaceuticals.
Supplementary Material
ACKNOWLEDGMENTS
This work was supported, in part, by US National Institutes of Health Grant No. HL-075443 Proteomics to K.X. This publication was also made possible by seed funding support to K.X. from the Department of Pharmacology and Chemical Biology, the University of Pittsburgh and Vascular Medicine Institute, the Hemophilia Center of Western Pennsylvania, the Institute for Transfusion Medicine, and the National Institutes of Health (NIH) awards DK105811 and DK111427 to P.A.F.
Footnotes
The authors declare no competing financial interest.
REFERENCES
- (1).Harrison RA; Engen JR Curr. Opin. Struct. Biol 2016, 41, 187–193. [DOI] [PMC free article] [PubMed] [Google Scholar]
- (2).Engen JR; Wales TE Annu. Rev. Anal. Chem 2015, 8, 127–148. [DOI] [PMC free article] [PubMed] [Google Scholar]
- (3).Englander JJ; Del Mar C; Li W; Englander SW; Kim JS; Stranz DD; Hamuro Y; Woods VL Jr. Proc. Natl. Acad. Sci. U. S. A 2003, 100, 7057–7062. [DOI] [PMC free article] [PubMed] [Google Scholar]
- (4).Konermann L; Pan J; Liu YH Chem. Soc. Rev 2011, 40, 1224–1234. [DOI] [PubMed] [Google Scholar]
- (5).Wei H; Mo J; Tao L; Russell RJ; Tymiak AA; Chen G; Iacob RE; Engen JR Drug Discovery Today 2014, 19, 95–102. [DOI] [PMC free article] [PubMed] [Google Scholar]
- (6).Marciano DP; Dharmarajan V; Griffin PR Curr. Opin. Struct. Biol 2014, 28, 105–111. [DOI] [PMC free article] [PubMed] [Google Scholar]
- (7).Bobst CE; Abzalimov RR; Houde D; Kloczewiak M; Mhatre R; Berkowitz SA; Kaltashov IA Anal. Chem 2008, 80, 7473–7481. [DOI] [PMC free article] [PubMed] [Google Scholar]
- (8).Chalmers MJ; Busby SA; Pascal BD; West GM; Griffin PR Expert Rev. Proteomics 2011, 8, 43–59. [DOI] [PMC free article] [PubMed] [Google Scholar]
- (9).Burns KM; Rey M; Baker CA; Schriemer DC Mol. Cell. Proteomics 2013, 12, 539–548. [DOI] [PMC free article] [PubMed] [Google Scholar]
- (10).Kan ZY; Walters BT; Mayne L; Englander SW Proc. Natl. Acad. Sci. U. S. A 2013, 110, 16438–16443. [DOI] [PMC free article] [PubMed] [Google Scholar]
- (11).Xiao K; Zhao Y; Choi M; Liu H; Blanc A; Qian J; Cahill TJ 3rd; Li X; Xiao Y; Clark LJ; Li S Nat. Protoc 2018, 13, 1403–1428. [DOI] [PubMed] [Google Scholar]
- (12).Kumari P; Srivastava A; Ghosh E; Ranjan R; Dogra S; Yadav PN; Shukla AK Mol. Biol. Cell 2017, 28, 1003–1010. [DOI] [PMC free article] [PubMed] [Google Scholar]
- (13).Eifler N; Duckely M; Sumanovski LT; Egan TM; Oksche A; Konopka JB; Luthi A; Engel A; Werten PJ J. Struct. Biol 2007, 159, 179–193. [DOI] [PubMed] [Google Scholar]
- (14).Langen R; Cai K; Altenbach C; Khorana HG; Hubbell WL Biochemistry 1999, 38, 7918–7924. [DOI] [PubMed] [Google Scholar]
- (15).Teller DC; Okada T; Behnke CA; Palczewski K; Stenkamp RE Biochemistry 2001, 40, 7761–7772. [DOI] [PMC free article] [PubMed] [Google Scholar]
- (16).Venkatakrishnan AJ; Flock T; Prado DE; Oates ME; Gough J; Madan Babu M Curr. Opin. Struct. Biol 2014, 27, 129–137. [DOI] [PubMed] [Google Scholar]
- (17).Ren XR; Reiter E; Ahn S; Kim J; Chen W; Lefkowitz RJ Proc. Natl. Acad. Sci. U. S. A 2005, 102, 1448–1453. [DOI] [PMC free article] [PubMed] [Google Scholar]
- (18).Innamorati G; Sadeghi H; Eberle AN; Birnbaumer M J. Biol. Chem 1997, 272, 2486–2492. [DOI] [PubMed] [Google Scholar]
- (19).Innamorati G; Sadeghi HM; Tran NT; Birnbaumer M Proc. Natl. Acad. Sci. U. S. A 1998, 95, 2222–2226. [DOI] [PMC free article] [PubMed] [Google Scholar]
- (20).Xiao K; Shenoy SK; Nobles K; Lefkowitz RJ J. Biol. Chem 2004, 279, 55744–55753. [DOI] [PubMed] [Google Scholar]
- (21).Weinman EJ; Steplock D; Zhang Y; Biswas R; Bloch RJ; Shenolikar S J. Biol. Chem 2010, 285, 25134–25138. [DOI] [PMC free article] [PubMed] [Google Scholar]
- (22).Song GJ; Leslie KL; Barrick S; Mamonova T; Fitzpatrick JM; Drombosky KW; Peyser N; Wang B; Pellegrini M; Bauer PM; Friedman PA; Mierke DF; Bisello A J. Biol. Chem 2015, 290, 2879–2887. [DOI] [PMC free article] [PubMed] [Google Scholar]
- (23).Raghuram V; Hormuth H; Foskett JK Proc. Natl. Acad. Sci. U. S. A 2003, 100, 9620–9625. [DOI] [PMC free article] [PubMed] [Google Scholar]
- (24).He J; Lau AG; Yaffe MB; Hall RA J. Biol. Chem 2001, 276, 41559–41565. [DOI] [PubMed] [Google Scholar]
- (25).Hall RA; Spurney RF; Premont RT; Rahman N; Blitzer JT; Pitcher JA; Lefkowitz RJ J. Biol. Chem 1999, 274, 24328–24334. [DOI] [PubMed] [Google Scholar]
- (26).Li J; Poulikakos PI; Dai Z; Testa JR; Callaway DJ; Bu Z J. Biol. Chem 2007, 282, 27086–27099. [DOI] [PubMed] [Google Scholar]
- (27).Mamonova T; Zhang Q; Khajeh JA; Bu Z; Bisello A; Friedman PA PLoS One 2015, 10, No. e0129554. [DOI] [PMC free article] [PubMed] [Google Scholar]
- (28).Zhang Q; Xiao K; Paredes JM; Mamonova T; Sneddon WB; Liu H; Wang D; Li S; McGarvey JC; Uehling D; Al-Awar R; Joseph B; Jean-Alphonse F; Orte A; Friedman PA J. Biol. Chem 2019, 294, 4546–4571. [DOI] [PMC free article] [PubMed] [Google Scholar]
- (29).Innamorati G; Sadeghi H; Birnbaumer M Molecular pharmacology 1996, 50, 467–473. [PubMed] [Google Scholar]
- (30).Cooper CA; Gasteiger E; Packer NH Proteomics 2001, 1, 340–349. [DOI] [PubMed] [Google Scholar]
- (31).Hornbeck PV; Zhang B; Murray B; Kornhauser JM; Latham V; Skrzypek E Nucleic Acids Res 2015, 43, D512–520. [DOI] [PMC free article] [PubMed] [Google Scholar]
- (32).Huang KY; Su MG; Kao HJ; Hsieh YC; Jhong JH; Cheng KH; Huang HD; Lee TY Nucleic Acids Res 2016, 44, D435–446. [DOI] [PMC free article] [PubMed] [Google Scholar]
- (33).Trabjerg E; Kartberg F; Christensen S; Rand KD J. Biol. Chem 2017, 292, 16665–16676. [DOI] [PMC free article] [PubMed] [Google Scholar]
- (34).Guttman M; Lee KK Methods Enzymol 2016, 566, 405–426. [DOI] [PMC free article] [PubMed] [Google Scholar]
- (35).Boersema PJ; Mohammed S; Heck AJ J. Mass Spectrom 2009, 44, 861–878. [DOI] [PubMed] [Google Scholar]
- (36).Mikesh LM; Ueberheide B; Chi A; Coon JJ; Syka JE; Shabanowitz J; Hunt DF Biochim. Biophys. Acta, Proteins Proteomics 2006, 1764, 1811–1822. [DOI] [PMC free article] [PubMed] [Google Scholar]
- (37).Coon JJ Anal. Chem 2009, 81, 3208–3215. [DOI] [PMC free article] [PubMed] [Google Scholar]
- (38).Morelle W; Michalski JC Nat. Protoc 2007, 2, 1585–1602. [DOI] [PubMed] [Google Scholar]
- (39).Jensen PF; Comamala G; Trelle MB; Madsen JB; Jorgensen TJ; Rand KD Anal. Chem 2016, 88, 12479–12488. [DOI] [PubMed] [Google Scholar]
Associated Data
This section collects any data citations, data availability statements, or supplementary materials included in this article.


