

Abstract
Ribonucleoprotein (RNP) granules are biomolecular condensates—liquid–liquid phase-separated droplets that organize and manage messenger RNA metabolism, cell signaling, biopolymer assembly, biochemical reactions and stress granule responses to cellular adversity. Dysregulated RNP granules drive neuromuscular degenerative disease but have not previously been linked to heart failure. By exploring the molecular basis of congenital dilated cardiomyopathy (DCM) in genome-edited pigs homozygous for an RBM20 allele encoding the pathogenic R636S variant of human RNA-binding motif protein-20 (RBM20), we discovered that RNP granules accumulated abnormally in the sarcoplasm, and we confirmed this finding in myocardium and reprogrammed cardiomyocytes from patients with DCM carrying the R636S allele. Dysregulated sarcoplasmic RBM20 RNP granules displayed liquid-like material properties, docked at precisely spaced intervals along cytoskeletal elements, promoted phase partitioning of cardiac biomolecules and fused with stress granules. Our results link dysregulated RNP granules to myocardial cellular pathobiology and heart failure in gene-edited pigs and patients with DCM caused by RBM20 mutation.
We chose the highly pathogenic R636S allele of RBM20 (ref. 1), encoding a striated muscle-specific nuclear alternative splicing factor2, for dilated cardiomyopathy (DCM)/heart failure modeling by precision germline genome editing in pigs. A decade ago, we linked clinically aggressive inherited DCM to DNA sequence variants in RBM20 (ref. 1). Now, bolstered by almost 40 primary publications (reviewed in ref. 3), the National Center for Biotechnology Information ClinVar database lists 44 pathogenic or likely pathogenic human genomic DNA sequence variants affecting RBM20, with an additional 314 variants in need of functional validation (www.ncbi.nlm.nih.gov/clinvar/). Conservatively, ~3,500 individuals are affected by DCM caused by RBM20 sequence variants in the United States, with many more worldwide1. The majority of pathogenic variants cluster within a mutational hotspot at the 5′ end of exon 9 encoding the RSRSP dual-serine phospho-nuclear localization signal1,3–5. RNA-binding motif protein-20 (RBM20) normally represses developmental stage-specific alternative splicing of titin (TTN), calcium/calmodulin-dependent protein kinase ΙΙδ (CAMK2D) and other DCM-related genes6. RBM20 loss-of-function alleles disable developmental splice isoform switching but are inconsistently linked to DCM in rodents3,6,7. RBM20 localizes to transcriptionally active TTN loci spanning >300 kilobases on human chromosome 2, building prominent splicing speckles2, trans-interacting chromatin domains that recruit multiple unlinked target genes (including CAMK2D), factories for coordinated transcription and RBM20-regulated alternative splicing8. Supported by a decade of study, defective alternative splicing remains the mechanistic model for DCM caused by RBM20 mutation3,9,10. Yet, beyond nuclear splicing, RNA-binding proteins (RBPs) can assemble through low-complexity domain/intrinsically disordered region (LCD–IDR) interactions into ribonucleoprotein (RNP) granules11,12. RNP granules govern messenger RNA (mRNA) metabolism and homeostasis13,14, organize cellular biochemistry and signal transduction15, and pathologically aggregate into amyloids or fibrils in neuromuscular degenerative disease14. In skeletal muscle, reversible phase transition of TAR DNA-binding protein 43 (TDP-43 (also known as TARDBP); an RBM20-related RBP) from liquid myo-granules into fibrils regulates sarcomere biogenesis16,17. Stress granules tightly control mRNA function, silencing the translation of transcripts superfluous to cell survival18. RBPs mislocalizing to the cytoplasm19,20 build stress granules that escape normal regulatory control21,22. Stress granules enforce a translational stranglehold that arrests cell proliferation, minimizes energy consumption and halts all specialized (non-essential) cellular functions13,18—an unfavorable circumstance for the ceaselessly beating cardiomyocyte. Stress granules also specifically enrich LCD–IDR-containing cell cycle regulators23 and assemble within the mitochondrial matrix24. Here, seeking to explain unexpectedly severe DCM/heart failure observed in pigs homozygous (HMZ) for human RBM20R636S, we introduce the radical new concept that, beyond splicing, DCM caused by RBM20 mutation is an RNP granule disease.
Results
Clinicopathobiological correlates in RBM20R636S pigs.
We engineered R636S into the pig germline (Fig. 1a,b and Extended Data Fig. 1a). Automated immunohistochemistry (IHC) demonstrated differential myocardial RBM20 staining across all three genotypes (Fig. 1c). Wild-type (WT) myocardium displayed signature nuclear RBM20 splicing speckles, heterozygous (HTZ) myocardium displayed splicing speckles plus sarcoplasmic signal and HMZ myocardium displayed sarcoplasmic signal exclusively (Fig. 1c). Immunofluorescence microscopy of the RBM20R636S signal revealed discrete puncta flooding cardiomyocyte sarcoplasm (Fig. 1d). Quantitatively, the HMZ immunofluorescence signal exceeded the WT signal by more than tenfold (Fig. 1d, graph). Thus, vacating splicing speckles, RBM20R636S accumulated in sarcoplasmic granules at very high levels.
Fig. 1 |. Sarcoplasmic RBM20 misaccumulation, contractile dysfunction and molecular pathobiology in humanized RBM20 gene-edited pigs at postnatal day 7.

a, Schematic showing how germline HTZ pigs were generated for crossbreeding via RBM20 editing by TALENs (transcription activator-like effector nucleases) in WT pig fibroblasts and somatic cell nuclear and embryo transfer into surrogate sows (see expanded schematic in Extended Data Fig. 1a). SCNT, somatic cell nuclear transfer. b, RBM20 exon 9 TALENs HDR (homology-directed repair) editing strategy. Top: the HDR template contains: an R-to-S amino acid substitution (green cg to red TC); 3′ silent mismatches (ag to TC) to prevent 3′ (right) TALEN binding after HDR; and a 5′ silent mutation (c to A) that creates a BglII restriction site for genotyping. Bottom: DNA sequence traces of successfully edited RBM20 alleles in HTZ and HMZ pig genomes (left) and PCR gel analyses of the BglII RFLP, comparing WT, HTZ and HMZ pig genomic DNA (right). Arrowheads point to mutations. c, RBM20 IHC, counterstained with hematoxylin, comparing the subcellular localization of WT and R636S proteins in the left ventricular myocardium of WT, HTZ and HMZ 7-d-old piglets. The staining is representative of three pigs of each genotype for combined data of 7- and 16-week-old pigs. Scale bar, μm. d, Left: RBM20 fluorescence IHC (F-IHC) comparing the subcellular localization of WT and R636S proteins in WT, HTZ and HMZ pig left ventricular myocardium, as in c, at low (top panels) and high magnification (bottom panels). Scale bars, μm. Right: quantitation of the RBM20 relative signal area for multiple independent random fields per slide. The P values were calculated by two-sided Student’s t-test (n is the number of fields evaluated per genotype). e, The progeny of Mendelian (HTZ × HTZ) gene-edited pig crosses, which by chance contained only one WT piglet per litter, were studied to correlate genotype (color coded) with cardiac function phenotype, as assessed by LVEF on the day of birth. f, Left: short-axis 2D echocardiography at the mid-ventricular level comparing 21-d-old WT and HMZ littermates. BNP and ANP values are in pg/ml; upward arrows indicate highly elevated. LV, left ventricle; RV, right ventricle. Right: summary box plot collating LVEF data at birth from all WT, HTZ and HMZ progeny from litters 1 and 2, as shown in e. The P value was calculated by two-sided Student’s t-test (n is the number of piglets per genotype). Scale bar, cm. g, Gross anatomy comparing 21-d-old WT and HMZ hearts (top panels) and slice anatomy at the mid-ventricular level comparing 7-d-old WT and HMZ pigs (bottom panels). The blue lines at the bottom represent a 1-cm-spaced ruler; scale bars, cm. h, TEM images comparing the sarcomere structure in WT and HMZ left ventricular myocardium at day 7. The images are representative of two WT and three HMZ pigs (see quantitative analysis in Extended Data Fig. 2d). Scale bar, μm. i, Top: hematoxylin and eosin histochemical staining (top panels) and pH3 F-IHC (bottom panels) comparing the mitotic figure frequency in WT and HMZ pig left ventricular myocardium at postnatal day 7 (see insets for higher magnification). Similar results were observed in two WT and three HMZ piglets (see Extended Data Fig. 3a for an expanded analysis). Bottom: western blot analysis for total H3 and pH3 from left ventricular myocardial tissue, comparing WT, HTZ and HMZ piglets at day 7 (left) and quantitation of pH3 signal densitometry (right). Densitometry results for WT and HTZ piglets were combined and compared with those for HMZ piglets. Scale bars, μm. j, RNA-seq heat maps comparing left ventricular myocardial transcriptomes of HMZ, HTZ and WT pigs on postnatal day 7. Each lane shows the results for an individual piglet. The genes upregulated in HMZ versus HTZ + WT combined are shown in the top gene list, whereas genes downregulated in HMZ versus HTZ + WT combined are shown in the bottom gene list. In the top gene list, the NPPA and NPPB gene names are highlighted in red because their upregulation at the protein level is validated in k. In the bottom gene list, CCNB1 and CDK1 are highlighted in blue because their downregulation is consistent with the decreased pH3 signal in i. RNA-seq gene enrichment P values were calculated by Fisher’s exact test using DAVID Functional Annotation Analysis (see Methods for details). k, Circulating BNP and ANP in plasma from WT, HTZ and HMZ pigs on postnatal day 7. In d, f, i and k, the box and whisker plots report median values (horizontal lines), first and third quartiles (bottom and top box edges, respectively) and ranges (whiskers).
Some piglets displayed profound lethargy with labored, rapid, shallow breathing and frequent coughing—physical signs and symptoms of low cardiac output and pulmonary congestion. Echocardiography segregated piglets into reduced (<60%) and normal (>60%) left ventricular ejection fractions (LVEFs) (Fig. 1e). Representative postnatal day 2 short-axis echo images are presented in Fig. 1f and Supplementary Videos 1 and 2, with the WT LVEF ~65% and the HMZ LVEF ~10–15%. Without exception, PCR-restriction fragment length polymorphism (RFLP)/DNA sequence analysis (Fig. 1b and Extended Data Fig. 1a) identified all piglets with reduced LVEF as HMZ (Fig. 1e). Analogous to humans (carriers), HTZ piglets could not be distinguished from WT piglets by echo (Fig. 1e). HMZ hearts showed four-chamber dilation with biventricular systolic contractile dysfunction and severe mitral and tricuspid valve regurgitation (Supplementary Videos 1–4). In aggregate, the HMZ LVEF averaged ~35% (Fig. 1f, graph). As expected, cardiogenic shock in HMZ piglets presaged a poor outcome. In contrast, healthy-appearing HMZ piglets born with only modest contractile dysfunction (LVEF = ~50–55%) could precipitously and fatally deteriorate (Supplementary Videos 5–8). Exceptionally, some HMZ piglets, which were outwardly indistinguishable from their WT or HTZ littermates, thrived throughout postnatal development, surviving as juveniles. We further confirmed and quantified contractile dysfunction by magnetic resonance imaging (MRI) (Extended Data Fig. 1b,c). Thus, by clinical assessment, echo and cardiac MRI, HMZ piglets displayed severe congenital DCM with advanced congestive heart failure and high mortality.
Matching their clinical profile, by gross pathology, severely affected HMZ piglets demonstrated translucently thin myocardial walls that were soft, flimsy and fragile and distinctive from the healthy and firmly muscular, valentine-shaped WT and HTZ hearts at day 21 (Fig. 1g, top panels), as corroborated by comparison of WT versus HMZ whole-organ slices at day 7 (Fig. 1g, bottom panels). Retrospectively, after genotyping, all neonatal HMZ piglets demonstrated a moderate-to-severe DCM phenotype by echocardiography, as confirmed at necropsy. HMZ hearts demonstrated four-chamber enlargement but—except for left ventricular endocardial fibroelastosis (a common finding in congenital DCM)—no interstitial fibrosis (Extended Data Fig. 2a,b). HMZ myocardium featured pallor (without evidence of systemic anemia or coronary obstruction), evident as weak hematoxylin and eosin and Masson’s trichrome histological staining (with quantitative estimates of total protein mass of ~250 μg mm−3 for WT piglets versus ~200 μg mm−3 for HMZ piglets based on volumetric analysis of total protein hydrolyzed from myocardial slides), allowing accurate segregation of the genotype by simple visualization of stained slides. Transmission electron microscopy (TEM) demonstrated lower-density, poorly organized myofibrils with poorly defined striations in HMZ myocardium (Fig. 1h and Extended Data Fig. 2c), with shortened Z-to-Z intervals (Fig. 1h and Extended Data Fig. 2c (graph)). Returning to day 7 hematoxylin and eosin stains, HMZ demonstrated fewer mitotic figures (Fig. 1i (top panels) and Extended Data Fig. 3a), as confirmed by phosphorylated histone H3 (pH3) IHC (Fig. 1i (bottom panels) and Extended Data Fig. 3a) and quantitated tissue wide by pH3 western blot (Fig. 1i, protein blot and graph). Thus, compared with WT and HTZ pig myocardium, HMZ pig myocardium at postnatal day 7 demonstrated extremely poor growth and differentiation, a state of global myocardial insufficiency or hypoplasia, clearly driving their critical clinical condition.
Next, we performed transcriptional profiling by RNA sequencing (RNA-seq), comparing myocardial gene expression signatures of day 7 WT, HTZ and HMZ littermates. Notably, we observed minimal distinction (only 15 genes dysregulated and only five of these annotated) between HTZ and WT at day 7 (Fig. 1j), matching clinical, echo and serological data (Fig. 1e,f (graph) and Fig. 1k). In contrast, HMZ uniquely dysregulated 1,213 myocardial transcripts (872 annotated; 473 upregulated and 399 downregulated) (Fig. 1j). Upregulated genes comprised cardiac pathology Gene Ontology groups (Fig. 1j). Topping this Gene Ontology list, HMZ-exclusive endocardial fibroelastosis generated the cardiac fibrosis term, as confirmed by gross pathology (Extended Data Fig. 2a) and Masson’s trichrome and Verhoeff–Van Gieson’s staining (Extended Data Fig. 2b). Additional cardiac pathology Gene Ontology terms included decreased ventricular muscle contractility, cardiac hypertrophy, abnormal myocardial fiber morphology, increased heart weight, abnormal intercalated disc morphology, dilated left ventricle and DCM (Fig. 1j). Simultaneously validating the RNA-seq data and clinical assessment of day 7 HMZ myocardium, we matched uniquely elevated NPPB and NPPA transcript levels (Fig. 1j) to elevated circulating plasma B-type natriuretic peptide (BNP) (also known as natriuretic peptide precursor B (NPPB)) and atrial natriuretic peptide (ANP) (also known as natriuretic peptide precursor A (NPPA)), respectively (Fig. 1k). Overall, the enrichment analysis of upregulated genes accurately identified broad terms of cardiac pathology matching our clinical, echo, MRI, gross anatomical, histological and serological biomarker data. For genes uniquely downregulated in day 7 HMZ myocardium, we observed very strong enrichment of cell cycle-related transcripts (Fig. 1j), providing transcriptome-level confirmation of histological data and pH3 IHC and biochemistry (Fig. 1i). Confirming the histology, a TEM survey (presented in ascending order of magnification from 2,500–50,000×) identified numerous abnormalities in day 7 myocardium unique to HMZ myocardium, including lightly packed, disorganized and fragmented myofibrils, morphologically abnormal mitochondria and notably abundant sarcoplasmic vacant space, especially around and between nuclei (Extended Data Fig. 3b). The complex organ-level, tissue, cellular and molecular phenotype of HMZ myocardium at day 7 featured prematurely growth-arrested and poorly differentiated myocardium and a strong cell cycle phenotype, coupled with major abnormalities of sarcomere and mitochondrial biogenesis.
The natural history for 125 pigs (43 WT, 63 HTZ and 19 HMZ), presented in Kaplan–Meier format (Fig. 2a), demonstrated precipitously high early mortality in HMZ pigs, corresponding to the critical neonatal transition. HMZ juveniles demonstrated massive cardiomegaly, with the heart weight averaging around twice that of WT pigs, peaking at ~300 g with correspondingly elevated heart weight-to-body weight ratios (Extended Data Fig. 4a). Juvenile HMZ hearts demonstrated severe left ventricular hypertrophy with the wall thickness averaging around twice that of WT hearts and peaking at ~16 mm (Extended Data Fig. 4a). Highlighting massive cardiomegaly, Fig. 2b compares WT and HMZ juvenile gross anatomical whole-heart slices. At necropsy, all HMZ pigs surviving to 16 weeks or beyond demonstrated massive cardiomegaly, with a median heart weight of ~300 versus ~200 g in HMZ versus WT pigs, respectively (see Extended Data Fig. 4a). Matching their clinically compensated DCM/heart failure state, LVEF by cardiac MRI in HMZ survivors progressively normalized over 16 weeks (Fig. 2c, Extended Data Fig. 1c and Supplementary Videos 9–11), as further confirmed serologically by normalized plasma BNP (Fig. 2d). Hematoxylin and eosin and Masson’s trichrome histochemistry once again confirmed relatively weak staining in HMZ myocardium. This was evident in longitudinal and transverse hematoxylin and eosin-stained sections (Fig. 2e, left and central panels, respectively). At 16 weeks, HMZ myocardium demonstrated pathological cardiomyocyte hypertrophy with mild cellular disarray and interstitial fibrosis (Fig. 2e, bottom left panel) but no gadolinium enhancement by cardiac MRI (data not shown). Despite pathological hypertrophy, the juvenile HMZ heart in Fig. 2e (bottom panels) had normal LVEF (~66% by cardiac MRI on day 134 of life). Consistent with cell cycle abnormalities observed in day 7 HMZ hearts (Fig. 1i,j), juvenile HMZ hearts demonstrated abnormal polyploidy with giant nuclei containing more than diploid numbers of chromosomes, as confirmed by X chromosome-specific fluorescence in situ hybridization (FISH) (Extended Data Fig. 4b) and highlighted by hematoxylin and eosin nuclear morphology in a day 1, day 7 and week 16 developmental series (Extended Data Fig. 4c). Juxtaposed against WT nuclear RBM20 splicing speckles, juvenile HMZ hearts demonstrated sarcoplasmic RBM20R636S granules localized to Z-discs by immunofluorescence IHC (Fig. 2e, right-hand panels). By left ventricle myocardial RNA-seq gene expression profiling, HMZ hearts demonstrated a unique signature with 178 transcripts upregulated and 119 transcripts downregulated (Fig. 2f). Distinct from the cardiac pathology Gene Ontology terms identified in the day 7 HMZ transcriptome (Fig. 1j), we failed to identify any meaningful Gene Ontology terms in upregulated myocardial transcripts in HMZ juveniles (Fig. 2f). Nonetheless, juvenile HMZ hearts upregulated four-and-a-half LIM domains 1 mRNA (Fig. 2f, heat map)—a result validated by protein blot, consistent with the hypertrophic myocardial phenotype (Fig. 2f). Turning to transcripts downregulated in HMZ juvenile myocardium, RNA-seq identified the mitochondrial DNA-encoded electron transport chain Gene Ontology cluster (Fig. 2f, names in blue), pointing towards mitochondrial pathobiology. Splicing analysis also identified gene dose-dependent alternative splicing of mitofilin (IMMT) (Fig. 2g, heat map), and mitochondrial ultrastructure by TEM demonstrated markedly abnormal cristae topology (Extended Data Fig. 4d). RNA-seq also demonstrated decreased myosin heavy chain 6 transcript levels at 16 weeks (Fig. 2f), as confirmed by protein blot (Fig. 2f, blot). Finally, we validated these RNA-seq data by confirming TTN alternative splicing, the gold standard for demonstrating RBM20 loss-of-splice effector (repressor) function (Fig. 2g (heat map) and Fig. 2h (percent spliced in ((PSI) plot)), as further validated by sodium dodecyl sulfate-vertical agarose gel electrophoresis in triplicate HMZ juveniles (Fig. 2h, protein gels). Likewise, we confirmed juvenile HMZ-specific alternative splicing of CAMK2D (Fig. 2g (heat map) and Fig. 2i (PSI plot)) by PCR with reverse transcription analysis (Fig. 2i, gel image and map). These results confirm complex tissue, cellular and molecular phenotypes, despite systolic functional and clinical compensation, in RBM20R636S HMZ pigs that survive as juveniles.
Fig. 2 |. Neonatal mortality, cardiomegaly, sarcoplasmic RBM20 misaccumulation and molecular pathobiology in humanized RBM20 gene-edited pigs at 16 weeks of age.
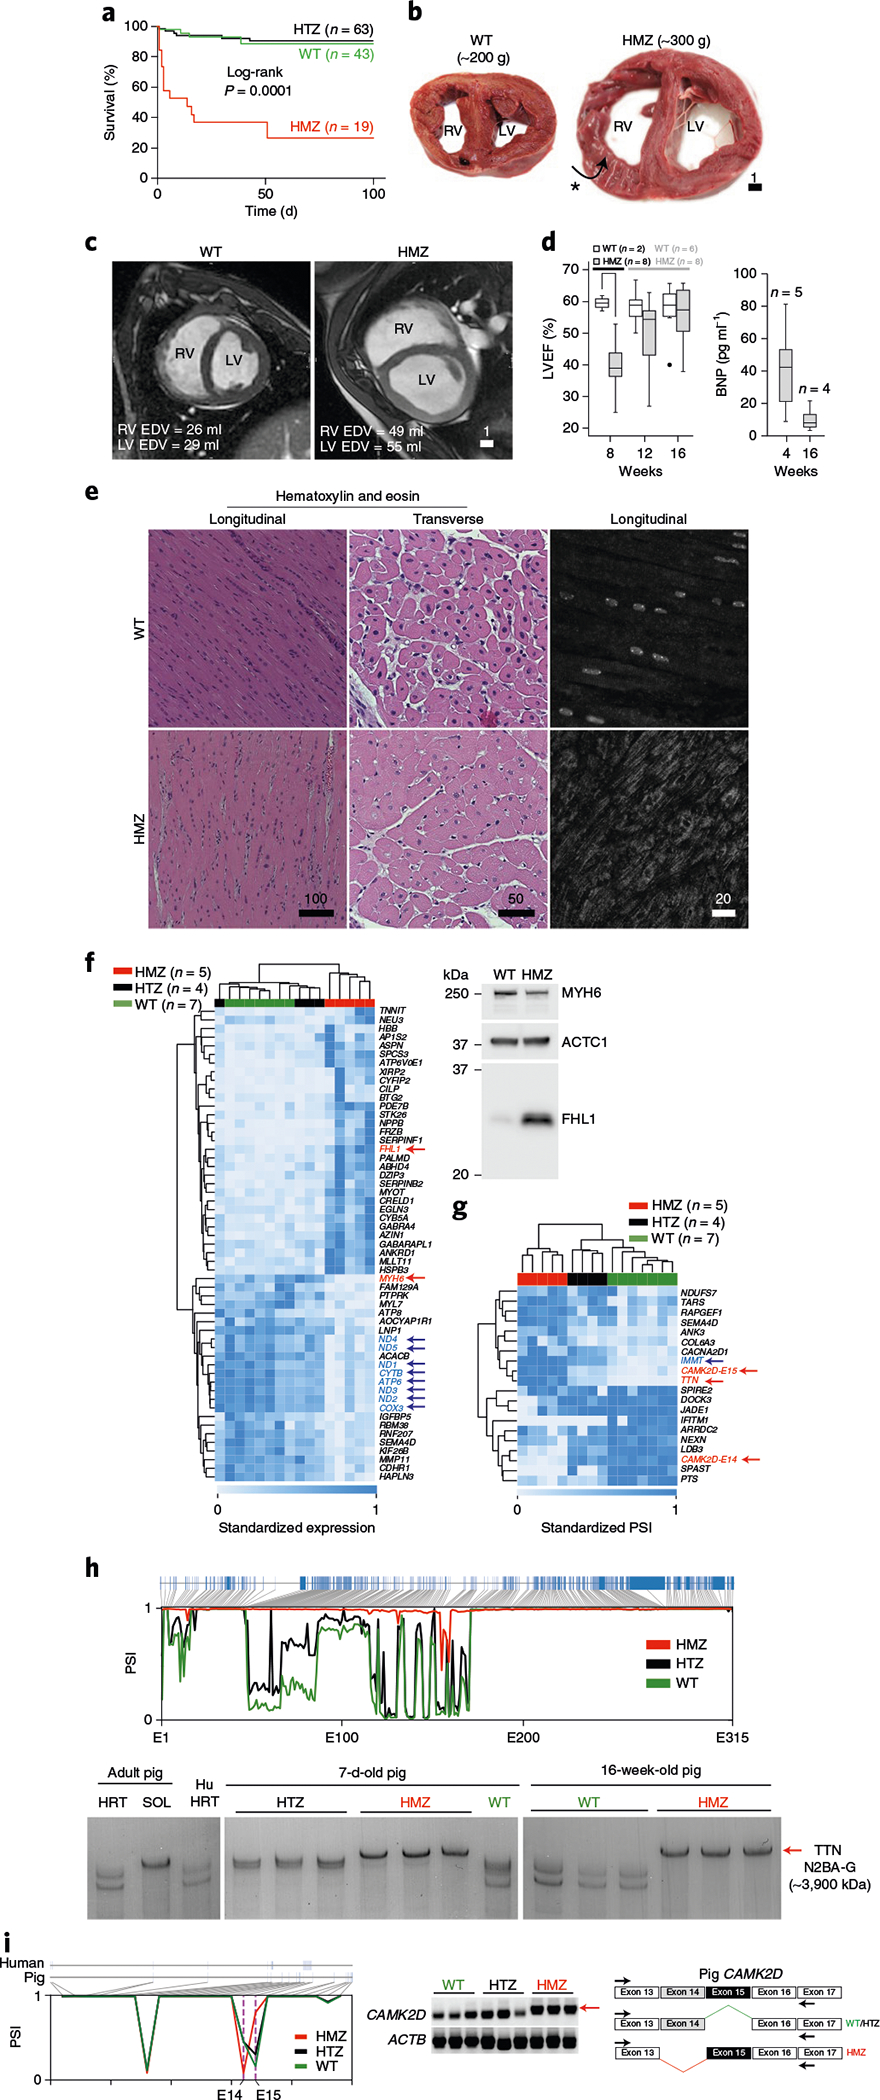
a, Kaplan–Meier survival curves comparing WT (green), HTZ (black) and HMZ pigs (red). Statistical significance was determined by log-rank (Mantel–Cox) test with two degrees of freedom (P = 0.0001) (n is the number of individual littermates of each genotype). b, Myocardial slice anatomy at the mid-ventricular level comparing WT (left) and HMZ pigs (right) at 16 weeks of age. Note that the HMZ right ventricle free wall is folded over, exposing endocardium (asterisk and arrow). Scale bar, cm. c, Cardiac MRI short-axis end-diastolic views at mid-ventricular levels comparing a WT pig (left) and HMZ pig (right) at 16 weeks of age. EDV, end-diastolic volume. Scale bar, cm. d, Left: LVEF assessed by cardiac MRI volumetric analysis (see Extended Data Fig. 1b for additional details), comparing WT and HMZ pigs at 8, 12 and 16 weeks of age (see Extended Data Fig. 1c for statistical analysis). The dot shows a single outlier at 16 weeks. Right: plasma BNP levels in HMZ pigs at 4 and 16 weeks. For both graphs, n is the number of individual littermates studied and the box and whisker plots report median values (horizontal lines), first and third quartiles (bottom and top box edges, respectively) and ranges (whiskers). e, Hematoxylin and eosin histochemical analysis in longitudinal (left) and transverse orientation (middle), coupled with RBM20 F-IHC (right; in longitudinal orientation), comparing WT and HMZ left ventricular myocardium at 16 weeks of age. The data are representative of three 16-week-old pigs of each genotype. Scale bar, μm. f, Left: RNA-seq heat map comparing WT (green), HTZ (black) and HMZ (red) left ventricle myocardial gene expression signatures at 16 weeks of age. Each column represents an individual animal. Mitochondrial transcriptome gene names, which are coordinately downregulated in HMZ, are highlighted in blue with arrows. Right: western blot analysis of four-and-a-half LIM domains 1 (FHL1) and myosin heavy chain 6 (MYH6) (these gene names are highlighted in red with arrows on the heat map) versus ACTC1 (a loading control) in WT and HMZ pig left ventricular myocardium at 16 weeks. The western blot data are representative of three animals of each genotype. n is the number of animals of each genotype studied. g, Heat map of an RNA-seq PSI analysis comparing WT (green), HTZ (black) and HMZ (red) left ventricle myocardial alternative splicing signatures at 16 weeks. Each column represents an individual animal. Alternatively spliced genes of interest are highlighted in color and with arrows (see text). n is the number of animals of each genotype studied. h, Top: RNA-seq PSI alternative splicing map for TTN comparing WT (green), HTZ (black) and HMZ (red) left ventricular myocardium at 16 weeks. The x axis depicts TTN exons 1–315 (E1–315; blue boxes at the top of the graph). Bottom: corresponding sodium dodecyl sulfate-vertical agarose gel electrophoresis analysis for TTN comparing pig myocardium from 7-d-old (middle) and 16-week-old WT, HTZ and HMZ pigs (right) with adult pig heart (HRT) and soleus slow-twitch muscle (SOL) and human heart (Hu HRT) (left). Each lane shows the results for left ventricular myocardial extract from an individual animal. The position of N2BA-G—the largest (least spliced) TTN polypeptide—is indicated by a red arrow on the right. i, Left: RNA-seq PSI alternatively spliced exon map for CAMK2D comparing WT (green), HTZ (black) and HMZ (red) pig left ventricular myocardium at 16 weeks of age. Ticks along the x axis provide approximate coordinates corresponding to the precise exon map for pig and human genomic DNA shown above; exon 14 (E14) and 15 (E15) are highlighted on this map (purple dashed lines indicate positions of genotype-specific alternatively spliced exons 14 and 15). Middle: corresponding PCR with reverse transcription DNA gel confirming differentially spliced CAMK2D gene products. Each lane used left ventricular myocardial RNA from an individual animal. The red arrow indicates the HMZ-specific CAMK2D splice product. Right: exon map of pig myocardial cDNA encoding CAMK2D demonstrating genotype-specific alternative splicing of exons 14 and 15 in HMZ (red) or WT (green) and HTZ (black) pigs, respectively. Black arrows are positions of primers used for the RT-PCR shown in the middle panel.
Human relevance of RBM20R636S granules.
Returning to archival myocardial biopsies (Mayo Clinic DCM Genetics Identifier C621; family DC-27; see ref. 1) and patient-derived induced pluripotent stem cell-derived cardiomyocytes (iPSC-CMs), RBM20 IHC demonstrated splicing speckles in control myocardium (Fig. 3a, left-hand panel) and splicing speckles plus sarcoplasmic signal in the myocardium of a patient with the R636S variant (Fig. 3a, right-hand panel), mirroring our genetically engineered HTZ pigs (Figs. 1c,d and 2e). Local fibrosis confirmed the cardiomyocyte specificity of RBM20 IHC (Fig. 3a, right-hand panel), and non-RBM20 DCM myocardium confirmed sarcoplasmic IHC signal specificity (Fig. 3a, central panel). Additional RBM20 IHC from the myocardium of a patient with the R636S variant is shown in Extended Data Fig. 5a. Focusing on nuclei, IHC-coupled immunofluorescence confocal microscopy often demonstrated more than two splicing speckles in the myocardium of human patients with DCM caused by the RBM20R636S mutation, consistent with somatic polyploidy, as expected in advanced human DCM (Fig. 3b). To emphasize this concept, we compared hematoxylin and eosin staining, chromosome 6- and 8-specific FISH and RBM20 IHC, along with 4′,6-diamidino-2-phenylindole (DAPI) staining, in myocardial tissue from a middle-aged patient with end-stage ischemic DCM (Extended Data Fig. 5b). Concordant with massive polyploidy, giant heart failure nuclei in this patient’s myocardium displayed massive amplification of RBM20 splicing speckles (Extended Data Fig. 5b). Honing in on the human R636S cardiomyocyte sarcoplasm, we observed RBM20 signal distributed in a rosary or beads-on-a-string configuration—the signature of myofibril Z-discs (Fig. 3c and Extended Data Fig. 6a)—confirmed by three-dimensional (3D) video projections (Supplementary Video 12). Double IHC distinguished RBM20 at Z-discs from myofibril-associated TDP-43—another RBP recently linked to sarcomere building but here selectively excluded from Z-discs in human patient and gene-edited pig myocardium (Extended Data Fig. 6b). TDP-43 demonstrated a fibril-like morphology distinct from RBM20R636S in control human iPSC-CMs (Extended Data Fig. 6c). Thus, nuclear in normal control myocardium and amplified with polyploidy in advanced heart failure, sarcoplasmic RBM20R636S decorated myofibril Z-discs in DCM caused by the RBM20 mutation.
Fig. 3 |. Misaccumulation of RBM20 in the sarcoplasm of cardiomyocytes from an RBM20R636S allele carrier.
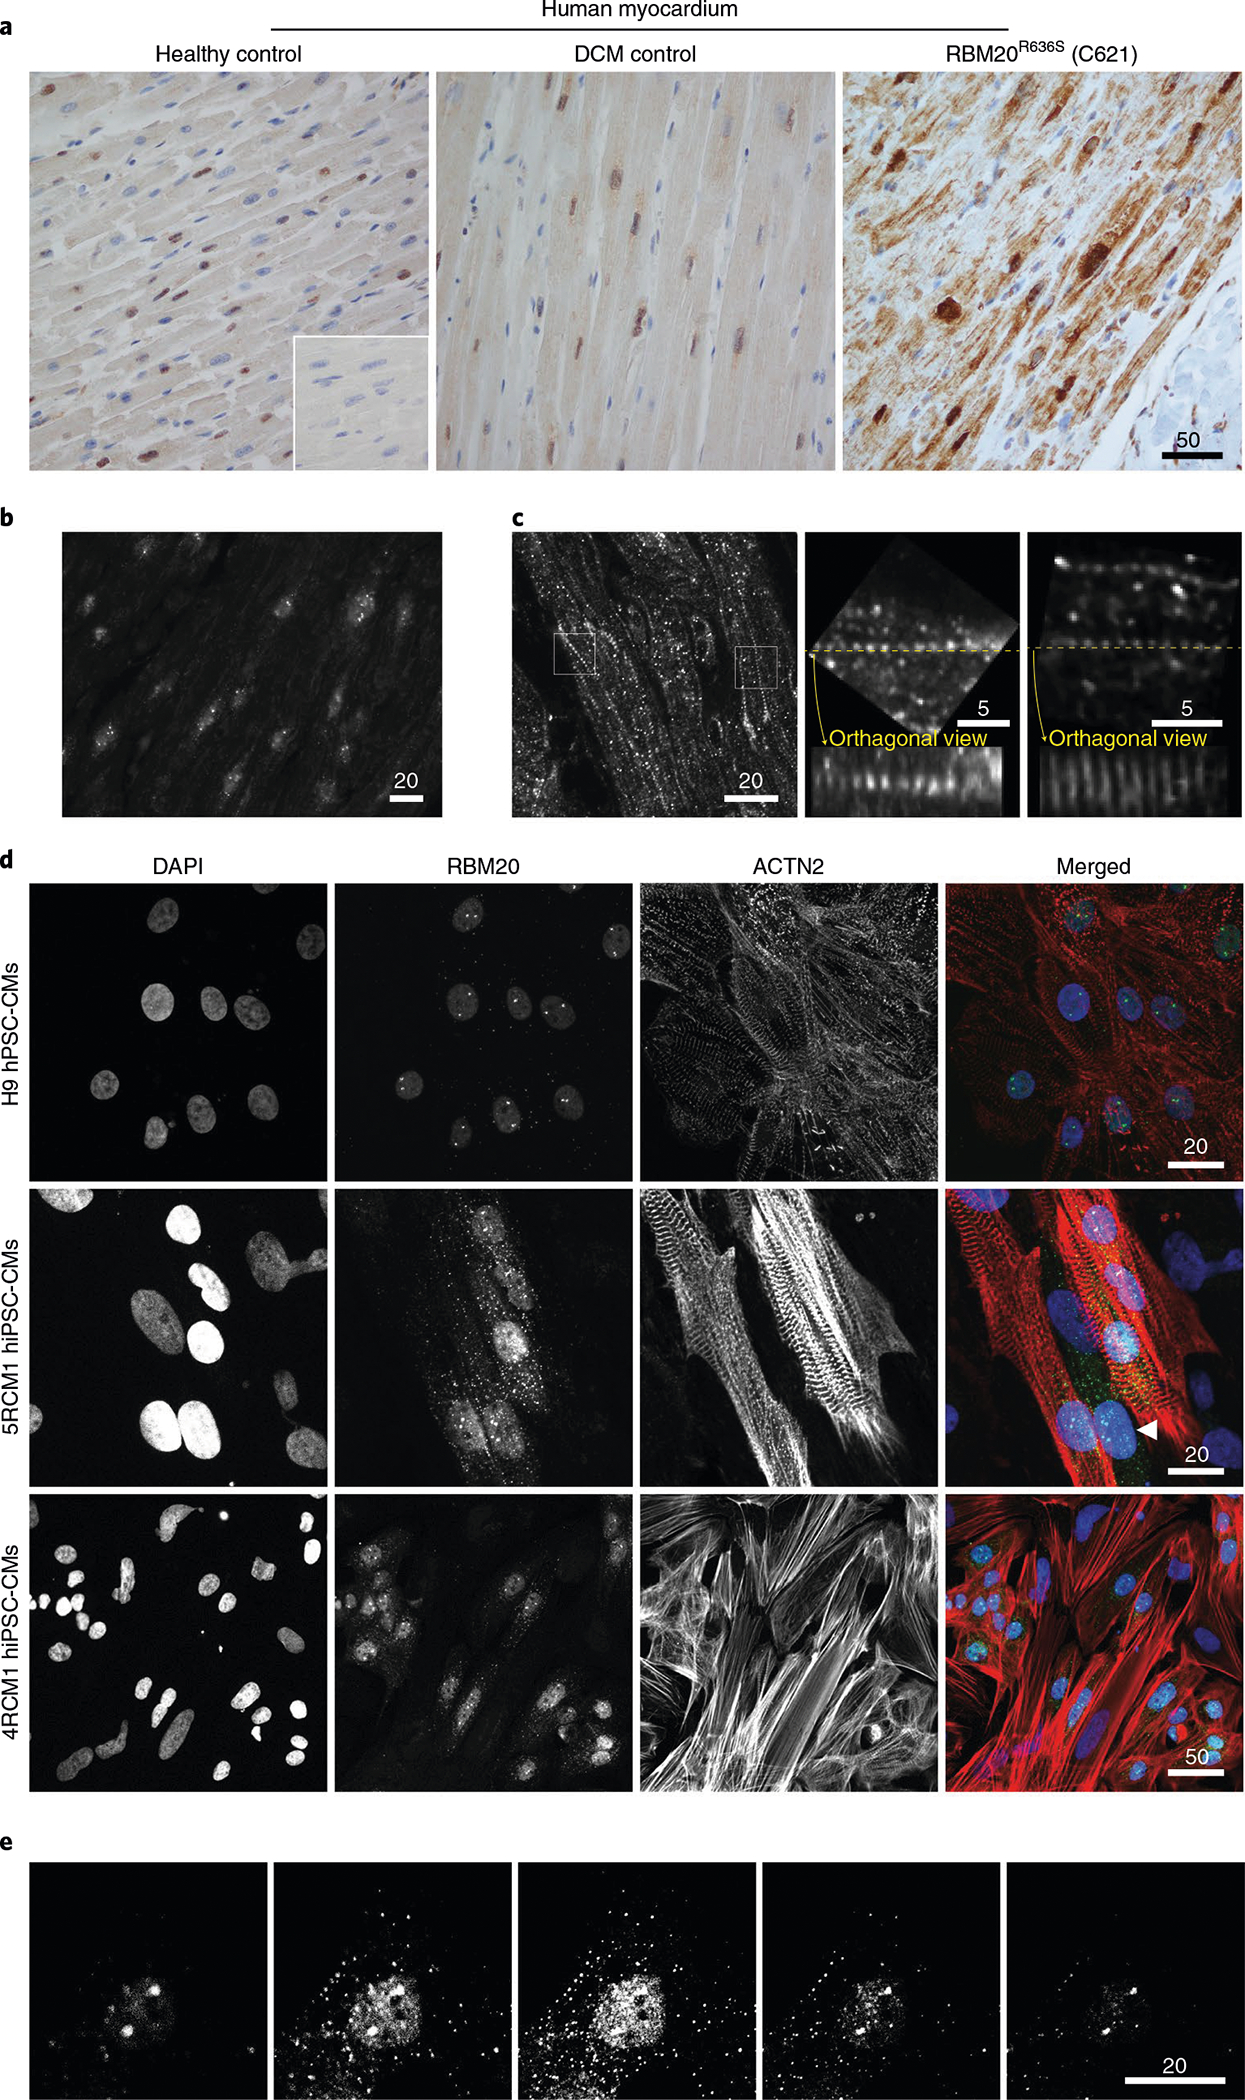
a, RBM20 IHC comparing the human left ventricular myocardium of a healthy control (left), a control with inherited DCM (caused by a mutation unrelated to RBM20; center) and a patient with DCM caused by the RBM20R636S mutation, taken at the time of left ventricular assist device implantation (pre-transplantation). Inset: no primary antibody IHC control. IHC was repeated three times. Additional images at higher magnification are shown in Extended Data Fig. 5a. Scale bar, μm. b, RBM20 F-IHC confocal microscopy of the left ventricular myocardium of a human with DCM caused by the HTZ RBM20R636S mutation, as in a, with the confocal plane focused on cardiomyocyte nuclei to highlight RBM20 splicing speckles. Scale bar, μm. c, RBM20 F-IHC confocal microscopy in the left ventricular myocardium of a human with DCM caused by the HTZ RBM20R636S mutation, highlighting linearly arrayed, precisely spaced puncta (left; see Extended Data Fig. 6 for additional images). The center and right micrographs show orthogonal views, as indicated by the yellow dotted lines, through the confocal Z-stack, highlighting the Z-disc-like three-dimensionality of the sarcoplasmic RBM20R636S signal. Scale bar, μm. d, RBM20 and ACTN2 (cardiac α-actinin) co-ICC with DAPI staining, comparing control H9 hPSC-CMs (H9, in particular, are human embryonic pluripotent stem cells) (top) with iPSC-CMs from two unrelated individuals carrying the RBM20R636S allele (cell lines 5RCM1 and 4RCM1). The arrowhead points to a hiPSC-CM progenitor positive for nuclear RBM20 and sarcoplasmic RBM20R636S but negative for ACTN2. Identical results were observed in five independent experiments. Scale bar, μm. e, Confocal Z-stack through an RBM20-stained hiPSC-CM from the individual 5RCM1 described in d carrying the RBM20R636S allele, highlighting nuclear splicing speckle and sarcoplasmic puncta. Identical results were observed in three independent experiments. Scale bar, μm.
Returning to our patient-derived iPSC-CMs, we confirmed the sarcoplasmic localization of RBM20R636S assemblies by immunocytochemistry (ICC). In addition to lineage-specific signature splicing speckles, H9 human pluripotent stem cell-derived cardiomyocytes (hPSC-CMs) occasionally demonstrated miniscule, easily missed sarcoplasmic RBM20 puncta—an important clue to their normal physiological function (Fig. 3d, top panels). In contrast, all R636S patient-derived iPSC-CMs (5RCM1 (Mayo Clinic DCM Genetics Identifier C413; white male; family DC-27) and 4RCM1 (Mayo Clinic DCM Genetics Identifier C420; white female; family DC-46; see ref. 1) demonstrated abundant RBM20 assemblies often aligned in linear arrays (Fig. 3d, bottom panels). Notably, actinin alpha 2 (ACTN2)-negative cardiomyocyte progenitors also expressed nuclear RBM20 and sarcoplasmic R636S (in linear arrays) (Fig. 3d, arrowhead in central right-most panel). We present a sequential Z-stack image through an RBM20R636S iPSC-CM in Fig. 3e. Thus, RBM20R636S puncta localized to myofibril Z-discs in the myocardium of patients with DCM and formed linear arrays in corresponding iPSC-CMs, confirming the human relevance of our discovery in R636S gene-edited pigs.
RBM20R636S granule biology and biophysics.
We recapitulated the nuclear exclusion and droplet-forming phenotype of RBM20R636S with amino (N)-terminal green fluorescent protein (GFP)-tagged recombinant human proteins by live cell imaging (LCI) in U2OS cells (osteosarcoma cells commonly employed in RBP studies) (Fig. 4a–c), validating protein expression (in 293T cells) by western blotting (Fig. 4b). WT GFP–RBM20 accumulated exclusively in the nucleoplasm, distributing diffusely, excluding nucleoli and occasionally assembling as tiny puncta (Fig. 4c, first panel) that were much smaller than the splicing speckles observed at TTN loci in cardiomyocytes (Figs. 1–3). Substituting one amino acid in this 1,227-amino-acid-long human protein (R to S at position 636) rerouted GFP-RBM20R636S from the nucleus to the cytoplasm where it assembled into variably sized puncta (Fig. 4c, second panel). This mapped the granule assembly function (the LCD–IDR) to the N-terminal half of GFP–RBM20R636S insofar as the ΔΝ mutant, although lacking the R636S residue, accumulated in the cytoplasm but failed to assemble into granule-like structures (Fig. 4c, third panel). The ΔC mutant, like its full-length WT counterpart, accumulated exclusively in the nucleus of U2OS cells, also occasionally forming tiny puncta (Fig. 4c, fourth panel). Thus, a recombinant molecule in heterologous cells recapitulated the RBM20R636S subcellular mislocalization and granule assembly phenotype observed in gene-edited pig myocardium and confirmed in patient tissue and iPSC-CMs. Biotinylated isoxazole (B-isox) affinity chromatography for LCD–IDR proteins25 purified RBM20R636S from pig myocardial lysates, as confirmed by mass-spectrometry (Fig. 4d) and RBM20-specific protein blotting (Fig. 4e). Whole myocardial tissue lysates from WT and HMZ piglets produced identical results in this B-isox affinity chromatography/proteomics analysis.
Fig. 4 |. Subcellular localization and biochemical, biophysical and ultrastructural features of RBM20R636S biomolecular condensates and dysregulated RNP granules.
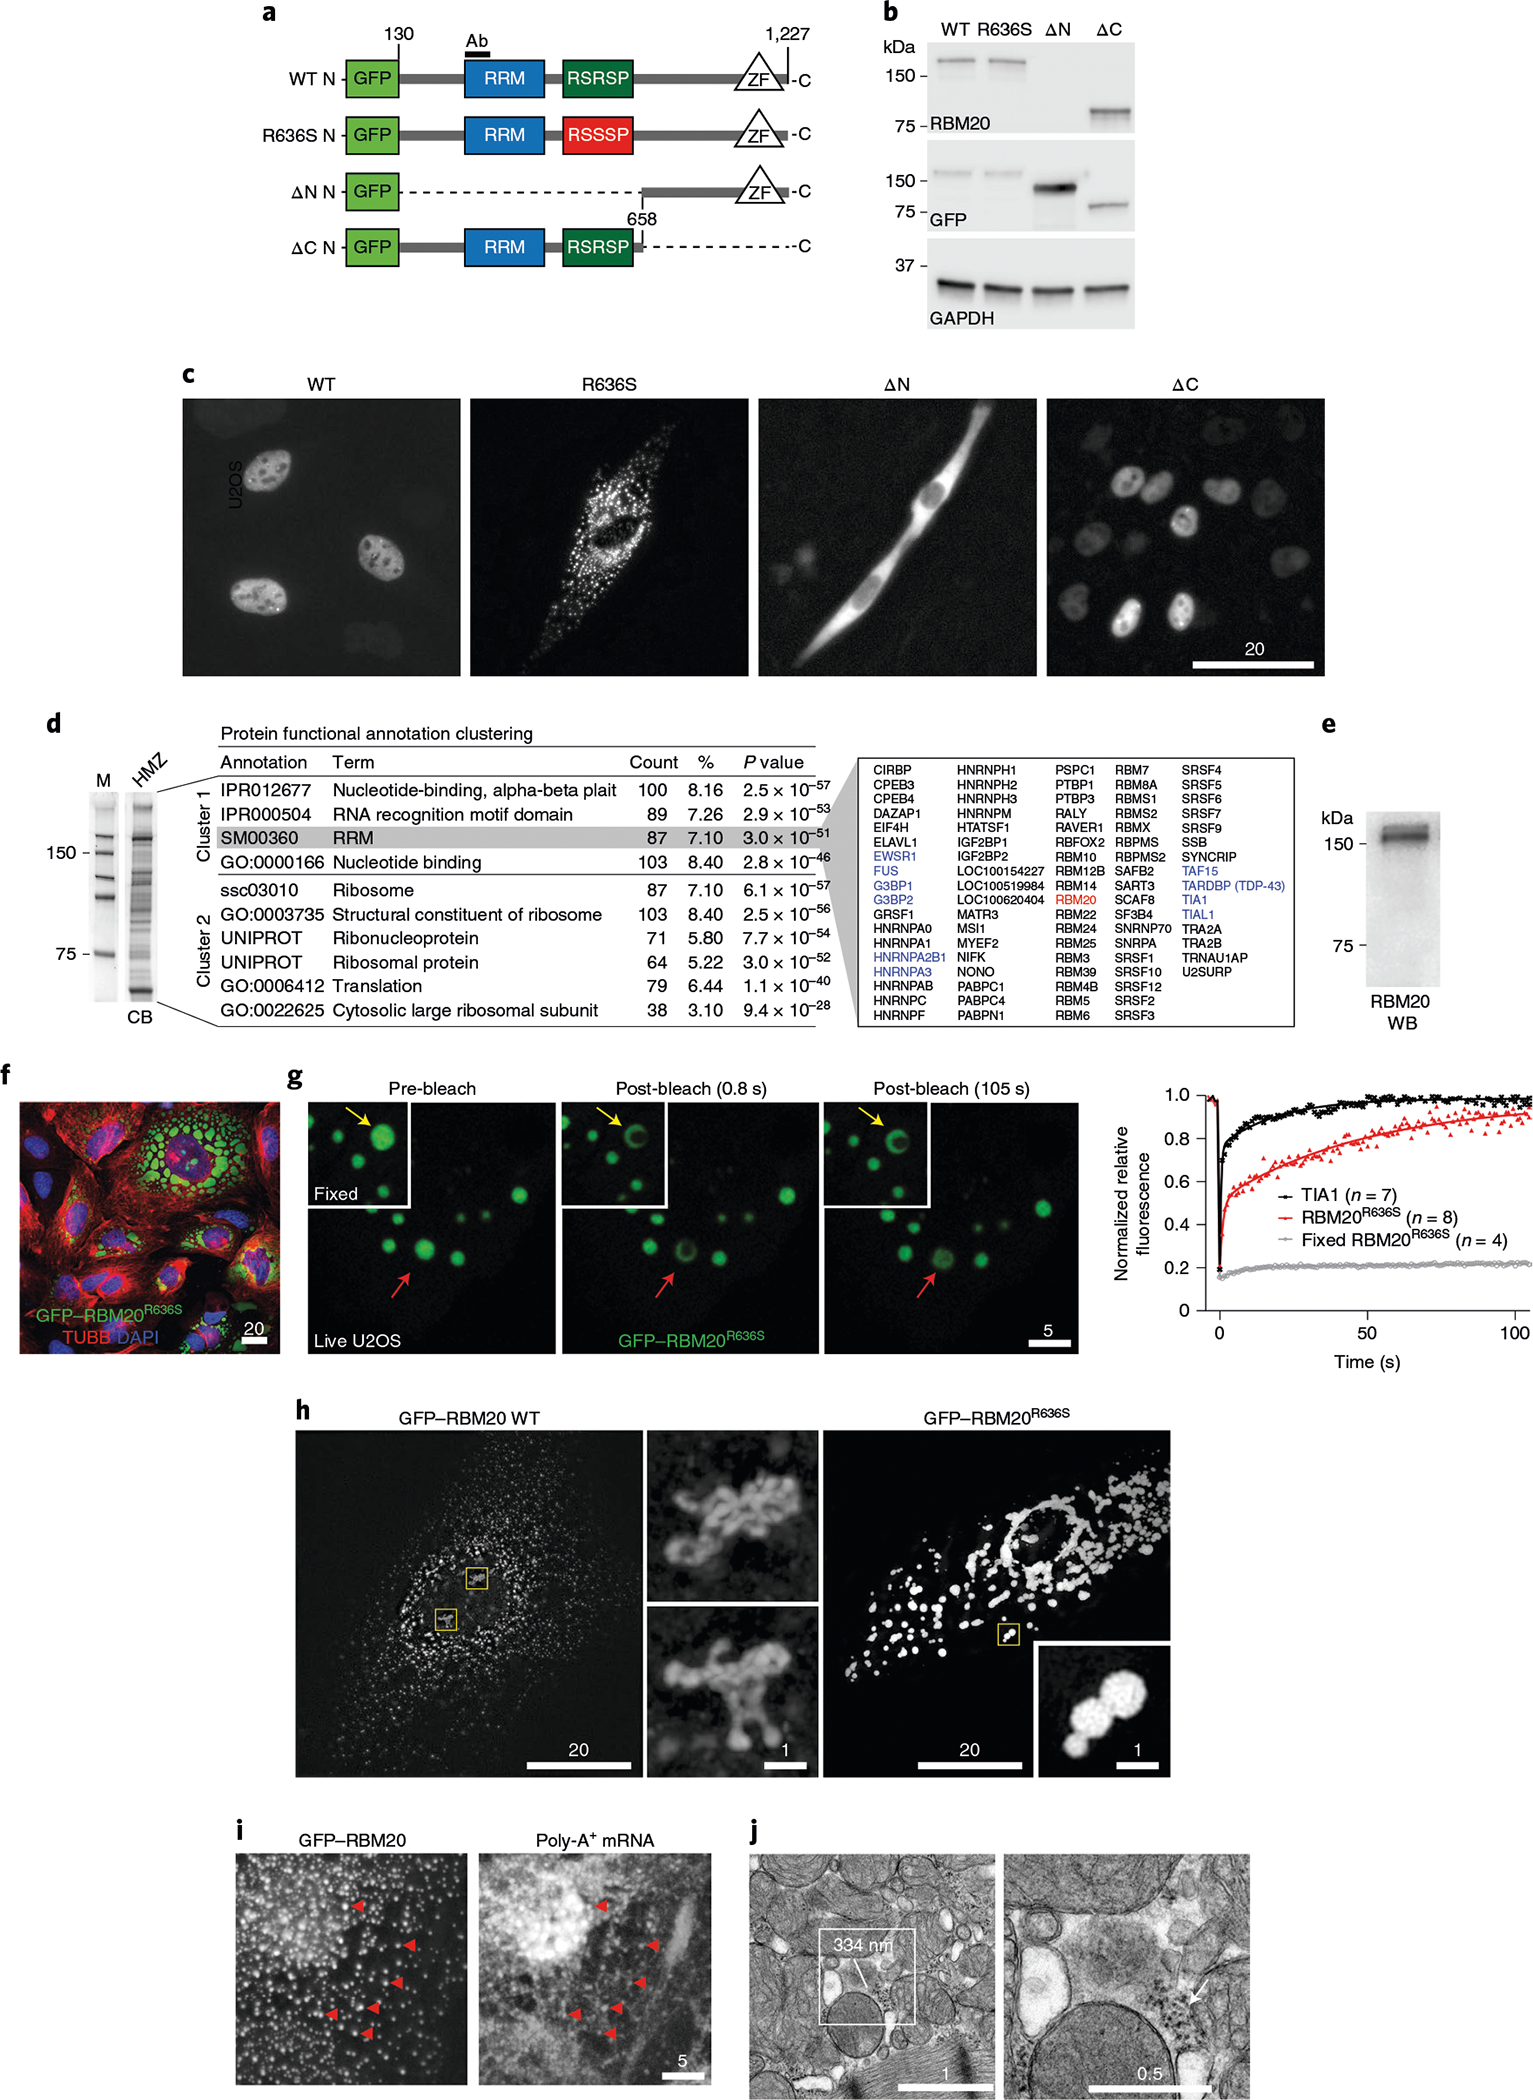
a, Schematic of N-terminal emerald GFP–human RBM20 fusion constructs: WT RBM20; the re-engineered R636S point mutant; the ΔΝ mutant (missing the N-terminal segment); and the ΔC mutant (missing the C-terminal segment). The epitope recognized by the RBM20 RRM domain antibody is labeled ‘Ab’. b, Western blot analysis of the constructs shown in a expressed in U2OS cells, using RBM20 (RRM), GFP and GAPDH antibodies. c, Fluorescence microscopy LCI of the GFP-RBM20 WT, R636S, ΔΝ and ΔC constructs shown in a expressed in U2OS cells. Identical results were observed in three independent experiments. Scale bar, μm. d, Coomassie blue SDS-PAGE (left) and proteomics analysis (right) of polypeptides purified by B-isox affinity chromatography from the left ventricular myocardium of a 1-d-old HMZ piglet. M, size markers; CB, Coomassie blue stained protein gel. RBPs are highlighted in blue and RBM20 (R636S) is highlighted in red. The proteomics data were analyzed for enrichment by DAVID Functional Annotation Analysis, with P values calculated by Fisher’s exact test (see Methods for details). Identical results were obtained in three independent pull-down experiments. e, Western blot pull-down analysis of RBM20R636S by B-isox affinity matrix from HMZ pig left ventricular myocardium. This result is representative of three independent experiments on left ventricular myocardial extracts from three HMZ animals. RBM20 WB, western blot of B-isox pull-down with RBM20 antibody. f, Confocal microscopy of U2OS cells transfected with GFP–RBM20R636S, highlighting liquid-like beading up or wetting of protein droplets on the cytoplasmic surface of the cell’s nuclear envelope. This result is representative of three independent experiments. Scale bar, μm. g, Left: FRAP confocal LCI comparing paraformaldehyde-fixed (insets) and live GFP–RBM20R636S-transfected U2OS cells immediately before bleaching (pre-bleach) and 0.8 and 105 s post-bleach. The FRAP signal for a single droplet is highlighted by yellow (fixed) and red (live) arrows. Right: FRAP recovery curves of fixed (gray) and live (red) GFP–RBM20R636S-transfected U2OS cells compared with over-expressed GFP–TIA1 (black). Identical results were observed in three different transfection experiments. n is the number of droplets analyzed per condition. Scale bar, μm. h, Super-resolution confocal microscopy comparing H9 hPSC-CMs transfected with GFP–RBM20 (left panel and central panels showing higher-magnification images of the areas outlined in yellow) and GFP–RBM20R636S (right panel and higher-magnification inset). Identical results were observed in three different transfection experiments. Scale bar, μm. i, Co-localization of GFP–RBM20 detected by ICC (left) coupled with FISH of poly-A+ mRNA (right) in H9 hPSC-CM sarcoplasm. Co-localizing GFP-RBM20 and poly-A+ mRNA signals are highlighted by red arrowheads. Identical results were observed in three different transfection experiments. Scale bar, μm. j, TEM images of the left ventricular myocardium of a 16-week-old HMZ pig, highlighting a biomolecular condensate ~334 nm in diameter and a presumptive RNP granule associated with a polyribosome tail (tiny, darker granules; arrow in image to the right). The results are representative of at least three imaging experiments on three HMZ animals. Scale bar, μm.
Material-state transitions are central to RNP granule pathobiology. Confocal microscopy of GFP–RBM20R636S granules assembled in U2OS cells demonstrated liquid biophysical behavior through wetting or beading up (that is, surface tension-driven fusion of liquid droplets stretching across the nuclear envelope’s outer surface; Fig. 4f, with additional examples shown in Extended Data Fig. 7). Furthermore, confocal LCI video microscopy documented GFP–RBM20R636S droplet fusion (Supplementary Videos 13–15). Compared with fixed cells (Fig. 4g (inset panels and graph) and Supplementary Video 16), fluorescence recovery after photobleaching (FRAP) LCI of GFP–RBM20R636S demonstrated recovery of signal within 100 s, consistent with a viscous liquid material state (Fig. 4g (major panels and graph) and Supplementary Video 17). Super-resolution confocal microscopy demonstrated an ensemble of chromatin-associated, tubular, worm-like cylinders in GFP–RBM20-expressing cardiomyocytes (Fig. 4h (yellow boxes in left-hand panel expanded in the central panels) and Supplementary Videos 18–20), providing a striking anatomical image of the RBM20 splicing factory8. By super-resolution confocal microscopy, sarcoplasmic GFP–RBM20 puncta demonstrated a stable core surrounded by phase-separated shell substructures (Fig. 4h (right-hand panel), Extended Data Fig. 8a and Supplementary Video 21), analogous to stress granules26. [5′-Cy5-Oligo-d(T)-30] fluorescent poly-A+ mRNA oligonucleotide probes co-localized mRNA to sarcoplasmic GFP–RBM20 puncta in cardiomyocytes (Fig. 4i; expanded in Extended Data Fig. 8b). An additional example of mRNA localization to sarcoplasmic GFP–RBM20 puncta is presented in Extended Data Fig. 8c. Finally, TEM visualized RBM20R636S granules in HMZ juvenile myocardium as mesoscale membraneless organelles ~300–500 nm in diameter (Fig. 4j, box), here associated with a polyribosome tail (arrow in Fig. 4j, expanded image). Taken together, these data provide the starting point for understanding how mutational disruption of RBM20’s dual phospho-nuclear localization signal leads to sarcoplasmic assembly with mRNA into RBM20R636S granules with a core/shell substructure analogous to stress granules, henceforth called R3Gs (RBM20R636S RNP granules).
Cytoskeleton-linked R3Gs.
We observed a remarkable constellation or network of stationary (passively beating), linearly arrayed, cytoskeleton-linked R3Gs in the cardiomyocyte sarcoplasm (Fig. 5a and Supplementary Video 22). A second example is shown in Supplementary Video 23. We also observed mobile GFP–RBM20 RNP granules by LCI video microscopy (Fig. 5a (right-hand panel) and Supplementary Videos 24–26). RBM20 immunofluorescence coupled with fluorescence-tagged phalloidin (F-actin) staining in patient-derived iPSC-CMs confirmed R3G association with actin microfilaments at precisely spaced intervals (arrowheads in Fig. 5b, bottom panels). R3Gs also associated with microtubules by double immunofluorescence staining in iPSC-CMs (Extended Data Fig. 8d). Actin alpha cardiac muscle 1 (ACTC1) specifically decorated the outermost phase boundary of GFP–labeled R3Gs in H9 cardiomyocytes (Fig. 5c) or in control human induced pluripotent stem cell-derived cardiomyocytes (hiPSC-CMs; Fig. 5d). Connecting to B-isox affinity chromatography (Fig. 4e), ACTCl’s association with R3Gs explained the specific pull down of this protein from HMZ myocardial extracts, as confirmed by proteomics (Extended Data Fig. 9a). Taken together, these results demonstrate a unique relationship between R3Gs and cardiomyocyte cytoskeletal elements—sarcoplasmic ACTC1 filaments in particular.
Fig. 5 |. Cytoskeleton coupling and biomolecular partitioning by RBM20 RNP granules dysregulated in cardiomyocyte sarcoplasm.
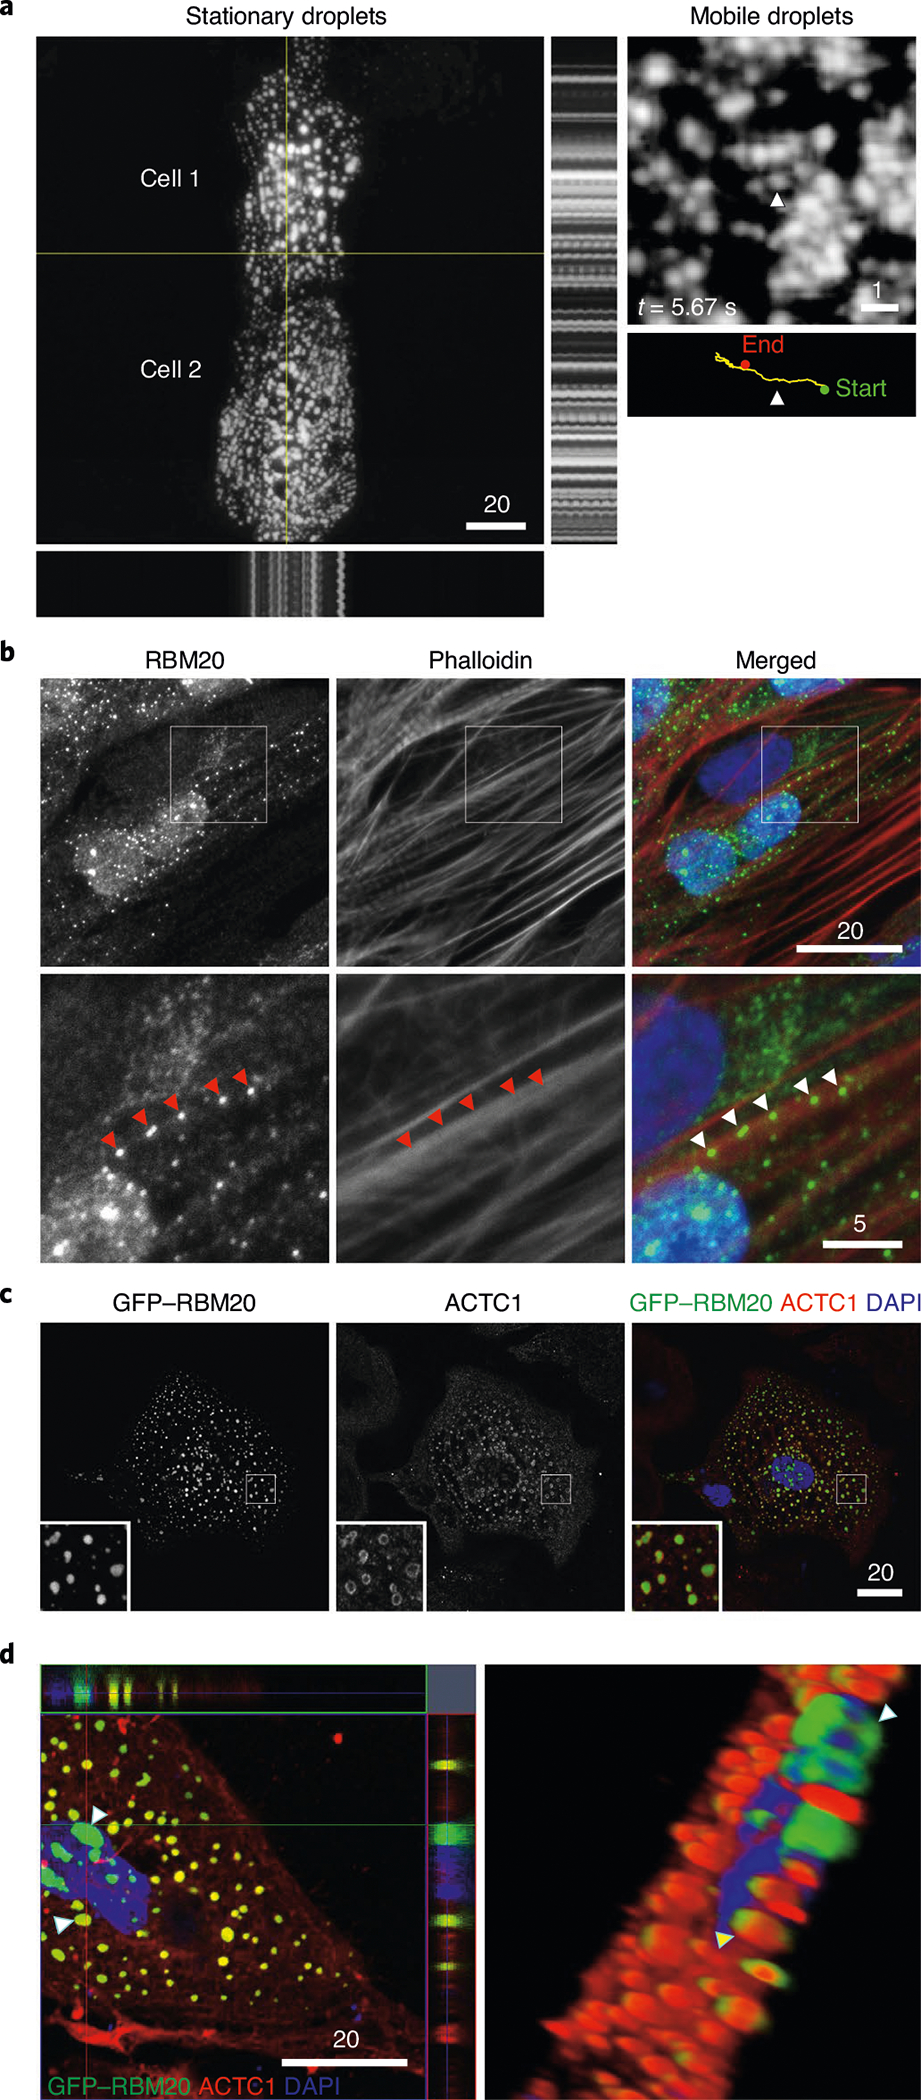
a, LCI of H9 hPSC-CMs expressing GFP–RBM20R636S. Left: stationary RNP granules in two synchronously beating cardiomyocyte cells. Orthogonal motion traces are shown to the right and below these images (positions indicated by yellow lines), tracking rhythmically beating RNP granules. Right: LCI of an H9 hPSC-CM expressing GFP–RBM20R636S (top), highlighting the sarcoplasmic trek of one mobile RBM20 RNP granule over the course of 15 s (bottom). The movement of the granule is shown by the yellow line, starting from the green dot and ending at the red dot. The image was captured at 5.67 s. The arrowhead in the upper image indicates the specific granule followed in the time map shown below with the corresponding arrowhead below indicating the precise time point (t = 5.67 s) captured in the still image above. Supplementary Videos 22–26 show additional examples of stationary and mobile RNP granules. Scale bar, μm. b, Co-staining for RBM20 by ICC and F-actin by fluorescently conjugated phalloidin, together with DAPI staining, in RBM20R636S hiPSC-CMs (4RCM1) at low (top panels) and high magnification (bottom panels). The red and white arrowheads highlight native RBM20 RNP granules docked at precisely spaced intervals along actin microfilaments. Scale bar, μm. c, Fluorescence microscopy imaging of ACTC1 by ICC and GFP in GFP–RBM20R636S-transfected H9 hPSC-CMs, localizing ACTC1 to the outer boundary of sarcoplasmic RBM20 RNP granules. Insets show higher-magnification views of individual granules. Scale bar, μm. d, Left: confocal microscopy imaging of a control hiPSC-CM (081-HLH-004) transfected with GFP–RBM20R636S and imaged for ACTC1 by ICC (red), GFP (green) and DAPI staining (blue), demonstrating ACTC1 signal localized to RBM20 RNP granules. The coordinates of the orthogonal Z-stack images are indicated by the red and green lines. Arrowheads highlight two granules: a large, mostly green perinuclear granule and a yellow sarcoplasmic granule demonstrating red ACTC1 signal wrapped around a green granule. Scale bar, μm. Right: corresponding Z-stack projection of the cell, providing a 3D perspective.
Pleiotropic R3G pathobiology.
RNP granules that exert stress granule-like functions (in the absence of inciting stress) provide an attractive mechanistic hypothesis for R3G molecular and cellular pathophysiology in cardiomyocytes. Double IHC for ACTC1 and RBM20, comparing day 7 WT and HMZ myocardium, demonstrated severe RNP granulopathy (Fig. 6a). The arrowhead in Fig. 6a highlights a poorly differentiated or degenerative-like cardiomyocyte from a HMZ piglet with a LVEF of 20–25% heavily laden with R3Gs on day 7 of postnatal life. In longitudinal (Fig. 6a) or transverse (Extended Data Fig. 9b) orientation, double ACTC1/RBM20 IHC demonstrated an inverse relationship between R3G burden and cardiomyocyte structural integrity. Hypothesizing that relentless R3G accumulation antagonized cardiac differentiation through stress granule-like functions, we asked whether RBM20 RNP granules could fuse (a fundamental and dynamic aspect of stress granule biology) with authentic stress granules induced by exposure of GFP–RBM20R636S-transfected U2OS cells to sodium meta-arsenite (NaAsO2), a metabolic poison (Fig. 6b, top panels). We co-visualized stress granules by ICC for TIAR (T cell–restricted intracellular antigen-related protein; a canonical stress granule marker) with GFP–R3Gs in stressed U2OS cells (Fig. 6b, top panels). R3Gs fused with stress granules in U2OS cells (Fig. 6b, top panels). Similarly, when stained for Ras GTPase-activating protein-binding protein 1 (G3BP1; another stress granule marker), GFP–RBM20 RNP granules fused with stress granules. In fact, GFP–RBM20-transfected, NaAsO2-treated U2OS cells completely absorbed the G3BP1 signal into GFP–RBM20 RNP granules (Extended Data Fig. 9c). In R636S patient-derived iPSC-CMs, native R3Gs also fused with NaAsO2-induced stress granules, as shown by double ICC for RBM20R636S and TIA1 (a third canonical stress granule marker) (Fig. 6b, bottom panels). The fusion of R3Gs with authentic NaAsO2-induced stress granules implies that they share pathogenic functions18. To connect R3Gs to the ACTC1 phenotype observed in HMZ pig myocardium (Fig. 6a and Extended Data Fig. 9b), we expressed GFP–RBM20R636S in H9 cardiomyocytes then co-stained for actin filaments by fluorophore-coupled phalloidin and microtubules by TUBB (β-tubulin) ICC (Fig. 6c). GFP–R3Gs disrupted the cardiomyocyte’s actin cytoskeleton without disrupting the complex tubulin network (Fig. 6c), consistent with the biophysical partitioning of actin into GFP–R3Gs (Fig. 5c,d). Next, we analyzed GFP–RBM20R636S-expressing H9 cardiomyocytes for the granule-associated loss of striated sarcoplasmic texture, which was obvious by LCI, establishing a fast Fourier transformation (FFT) striation index (Fig. 6d,e), as described27, with the workflow pipeline outlined in Extended Data Fig. 10a. By this analysis, untransfected cardiomyocytes generated a halo with a correspondingly high striation index. In contrast, GFP–R3G-laden H9 hPSC-CMs produced no halo, with a corresponding low striation index (Fig. 6d,e, graph), thus mirroring cardiomyocytes flooded with R3Gs in day 7 HMZ pig myocardium (Fig. 6a (arrowhead) and Extended Data Fig. 9b), and the heavy GFP–R3G burden disorganized the actin cytoskeletal infrastructure in H9 cardiomyocytes. To close, we present one final example that segregates RBM20’s physiological nuclear alternative splicing function from the pathological consequences of sarcoplasmic RNP granule assembly. H9 hPSC-CMs transfected with WT GFP–RBM20 demonstrated normal F-actin structure by phalloidin staining (and would produce a correspondingly high striation index) when RBM20 remained nuclear (Fig. 6f, white arrowhead). In contrast, when high-level GFP–RBM20 expression overflowed into the sarcoplasm, RBM20 RNP granules effectively liquefied or coagulated the actin cytoskeleton (Fig. 6f, yellow arrowhead)—a pathological consequence further highlighted by confocal microscopy 3D video projections (Supplementary Videos 27 and 28).
Fig. 6 |. Pathological RNP granules in HMZ pig myocardium are linked to stress granule fusion and cytoskeletal disassembly in cell models.
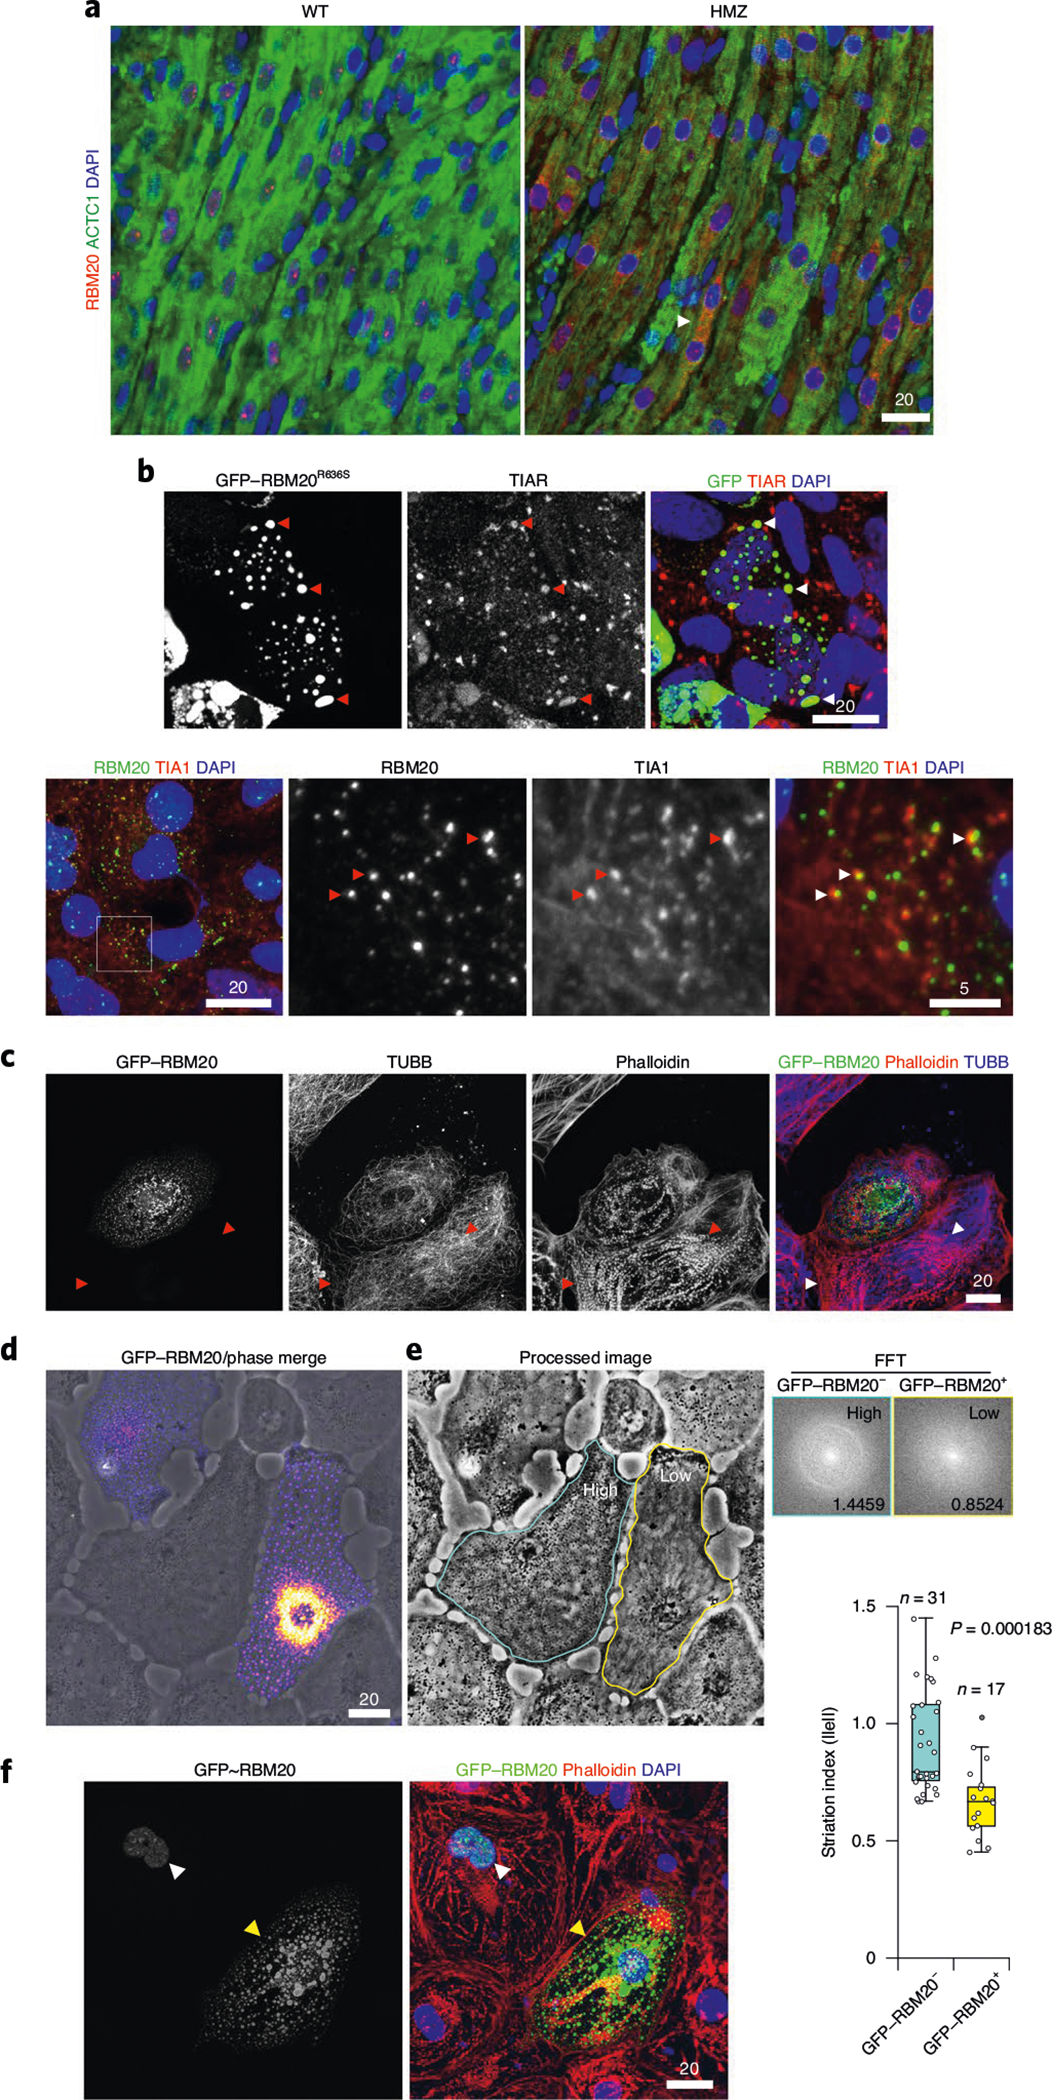
a, Immunofluorescence microscopy imaging of ACTC1 (green) and RBM20 (red), with DAPI staining, comparing the left ventricular myocardium from WT and HMZ pigs at postnatal day 7, as in Fig. 1c,d. The arrowhead highlights an individual cardiomyocyte with advanced RNP granulopathy. Scale bar, μm. b, Top: fluorescence microscopy imaging of GFP and the stress granule marker TIAR by ICC, together with DAPI staining, in sodium arsenite-treated GFP–RBM20R636S-transfected U2OS cells. Red and white arrowheads highlight RBM20R636S and stress granule fusion events. Bottom: human RBM20R636S patient-derived iPSC-CMs (4RCM1) treated with sodium arsenite and then co-stained for R3Gs and stress granules by ICC for RBM20 and TIA1 (T cell–restricted intracellular antigen). Scale bar, μm. c, H9 hPSC-CMs transfected with GFP–RBM20R636S and imaged for microtubules (by TUBB (β-tubulin) immunocytochemistry), actin filaments (by fluorescence-tagged phalloidin) and recombinant RBM20R636S (by GFP), as well as DAPI staining. The arrowheads highlight prominent sarcomeric structures that were observed only in cardiomyocytes lacking RBM20R636S expression. Scale bar, μm. d, Phase contrast plus fluorescence LCI of GFP–RBM20R636S-transfected H9 hPSC-CMs, demonstrating a loss of striated patterning in transfected cells. Scale bar, μm. e, FFT analysis of striated patterning by phase contrast imaging in live human cardiomyocytes. Left: GFP–RBM20R636S-transfected (circled in yellow) and control (circled in blue) H9 hPSC-CMs, as in d; d and e are the same images differentially processed to highlight granules or striated patterning, respectively. Top right: examples of FFT-derived halo images for cells with high and low striation indices. The numbers are the calculated ‘striation index’ for each image; the left panel is the untransfected cell (circled in blue, with a high striation index value, 1.4459), and the right panel is a GFP-RBM20 transfected cell (circled in yellow, with a low striation index value, 0.8524). ||e|| (y axis, bottom right plot) indicates the calculated striation index based on FFT analysis of images. Bottom right: quantitation of striation indices for GFP–RBM20− (blue) and GFP–RBM20+ (yellow) cardiomyocytes. A high striation index corresponds to a highly ordered striation pattern. The box and whisker plots report median values (horizontal lines), first and third quartiles (bottom and top box edges, respectively) and ranges (whiskers), with one outlier (open dot). n is the number of unique cells analyzed. The P value was obtained by two-sided Student’s t-test. f, Confocal microscopy of GFP–RMB20-transfected H9 hPSC-CMs, showing GFP, F-actin (by fluorescence-tagged phalloidin) and DAPI staining, demonstrating sarcomeric disorganization in cells expressing high (yellow arrowhead) but not low (white arrowhead; nuclear only) levels of GFP–RBM20 (a dose-dependent relationship). Identical results were observed in three independent transfection experiments. Scale bar, μm.
Discussion
Our results pivot mechanistic focus in DCM caused by the RBM20 mutation from nuclear splicing3,6,9,28–31 to sarcoplasmic biomolecular condensates—the liquid droplet organizational logic for tidying up cellular space and managing the complex biochemical life cycle of mRNA (see the cartoon in Extended Data Fig. 10b)13–15,32. Our results neither challenge nor diminish the pathophysiological significance of developmental stage/splice isoform mismatches—the widely accepted mechanistic model for DCM caused by the RBM20 mutation3,9,10,28,31. In contrast, they validate the first gene-edited pig model of RBM20 alternative splicing loss of function. Yet, beyond pathological alternative splicing, our results add a second, liquid droplet dimension to the molecular pathophysiology of DCM caused by the RBM20 mutation through dysregulated R3Gs—a multifaceted sarcoplasmic gain of function. In vivo, dysregulated R3Gs pleiotropically impact myocardial growth and differentiation programs, producing myocardial insufficiency and fatal circulatory failure in the majority of neonatal HMZ gene-edited pigs. Surviving the critical neonatal transition, resilient juvenile HMZ pigs display functionally and clinically compensated cardiomegaly, building myocardial mass that is around twice that of control pigs by 16 weeks of age, providing a novel entry point for the discovery of modifiers of RNP granule disease natural history, molecular and cellular mechanisms and future therapeutics that override or neutralize continuously accruing R3Gs.
We conceptualize that RBM20 normally contributes to a cytoskeleton-linked liquid condensate network—a crucial (but, until now, unrecognized) functional component of the cardiomyocyte cytoskeletal infrastructure. This network of interlinked liquid droplets, in principle, manages the continuity, maintains the integrity and integrates the flow of genetic information (as mRNA) from its transcriptional birthplace in the nucleus to the Z-disc (the command center of myofibril biosynthesis)12,33,34. Intriguingly, among this network’s functions, transporting TTN–N2BA–G (an mRNA cargo >100,000 nucleotides in length) to the Z-disc for local translation is a specialized cellular bioengineering challenge that is probably deranged by R3G misassembly13,16,17,35–37. By length criteria alone, TTN–N2BA–G (one of the largest mRNAs in nature and one of the most abundant molecules in cardiomyocytes)3,38 would provide a highly efficient driver of liquid condensate assembly18,26,39–41. Transiently assembled during cellular emergency, stress granules are designed to halt cellular information flow, silencing translation and safeguarding mRNA until the inciting stress abates18,22,42–45. However, the assembly of stress granule-like condensates by misguided RBPs such as RBM20R636S pathologically throttles genetic information flow, causing rather than mitigating cellular stress18,22,42–46. Pleiotropic pathological consequences of R3Gs in HMZ myocardium include premature arrest of the proliferative cell cycle, producing pan-myocardial hypocellular hypoplasia possibly resulting from sequestration of LCD–IDR cell cycle regulatory proteins and/or encoding mRNAs23. While partitioning ACTC1 into the liquid phase boundary of RNP granules is probably a physiological aspect of myofibril building, here, driven by pathological R3Gs, ACTC1 partitioning disrupts normal actin polymerization dynamics, capturing a critical component of the cardiomyocyte’s cytoskeletal infrastructure within large liquid droplets.
Myriad mechanistic questions remain unanswered. The top among these is whether R3Gs over time aggregate into amyloid-like fibrils—an irreversible event that clogs biomolecule quality control and clearance systems14. In this regard, RNP granulopathy, which is floridly displayed at birth in RBM20R636S HMZ pigs, might provide a myocardial blueprint for neurodegenerative disease. Whether R3Gs associate with TDP-43 myo-granules (recently discovered regulators of myofibril biogenesis in skeletal muscle16,17), is another important question. Future studies will address RBM20’s post-translational modification profile, including R methylation, ubiquitination and, most crucially, the biochemistry of phosphorylation-gated nucleocytoplasmic shuttling, as well as cytoskeletal docking. Gene-edited pigs with DCM caused by RBM20 mutation provide an experimentally expedient and economically practical model of end-stage/terminal DCM, displaying authentic and dynamically regulated signs, symptoms, serology and non-invasive imaging results, as well as bona fide congestive heart failure. Curtailing excessive HMZ piglet loss of life through intensive animal husbandry is paramount. Studies of developmentally accelerated RBM20R636S HTZ pigs that condense decades of RNP granule pathobiology into months or a few years will provide crucial insights into the natural history of human DCM caused by RBM20 mutation1,47–49. We hypothesize that HTZ pigs will display the same organ dysfunction, as well as tissue, cellular and molecular pathobiology, as their HMZ littermates, only recalibrated to more gradual R3G accrual generated by a single R636S allele dynamically multiplied through somatic polyploidy (that is, fast-tracked human-like clinical latency). Ready-made for preclinical studies, yet mechanistically accessible, the RBM20R636S myocardial RNP granulopathy pig provides a unique developmentally accelerated and dynamically regulated model for advancing the basic and translational science of biomolecular condensates—a new frontier for drug discovery.
Online content
Any methods, additional references, Nature Research reporting summaries, source data, extended data, supplementary information, acknowledgements, peer review information; details of author contributions and competing interests; and statements of data and code availability are available at https://doi.org/10.1038/s41591-020-1087-x.
Methods
Institutional approvals.
All of the animal experiments were approved by the Mayo Clinic Animal Care and Use Committee and conformed to the Guide for the Care and Use of Laboratory Animals published by the US National Institutes of Health (https://grants.nih.gov/grants/olaw/guide-for-the-care-and-use-of-laboratory-animals.pdf). Specifically, this project was approved under Mayo Clinic protocol A36914–14 (Characterization of cardiovascular pathophysiology in porcine model deficient in RBM20). At Recombinetics, the RBM20 research animals were produced and propagated under Recombinetics’ approved class A breeding program, renewed in February 2020 (certificate number 41-A-0483). All hiPSC studies, including reprogramming from fibroblasts and differentiation into cardiomyocytes in spinner cultures at ReGen, were approved by the Mayo Clinic Institutional Review Board (IRB) under protocol number 12–007154 (Bioengineered cardiac tissue for cardiomyopathy analysis). Explanted human heart tissue was obtained following informed written consent under Mayo Clinic IRB protocol 1452–00 (Identification of genetic mechanisms for idiopathic dilated cardiomyopathy).
Transcription activator-like effector nuclease (TALEN) design and gene editing.
For TALEN-based gene editing in pigs, candidate TALEN target DNA and repeat-variable di-residue sequences were identified using the online tool TAL Effector Nucleotide Targeter 2.0 (https://tale-nt.cac.cornell.edu). Porcine RBM20-targeted TALEN repeat-variable di-residue codes were: TALEN: NN HD NG NI NG HD NG HD NN HD NI NN NI NG NI HD NN NN (left) and TALEN: HD NI HD NG NN NN NI HD NG NG HD NN NI NN NI (right). Plasmids for in vitro TALEN mRNA transcription were constructed in RCIscript-GoldyTALEN (Addgene). The partial homology-directed repair (HDR) template sequence and map for R-to-S mutagenesis at position 636 of the RBM20 polypeptide, insertion of an RFLP diagnostic BglII site and mismatches to prevent re-cutting of successfully edited DNA are shown in Fig. 1b and Extended Data Fig. 1. TALEN gene editing was done in embryonic fibroblasts from outbred large white pigs (Sus scrofa domesticus), delivering single-stranded RBM20 left and right TALEN monomer mRNAs and a single-stranded oligodeoxynucleotide HDR template by electroporation. Gene-edited pig fibroblasts were subcloned and analyzed by RFLP/PCR analysis using the following exon 9 primers: 5′-GCCAGGACTGTGCTTAAGGA-3′ (forward) and 5′-TCGTTCCTCCTCTCTCCTGG-3′ (reverse). After diagnostic BglII digestion, DNA was resolved on 10% polyacrylamide, visualized by ethidium bromide staining and isolated for confirmation of genotype by Sanger sequencing.
Pig production.
All cloned reconstructed embryos were produced under license of chromatin transfer technology from Hematech to Cooperative Resources International–International Center for Biotechnology (Verona, Wisconsin). Engineered pigs were bred under the US Department of Agriculture class A breeding license held by Recombinetics. Animals were enrolled under approved Institutional Animal Care and Use Committee (IACUC) protocols at Mayo Clinic, either as weanlings (~28 d) or as pregnant sows for cesarean section delivery.
Pig husbandry and procedures at Mayo Clinic.
For the piglet cohort sacrificed at day 7, animals were delivered by caesarean section at Mayo Clinic’s animal facility. For the 16-week juvenile pig cohort, animals were born at Recombinetics and sent to Mayo Clinic after weaning. Approved by the Mayo Clinic IACUC, veterinarians supervised all husbandry, experimental protocols and manipulations, which were done according to Mayo Clinic Department of Comparative Medicine policies, procedures and record keeping (details available from J.W.S. upon request). Trained anesthesiologists and surgical technicians assisted in cesarean section delivery at 115 d of gestation, which was done with propofol induction and inhaled isoflurane continuous anesthesia in sows pretreated with intramuscular buprenorphine and epidural lidocaine analgesia. After delivery from the pregnant uterus, a dedicated team resuscitated and tagged piglets and performed initial screening echocardiograms, as described below. Clinical assessments were done before placing animals in heated rearing boxes for continuous observation. After caesarean delivery, sows received pentobarbital euthanasia. Experienced surrogate sows reared the colostrum-fed newborn piglets until euthanasia at 7 d of age. Euthanasia was done humanely with intravenous pentobarbital after sedation of the piglets or sows with telazol/xylazine in accordance with Mayo Clinic IACUC-approved protocols.
Echocardiography in newborn piglets.
Echocardiograms were performed with a GE Vivid 7 ultrasound machine by a pediatric cardiology sonographer using GE 10, 7 and 4 MHz probes in unsedated newborn piglets placed in a left lateral decubitus or supine position while continuously monitored for heart and respiratory rate. The images collected included two-dimensional (2D) images of coronal (four-chamber) right ventricle and left ventricle size, function and wall motion (from subcostal windows and mitral and aortic valves), as well as images of the left ventricle by 2D and color Doppler (from parasternal windows) and the tricuspid valve by color Doppler (from apical windows).
Cardiac MRI in 16-week-old juvenile pigs.
For cardiac MRI (Mayo Clinic-approved IACUC protocol A36914–14), food was withheld from pigs scheduled for MRI for 12 h before the procedure. Pigs were sedated with telazol and xylazine, intubated and transported to the MRI suite with intravenous access. At the MRI suite, pigs were maintained on continuously inhaled isoflurane. After the scan, pigs were returned to the animal housing facility and monitored for body temperature and respiration until fully recovered. Cardiac MRIs were performed on a 1.5 Tesla GE SIGNA scanner. Stacks of steady-state free precession cine images in the axial and short-axis planes were acquired for assessment of ventricular volumes and ejection fraction. End-diastolic and end-systolic volumes of both ventricles were calculated by planimetry at each level. Post-contrast images were obtained 6 min after gadolinium-based contrast injection to assess delayed myocardial enhancement. Flow quantification and calculation of ventricular volumes and ejection fractions were performed on cvi42 (release 5.3.4; Circle Cardiovascular Imaging).
RNA-seq.
Left ventricular RNA-seq in 16-week-old pigs was done at Stanford. Sequence reads were mapped to the S. scrofa domesticus genome using the Spliced Transcripts Alignment to a Reference (http://code.google.com/p/rna-star/) and annotation of TTN was further improved manually. For the detection of splicing events, the PSI was calculated based on inclusive and exclusive reads for each exon and tested with a Wilcoxon rank-sum test. For detecting differential expression events, gene level counts were fitted to negative binomial distribution and tested with the Wald test in DESeq2 (https://bioconductor.org/packages/3.11/bioc/html/DESeq2.html). Additional detail is available from H.S. (sunhanice@gmail.com) upon request. Left ventricular RNA-seq in 7-d-old pigs was done at Mayo Clinic and analyzed at the University of Texas Southwestern Medical Center. Differential expression analysis of 7-d RNA-seq samples was performed using the edgeR Bioconductor package (www.bioconductor.org). Differentially expressed genes were identified using a quasi-likelihood F-test with a false discovery rate of <0.05. Gene enrichment analysis was performed using the Enrichr enrichment analysis tool (http://amp.pharm.mssm.edu/Enrichr). Hierarchical cluster analysis was performed with log[counts per million] using Gene Cluster 3.0 (http://bonsai.hgc.jp/~mdehoon/software/cluster/software.htm) and visualized with Java TreeView (http://jtreeview.sourceforge.net). Additional detail is available from S.C.G. (sean. goetsch@utsouthwestern.edu) upon request.
Total protein quantification of myocardium from IHC slides.
Tissue sections were cut to a thickness of 10 μm into microfuge tubes and hydrolyzed in 6 M HCl at 95 °C overnight. Upon hydrolysis, colorimetric quantification was done using QuickZyme Biosciences protein assay in microtiter plates, per the manufacturer’s recommendations (www.quickzyme.com). The protein concentration was normalized to the tissue volume, calculated using parallel hematoxylin and eosin-stained sections, and analyzed by ImageJ.
Western blot of pig myocardium.
Tissue was homogenized in 1× cell lysis buffer (CLB; Cell Signaling Technologies) with protease inhibitor cocktail (Roche) and 1 mM phenylmethylsulfonyl fluoride. The protein concentration was quantified using a BCA Protein Assay Kit (Pierce) and equal protein amounts were loaded and run on Any kD precast polyacrylamide gels (Bio-Rad), transferred to a polyvinylidene difluoride membrane, blocked with 5% non-fat dry milk or 3% bovine serum albumin (BSA) and probed overnight with primary antibody. Blots were washed and probed with horseradish peroxidase-conjugated secondary antibody, washed, incubated in enhanced chemiluminescence reagent and visualized with the Odyssey imaging system (LI-COR Biosciences). Alternatively, a chromogenic alkaline phosphatase system with one-step nitro blue tetrazolium/5-bromo-4-chloro-3-indolyl phosphate on-membrane color development was used (Thermo Fisher Scientific). The antibodies used for blotting included rabbit anti-RBM20 (Novus; NBP1–91002), mouse anti-α-sarcomeric actin (Sigma–Aldrich; A2172), rabbit anti-phospho-histone H3 (Ser10) (Millipore; 06–570), rabbit anti-histone H3 (SCBT; sc-10809); mouse anti-sarcomeric myosin (DSHB; MF20) and mouse anti-FHL1 (SCBT; sc-374246).
B-isox affinity chromatography.
Tissue lysates in 1× CLB (Cell Signaling Technologies) containing protease inhibitor cocktail (Roche) and 1 mM phenylmethylsulfonyl fluoride were incubated with 100 μM B-isox (synthesized by D.E.F.; details upon request; doug.frantz@utsa.edu) and rotated at 4 °C for 90 min. Samples were centrifuged at 10,000g for 10 min at 4 °C. Supernatant was collected as input, and the pellet was washed twice with cold CLB, resuspended in sodium dodecyl sulfate polyacrylamide gel electrophoresis (SDS-PAGE) loading buffer, run on an Any kD precast polyacrylamide gel and stained with Coomassie blue (Thermo Fisher Scientific) or transferred for western blot. For proteomics, B-isox-bound proteins were run only 10 mm into SDS-PAGE gels, excised and cut into 1 mm cubes for analysis at the University of Texas Southwestern Proteomics Core. Protein enrichment was performed with the Database for Annotation, Visualization and Integrated Discovery (DAVID) Functional Annotation Clustering web tool (https://david.ncifcrf.gov/) using all targets with ≥2 peptide sequences. Additional details are available from S.C.G. (sean.goetsch@utsouthwestern.edu) upon request.
Pig ANP and BNP.
Plasma radioimmune assays for porcine ANP and BNP were performed using anti-human ANP or BNP antibodies and I125-labeled ANP or BNP (Phoenix Pharmaceuticals). Standard curves were generated and used to calculate the concentrations of the unknown samples, reported in pg ml−1. Additional details are available upon request from S.O. (saji.oommen@mayo.edu).
Molecular cloning.
The plasmid pcDNA6.2/N–EmGFP–RBM20R636S was obtained by replacing the SacI–Hindlll RBM20 fragment from pcDNA6.2/N–EmGFP–RBM20 (from M. G. Romanelli; mariagrazia.romanelli@univ.it) with the SacI–Hindlll RBM20 fragment containing the R636S mutation from pEGFP–C1–RBM20R636S (from W. Guo; wguo2@wisc.edu). The ΔN and ΔC pcDNA6.2/N–EmGFP–RBM20 plasmids were from M. G. Romanelli (mariagrazia.romanelli@univr.it).
Cardiomyocyte differentiation.
At the University of Texas Southwestern Medical Center, National Institutes of Health (NIH) Human Embryonic Stem Cell Registry-approved WA09 (H9) human embryonic stem cells (hESCs; passages 37–40), obtained from the WiCell Research Institute, were dissociated and seeded on Matrigel (Corning)-coated six-well plates in mTeSRl supplemented with 1 μM thiazovivin (Tocris). On day 0 (60–80% confluency), mTeSR was replaced with CDM3 (RPMI 1640, 200 μg ml−1 L-ascorbic acid 2-phosphate and 0.5 mg ml−1 human serum albumin) supplemented with 6 μM CHIR 99021 (Tocris) for 48 h and replaced with CDM3 supplemented with 2 μM Wnt-C59 (Tocris) for an additional 48 h, followed by CDM3 minus inhibitors with media changes every 48 h. On days 10 and 12, the media was replaced with RPMI minus glucose with B-27 supplement, and RPMI with glucose and B-27 every other day thereafter. On day 20, cardiomyocytes were dissociated with TrypLE Select (Thermo Fisher Scientific) for 30 min, filtered through a 70-μm cell strainer (Fisher) and plated on Matrigel-coated six-well plates at 3 × 10⁶ cells per well. Plasmid was transfected with Lipofectamine 2000 (Thermo Fisher Scientific) according to the manufacturer’s recommended procedures. For analysis, live cells were directly imaged with an EVOS FL Auto Imaging System (Thermo Fisher Scientific) or dissociated and plated on 12 mm Matrigel-coated coverslips for ICC.
Confocal and electron microscopy.
At the Mayo Clinic Microscopy and Cell Analysis Core, a Carl Zeiss LSM 780 confocal microscope with 40× W or 100× oil objectives and ZEN software image processing was used. Additionally, a JEOL JEM-1400 transmission electron microscope with an acceleration voltage of 40–120 kV and JENIE software was used.
ICC.
Coverslips were fixed with neutral buffered formalin for 15 min at room temperature, washed with phosphate-buffered saline (PBS)/0.05% Tween-20 and blocked (PBS/5% normal goat serum or 3% BSA/0.3% Triton X-100) at room temperature for 1 h. Diluted primary antibodies (PBS/1% BSA/0.3% Triton X-100) were incubated overnight at 4 °C, washed extensively and incubated with diluted secondary antibodies (1:400) at room temperature for 1 h, then DAPI stained for 10 min at room temperature. Coverslips were mounted on slides with ProLong Gold Antifade Mountant (Thermo Fisher Scientific) and stored at 4 °C. At the University of Texas Southwestern Medical Center, images were acquired with an EVOS FL Auto Imaging System and a Nikon A1R for confocal microscopy and a Nikon A1R N-SIM E module for super-resolution. Super-resolution reconstruction was done with NIS-Elements software and images were processed with ImageJ 1.5 or Zeiss ZEN Black. Antibodies and reagents for ICC included: ACTC1 (actin α-sarcomeric mouse mAb clone 5C5; Sigma–Aldrich), phalloidin (Alexa Fluor 568 conjugated; Invitrogen), Tub α-tubulin mAb 236–10501 (Invitrogen), Tub β-tubulin mAb clone AA2 (Sigma–Aldrich), TIAR (mouse mAb clone G-6; Santa Cruz), TIA (mouse mAb clone G-3; Santa Cruz), TDP-43 (mouse mAb clone E-10; sc-376311; Santa Cruz), ACTN2 α-actinin (mouse mAb clone EA-53; Sigma–Aldrich), RBM20 rabbit pAb NBP1–91002 (for pig sections) or NBP2–34038 (for human sections) (Novus) and G3BP1 (mouse mAb clone TT-Y; Santa Cruz).
Cell culture and sodium arsenite stress granule induction.
U2OS human osteosarcoma cells (HTB-96; American Type Culture Collection) were cultured in Dulbecco’s modified Eagle’s medium (DMEM) plus 10% fetal calf serum with antibiotics and transfected using a Lipofectamine 3000 Transfection Kit (Invitrogen). Metabolic stress was induced in U2OS cells or patient iPSC-CMs using NaAsO2 (Sigma–Aldrich).
Automated IHC of human and pig myocardium.
For RBM20 IHC, Novus NBP1–91002 (for pig sections) or Novus NBP2–34038 (for human sections) rabbit polyclonal antibodies were used with specific modifications to the protocol, as recommended by the supplier. Glass slide tissue sections cut to 5 μm from archived human control and patient (clinical details available upon request) and gene-edited pig formalin-fixed paraffin-embedded tissue blocks were obtained from the Mayo Clinic Histology Core. The slides were processed at Mayo Clinic utilizing a Dako Autostainer with the following protocol. Slides were warmed to 60 °C for 30 min, then deparaffinized and rehydrated through sequential incubations in xylene (twice for 5 min each), 100% ethanol (twice for 3 min each) and 95% ethanol (twice for 3 min each), then rinsed in cold running tap water for 2 min. Antigen retrieval was performed by incubation in a vegetable steamer with antigen retrieval solution, 1 mM ethylenediaminetetraacetic acid (EDTA; pH 8.0) or 10 mM citrate (pH 6.0) at ~95 °C for 30 min, then rinsed with dH2O and placed in 1× Dako Wash Buffer for up to 1 h, then blocked with Dako endogenous enzyme block (3% H2O2) for 5 min, rinsed with Dako wash buffer, pretreated with proteinase K or trypsin and re-rinsed, then exposed to primary antibody (1:200) for 30 min, then rinsed and exposed to secondary reagent Dako EnVision + anti-rabbit horseradish peroxidase for 20 min, followed by a buffer rinse, and incubated with substrate (Dako DAB+ K3468) for 5 min, then rinsed with water, counterstained with Immunostain’s Hematoxylin (Mayo Clinic’s chemical preparation) for 1.5 min, rinsed in running cold tap water for 2 min, dehydrated by sequential incubations in 95% ethanol (twice for 3 min each), 100% ethanol (twice for 3 min each) and xylene (twice for 5 min each), then mounted with Cytoseal under a 24 mm × 40 mm glass coverslip and allowed to dry for at least 30 min before viewing under a light microscope. A more detailed protocol for the Dako Autostainer is available upon request. Modifications for pig immunofluorescence IHC (done without the Dako Autostainer) included the following: heating the slides at 60 °C dry for at least 30 min before deparaffinization, then cooling them to room temperature for 30 min for antigen retrieval, blocked for 1 h at room temperature with 1× PBS/5% normal serum/0.3% Triton X-100, then exposed to primary antibody in 1× PBS/1% BSA/0.3% Triton X-100 overnight at 4 °C in a humidified container. For multiple primary antibodies, we used sequential staining (block > primary 1 > secondary 2 > primary 2 > secondary 2) and secondary antibody at 1:400, or followed the manufacturer’s recommendations for 1 h (minimum) to 2 h at room temperature, followed by washes with PBS with 0.1% Tween-20 and mounting under coverslips with ProLong Gold Antifade Mountant (Thermo Fisher Scientific). The most consistent results with human and pig tissue sections were obtained with Tris-EDTA buffer (10 mM Tris base, 1 mM EDTA solution and 0.05% Tween-20 (pH 9.0)) with microwave heat-induced epitope retrieval at 98 °C for 20 min.
Pig chromosomal FISH.
A ZytoLight porcine X/Y Dual Color Probe (Z-2094–200) was used for the detection of porcine chromosome X- and chromosome Y-specific sequences, following the supplier’s protocol (ZytoVision).
Human stem cell spinner culture differentiation into cardiomyocytes.
All human fibroblast-derived iPSCs were produced under a protocol covering ethics and informed consent approved by the Institutional Review Board at Mayo Clinic. Patient and control human iPSCs were maintained in mTeSR1 basal media with mTeSR supplement on plates coated with Geltrex (in DMEM/F-12 media). Undifferentiated human iPSCs were transitioned and expanded in suspension/spinner culture in DMEM/F-12 plus GlutaMAX, StemPro supplement, BSA and basic fibroblast growth factor with Rock Inhibitor Y27632 combined with mTeSR1 media, then chemically differentiated by Wnt inhibitor CHIR/IWP-4 treatment into cardiomyocytes in RPMI 1640 plus B-27 minus insulin supplement as beating aggregates using the detailed spinner culture protocol available from the authors (J.W.S.) or by contacting ReGen Theranostics (https://regentheranostics.com/). Differentiated hiPSC-CMs were maintained in Gibco Cardiomyocyte Maintenance Medium and attached to fibronectin-coated glass coverslips.
Poly-A RNA in situ hybridization.
Coverslips were fixed in neural buffered formalin for 15 min at room temperature, permeabilized with 100% ice-cold methanol for 10 min, rehydrated with 70% ethanol for 10 min and incubated in 1 M Tris (pH 8.3) for 5 min. 5′-labeled Cy5-Oligo-d(T)-30 stock (1 μg μl−1) was diluted 1:1,000 in hybridization buffer (2× SSC (sodium chloride-sodium citrate); 1 mg ml−1 yeast transfer RNA, 0.005% BSA, 10% dextran sulfate and 25% deionized formamide) and pipetted onto a CoverWell Incubation Chamber (Grace Bio-Labs). Coverslips were removed from Tris and inverted on to the hybridization buffer with a probe, sealed and incubated at 37 °C overnight. After hybridization, the coverslips were washed once with 4× SSC and once with 2× SSC, incubated in 2× SSC/0.01% Triton X-100/DAPI for 15 min, washed twice with 2× SSC and mounted onto a slide with ProLong Gold Antifade Mountant for imaging.
Mathematical analysis of striated patterning in cardiomyocytes.
We adapted a digital signal processing protocol for high-content analysis of hPSC-CMs assisted by The Scientist and Engineer’s Guide to Digital Signal Processing (https://www.dspguide.com/ch24/5.htm). Briefly, brightfield images of living GFP–RBM20 or GFP–RBM20R636S transfected H9 hESC-CM cells in six-well plastic dishes were acquired both with and without the GFP channel using an EVOS FL Auto microscope. Regions of interest (ROIs) that juxtaposed GFP–RBM20 or GFP–RBM20R636S RNP granule-positive and -negative H9 hESC-CMs were chosen and processed in NIH ImageJ 1.5 (https://imagej.nih.gov/ij/index.html) by (1) despeckling (a filter that enhanced the visibility of the native striated patterning by removing ‘salt and pepper’ noise); and (2) equalization (a filter that enhanced image contrast using histogram-based equalization). Individual cells within despeckled/equalized images were isolated by manually masking their surroundings coupled with edge smoothing to reduce edge artefacts. The uniform spatial and directional periodicity of striated patterning of individual masked and enhanced transfected or untransfected H9 hESC-CMs was visualized as a radial band or halo of increased intensity by FFT power spectrum analysis. To quantify the periodicity of striations, regression analysis was done using the radial profile of the FFT power spectrum, and a norm of residuals was calculated using Python 3 software (https://www.python.org/), providing a goodness-of-fit measurement for each cell. GFP-RBM20 or GFP-RBM20R636S RNP granule-positive H9 hESC-CMs demonstrated less uniform striated periodicity (consistent with cellular RNP granulopathy) by enhanced brightfield imaging, which mathematically corresponded to a lower radial band/halo intensity, lower residuals and a correspondingly better goodness of fit, yielding a reduced striation index. Conversely, untransfected control H9 hESC-CMs demonstrated highly uniform striated periodicity from myofibrils by enhanced brightfield imaging—a phenotype that corresponded mathematically with increased radial band intensity (an intense halo), higher residuals and a poor goodness of fit by regression analysis, yielding a high striation index. Thirty-one GFP-positive cells and 17 GFP-negative cells (48 in total) were analyzed using this algorithm, producing a statistically significant difference (P = 0.00018) in the striation index. ImageJ and Python 3 scripts are available from S.C.G. upon request.
FRAP.
U2OS cells were plated on 27-mm glass-bottom dishes and transfected with either enhanced GFP (EGFP)–RBM20R636S or enhanced yellow fluorescent protein (EYFP)–TIAl by Lipofectamine 3000 (Invitrogen). FRAP imaging took place 24 h post-transfection. Imaging was conducted with a Zeiss LSM 780 confocal microscope using ZEN 2.3 SP1 software. Live cells were imaged under physiologically stable conditions (37 °C and 5% CO2) using a stage-mounted incubation chamber. Cells were fixed in 4% paraformaldehyde for 15 min. Live EGFP–RBM20R636S, cells, live EYFP–TIA1 cells and fixed EGFP–RBM20R636S cells were bleached and imaged. The bleached region of interest (ROI) was centered in the middle of the granule and bleached with the 488- or 514-nm laser, for EGFP or EYFP, respectively, at 100% laser power for 15 consecutive iterations, with 177.32 μs pixel dwell, and a pinhole of 1 au. The FRAP imaging series consisted of five pre-bleach images followed by 135 post-bleach images taken at ~0.78-s intervals. Fluorescence recovery data were normalized using a background reference ROI and a whole-cell reference ROI to account for whole-cell photobleaching during image acquisition and focal drift. Normalization of data was calculated using the FRAP module provided within ZEN 2.3 SP1 software. A FRAP curve was generated for each group using a two-phase association nonlinear regression model within GraphPad Prism 8 software.
Statistical methods.
The results are presented as box and whisker plots representing the median, first and third quartiles and upper and lower maxima unless otherwise indicated. Two experimental groups were compared by Student’s t-test. Statistical analysis comparing the results of more than two experimental groups was done by one-way analysis of variance. Sample sizes (n values) are specifically defined in the figures and/or figure captions. Kaplan–Meier/log-rank analysis was employed in Fig. 2a. All statistical analyses were done using the SPSS statistical program and differences between groups were considered significant at P < 0.05.
Reporting Summary.
Further information on research design is available in the Nature Research Reporting Summary linked to this article.
Extended Data
Extended Data Fig. 1 |. Human RBM20-R636S germline genome editing strategy validated by cardiac MRI.
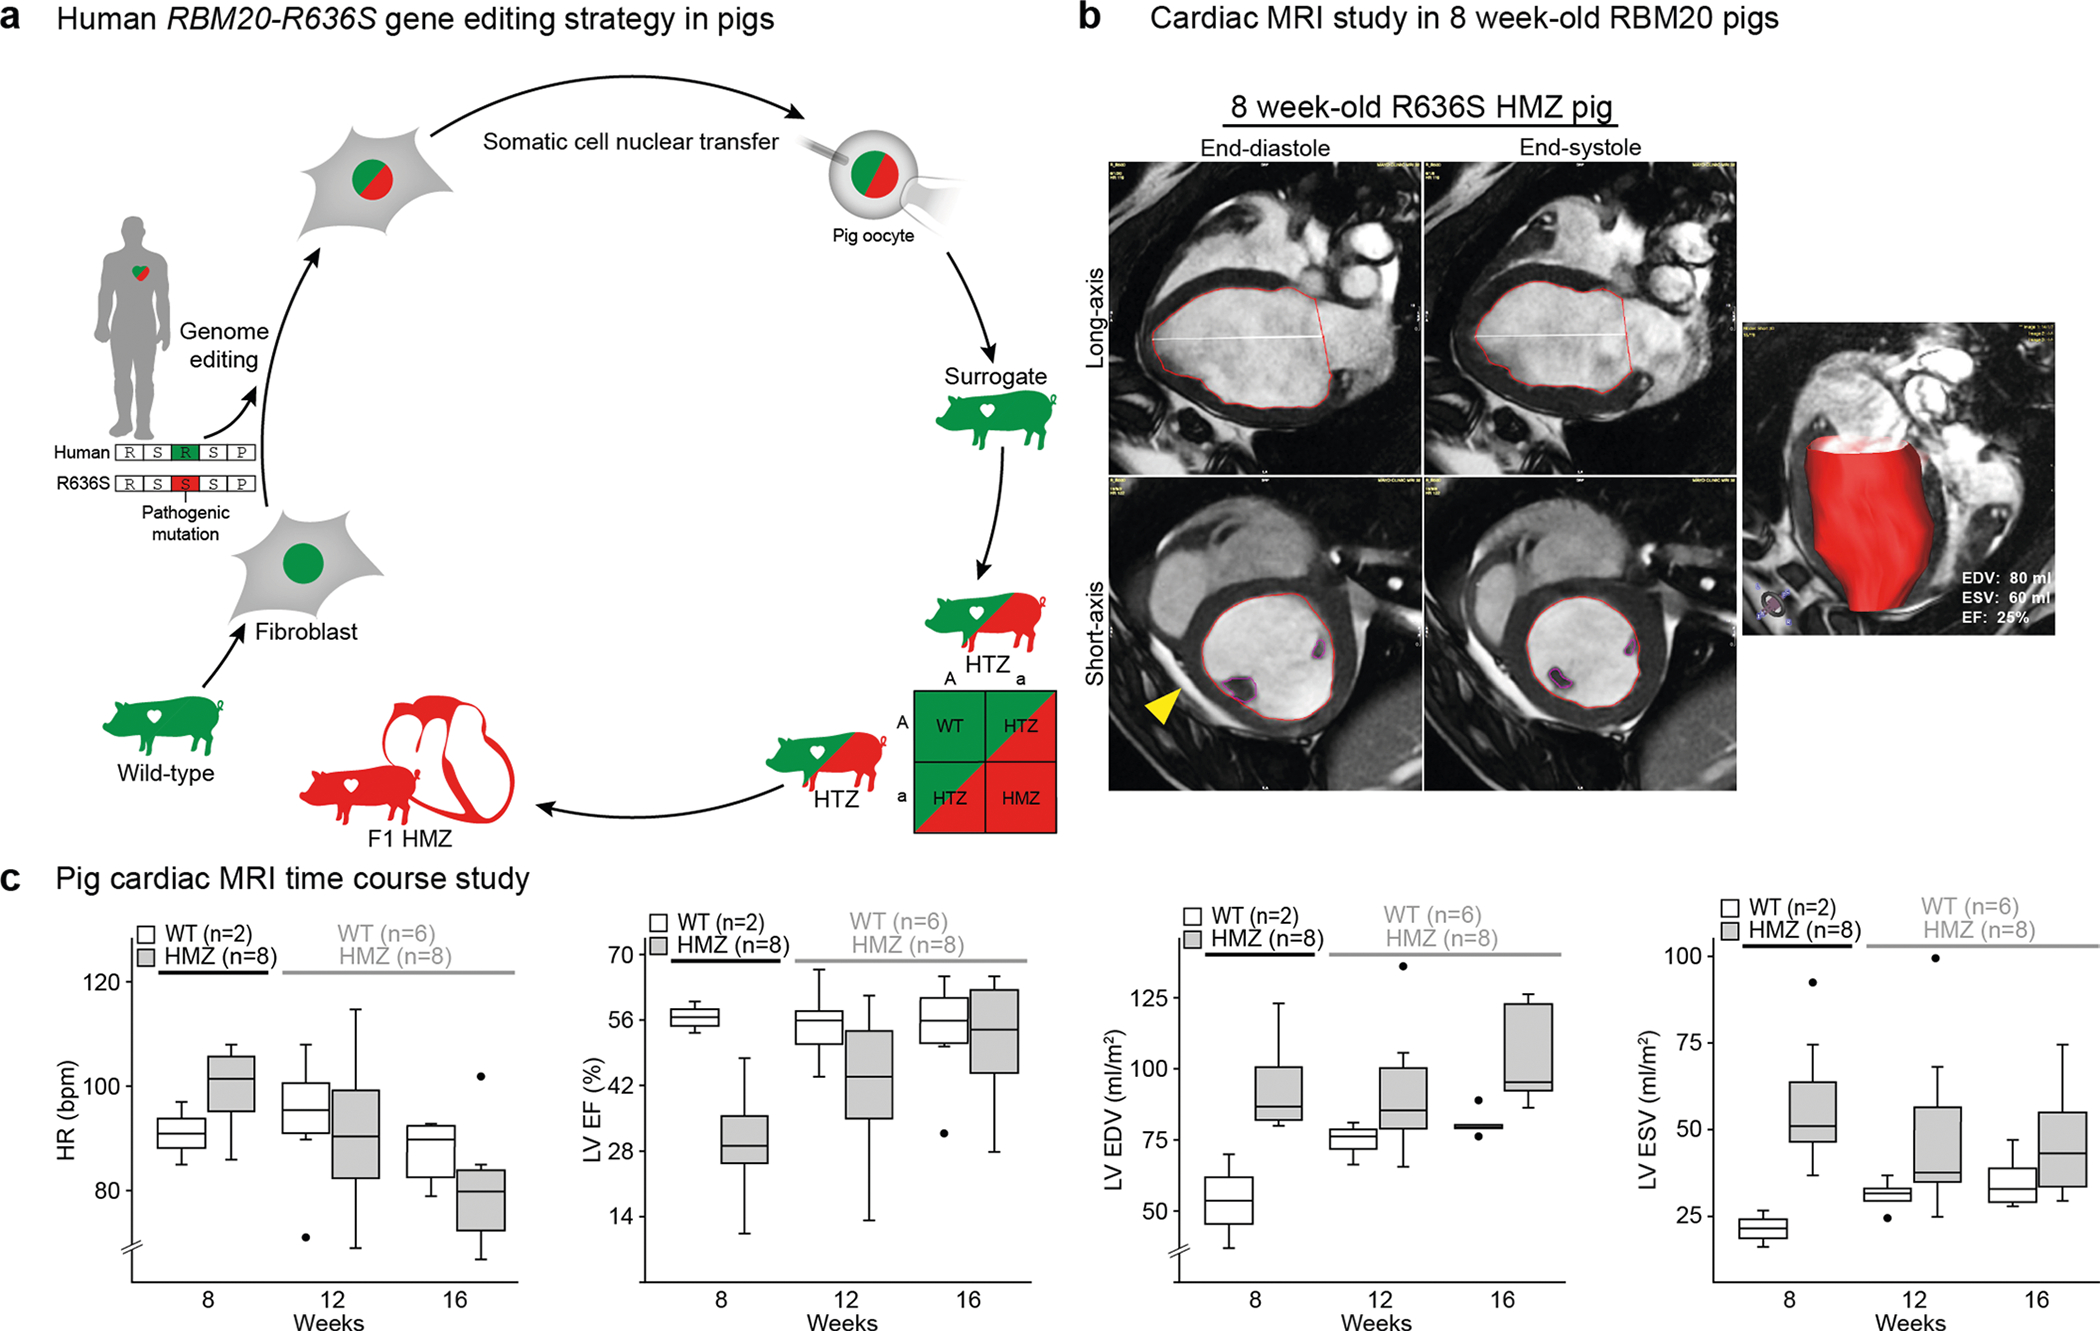
a, Cartoon depicting campaign to produce humanized R636S HTZ pigs by TALENs/HDR genome editing in WT pig fibroblasts followed by SCNT of gene-edited fibroblast nuclei into oocytes, implanted into surrogate sows. Crossbreeding of HTZ R636S germline gene-edited pigs produced HMZ F1 progeny with severe DCM/HF, the focus of this study. WT and R636S alleles signified by green and red color, respectively. A presentative piglet litter from this study is shown. b, Representative cardiac MRI images of 8 week-old HMZ pig showing end-diastolic and end-systolic frames in long and short axis with volumetrically calculated EF from ESV 60 ml and EDV 80 ml of 25% in this example. Yellow arrowhead, small pericardial effusion. c, Graph series comparing average heart rate (HR), calculated LVEF and corresponding LVEDV and LVESV (normalized to body surface area) by cardiac MRI at 8, 12 and 16 weeks of age in WT and HMZ pigs reported as median, Q1, Q3 and range with outliers as dots and n=number of individual pigs. Note that robust difference between WT and HMZ pigs at 8 weeks did not achieve statistical significance because of WT n=2 while later time points showed no statistical difference between WT and HMZ pigs. HMZ LVEDV increases with age but LVESV decreases even more explaining the normalization of LVEF, despite ventricular enlargement, in HMZ from 8 to 16 weeks.
Extended Data Fig. 2 |. Demonstration of endocardial fibroelastosis and abnormal sarcomere organization in HMZ gene-edited pigs.
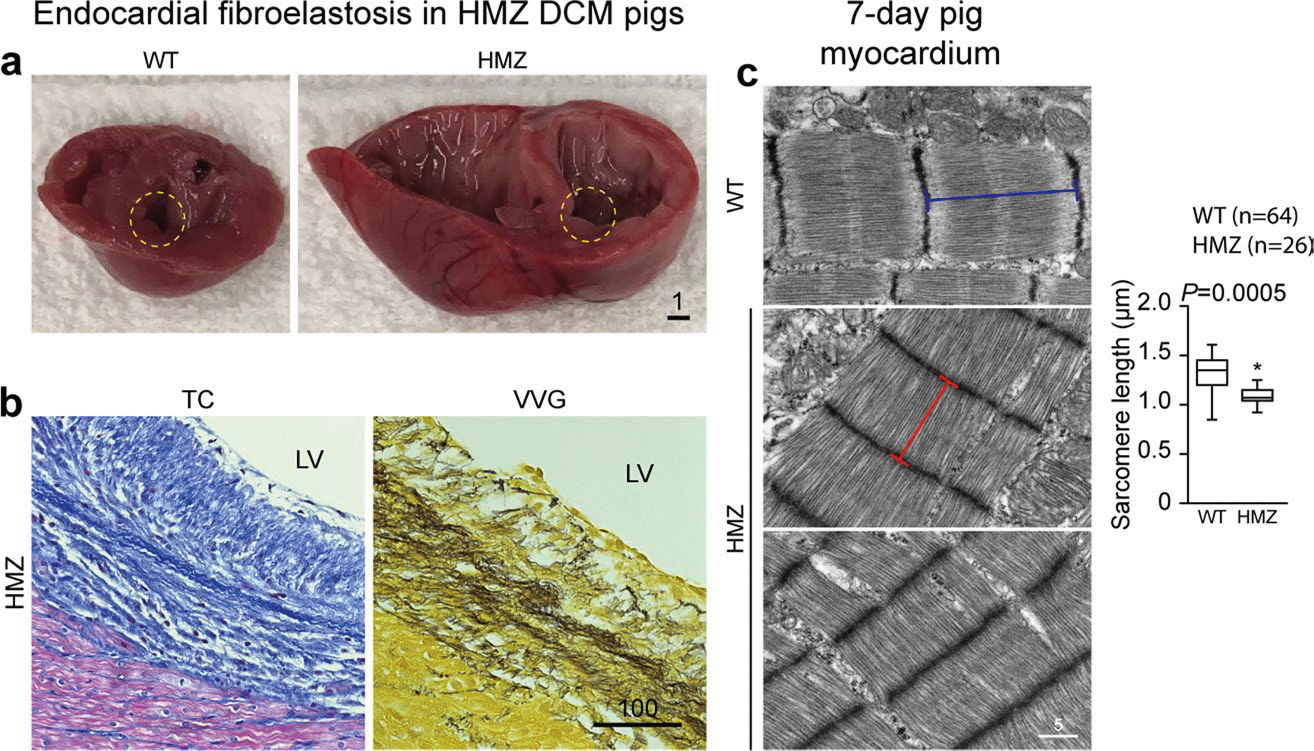
a, Gross anatomical apical segments of same hearts in (Fig. 1g) showing endocardial fibroelastosis (circled area, whitish layer) in dilated HMZ but not WT heart at postnatal day-3. Scale bar, cm. b, Study of highly focal and HMZ-specific endocardial fibroelastosis, as in circled area (Extended Data Fig. 2a) above, by Masson’s trichrome and Verhoeff-Van Gieson’s histochemical staining. Scale bar, μm. c, TEM study comparing sarcomere striation patterns in WT (upper panel) versus HMZ (middle and lower panels) 7-day pig myocardium and graph of measured Z-disc to Z-disc intervals demonstrating shorter sarcomere length and swollen Z-discs consistent with impaired myofibril biogenesis in HMZ versus WT pig myocardium. Scale bar, μm.
Extended Data Fig. 3 |. Decreased postnatal mitotic cell cycle activity and TEM survey in HMZ pig myocardium.
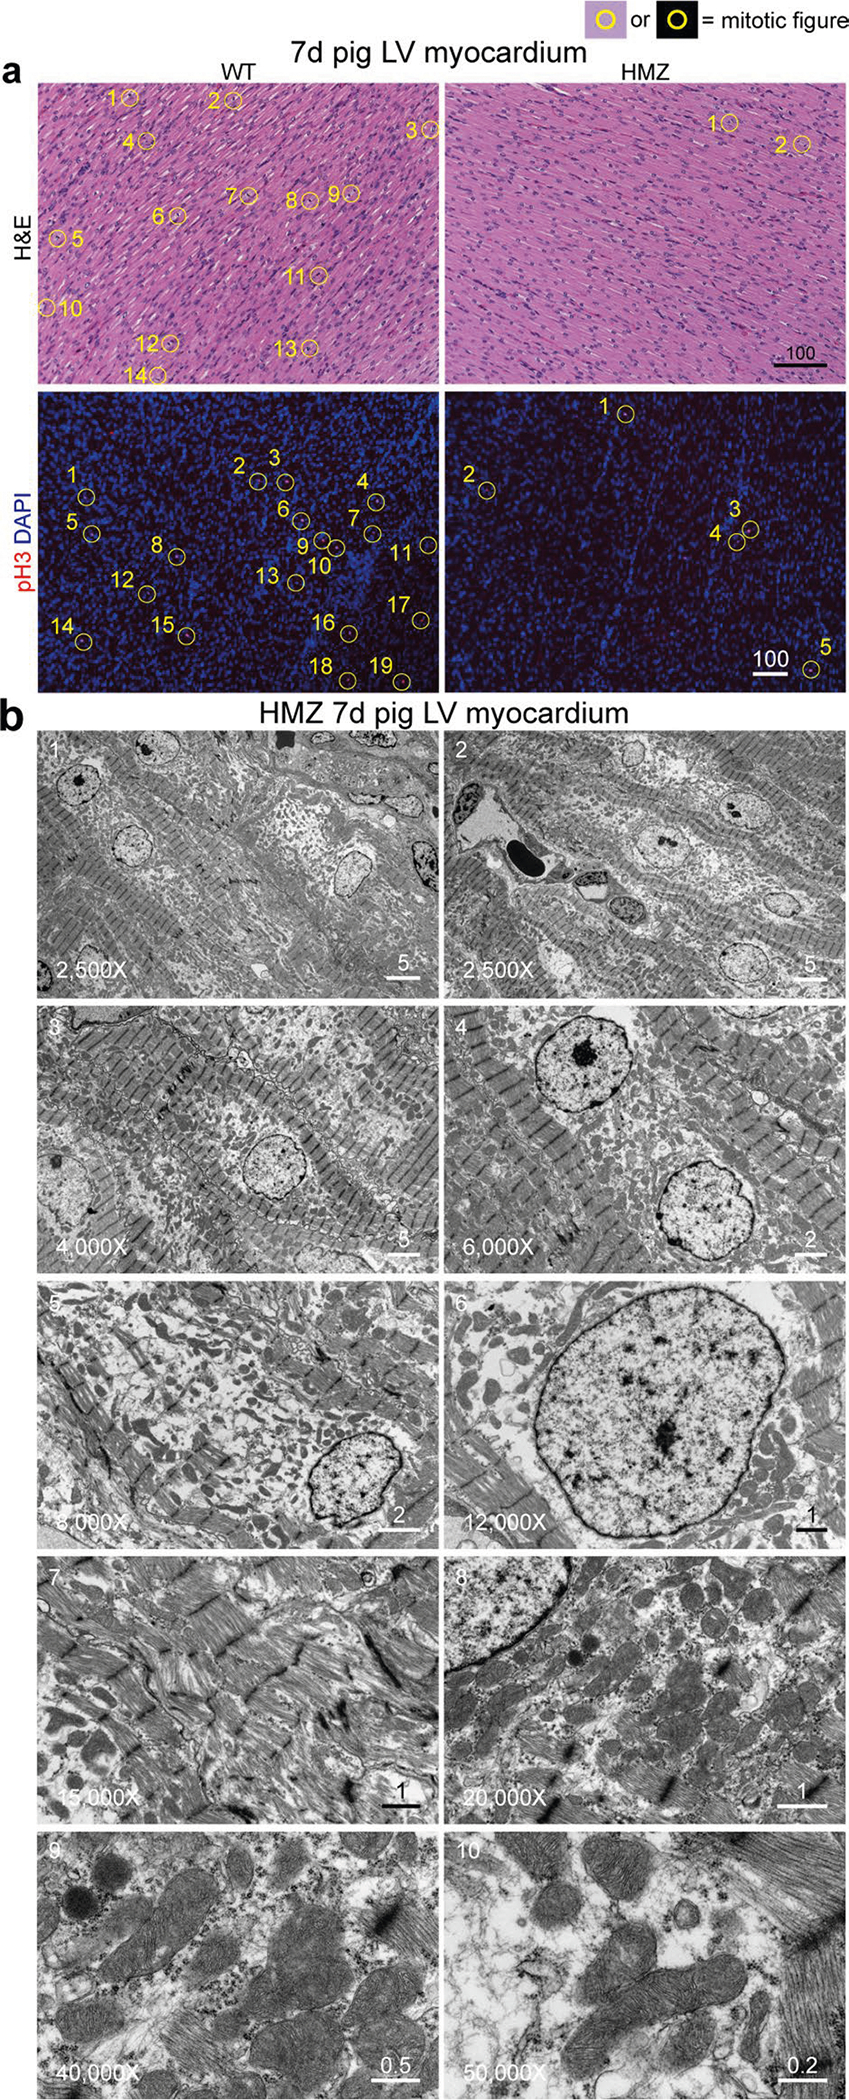
a, Analogous to (Fig. 1i), upper panels compare LV myocardial proliferative activity in WT and HMZ pigs at day-7 assessed by condensed chromatin/mitotic figures by H&E histochemical staining (upper panels) or pH3 F-IHC with DAPI co-stain (lower panels), individual mitotic figures highlighted by yellow circles. These results are representative of multiple repeat experiments in different animals. Scale bars, μm. b, Survey of HMZ pig myocardium at day-7 by TEM at increasing magnification from top to bottom, 2,500X-to-50,000X, respectively, highlighting multifaceted ultrastructural cellular pathology. Scale bars, μm.
Extended Data Fig. 4 |. Pathological hypertrophy, polyploidy and abnormal mitochondria in HMZ pig myocardium.
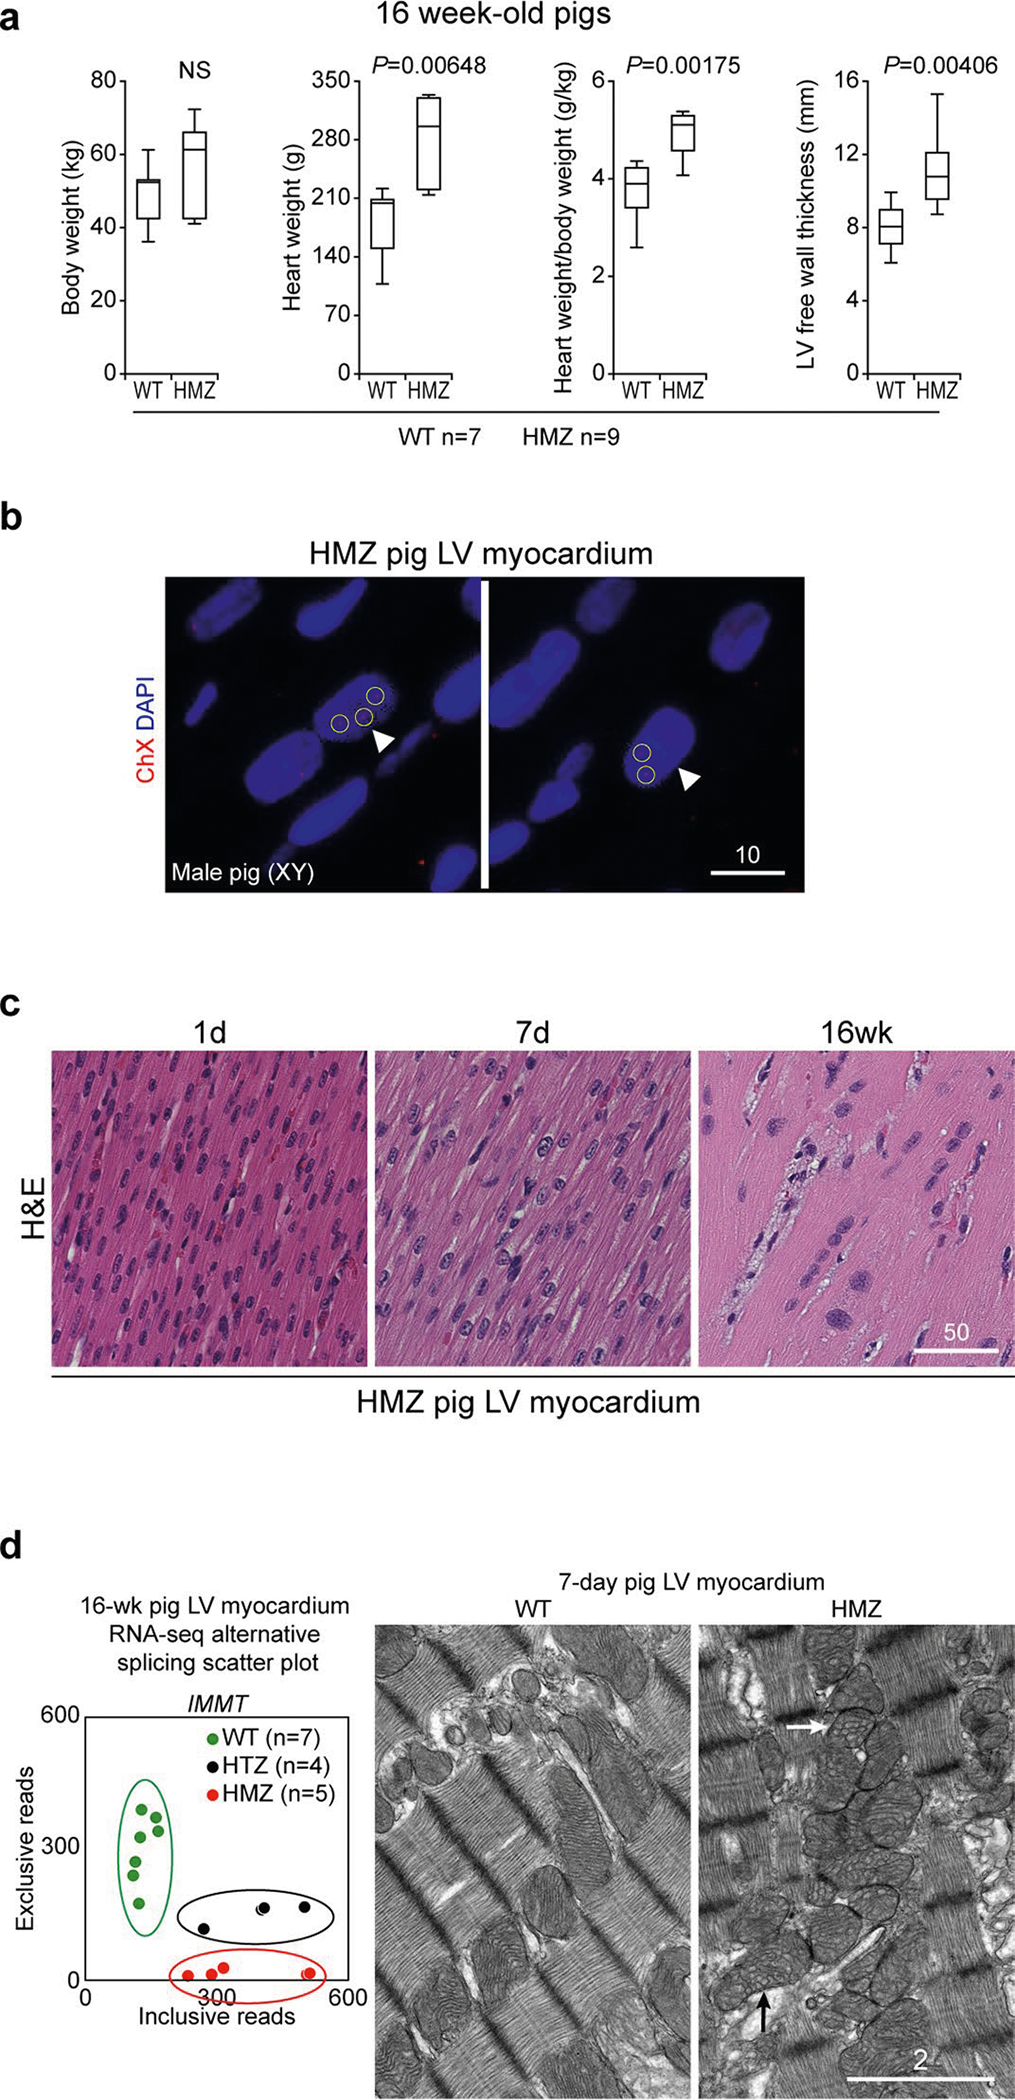
a, Graphical comparison of body weight, heart weight, heart weight/body weight ratio and LV free wall thickness (hypertrophy) in WT and HMZ pigs at 16 weeks of age reported as graphs showing median, Q1, Q3 and range. N=number of individual pigs studied and significance calculated by two-sided Student’s t-test. b, Fluorescence in situ hybridization (FISH) for pig X-chromosome in HMZ male (XY) pig myocardium. Yellow circles highlight X-chromosome signals in nuclei with greater than diploid (one dot) genomic DNA content. This result is representative of three repeat FISH studies. Scale bar, μm. c, Time course study of H&E stained HMZ pig LV-myocardium at day-1, day-7 and 16-weeks highlighting progression of pathological hypertrophy, nuclear abnormalities, cellular disarray and fibrosis. Scale bar, μm. d, Analogous to heat map data presented in Fig. 2g (see blue arrow), RNA-seq alternative splicing scatter plot analysis of IMMT (mitofilin) comparing WT (green), HTZ (black) and HMZ (red) pig myocardium at 16 weeks, clustered dots (circled) highlight genotype-specific alternative splicing of IMMT pre-mRNA, n=number of individual pigs. Right hand panel, correlating with IMMT missplicing, TEM comparing mitochondrial ultrastructure highlighting abnormally shaped cristae (arrows) in HMZ versus WT myocardium at day-7 by TEM, with similar myocardial mitochondrial morphological abnormalities observed in three different HMZ piglets. Scale bar, μm.
Extended Data Fig. 5 |. Sarcoplasmic misaccumulation of RBM20-R636S in inherited RBM20-DCM and splicing speckle amplification in ischemic DCM.
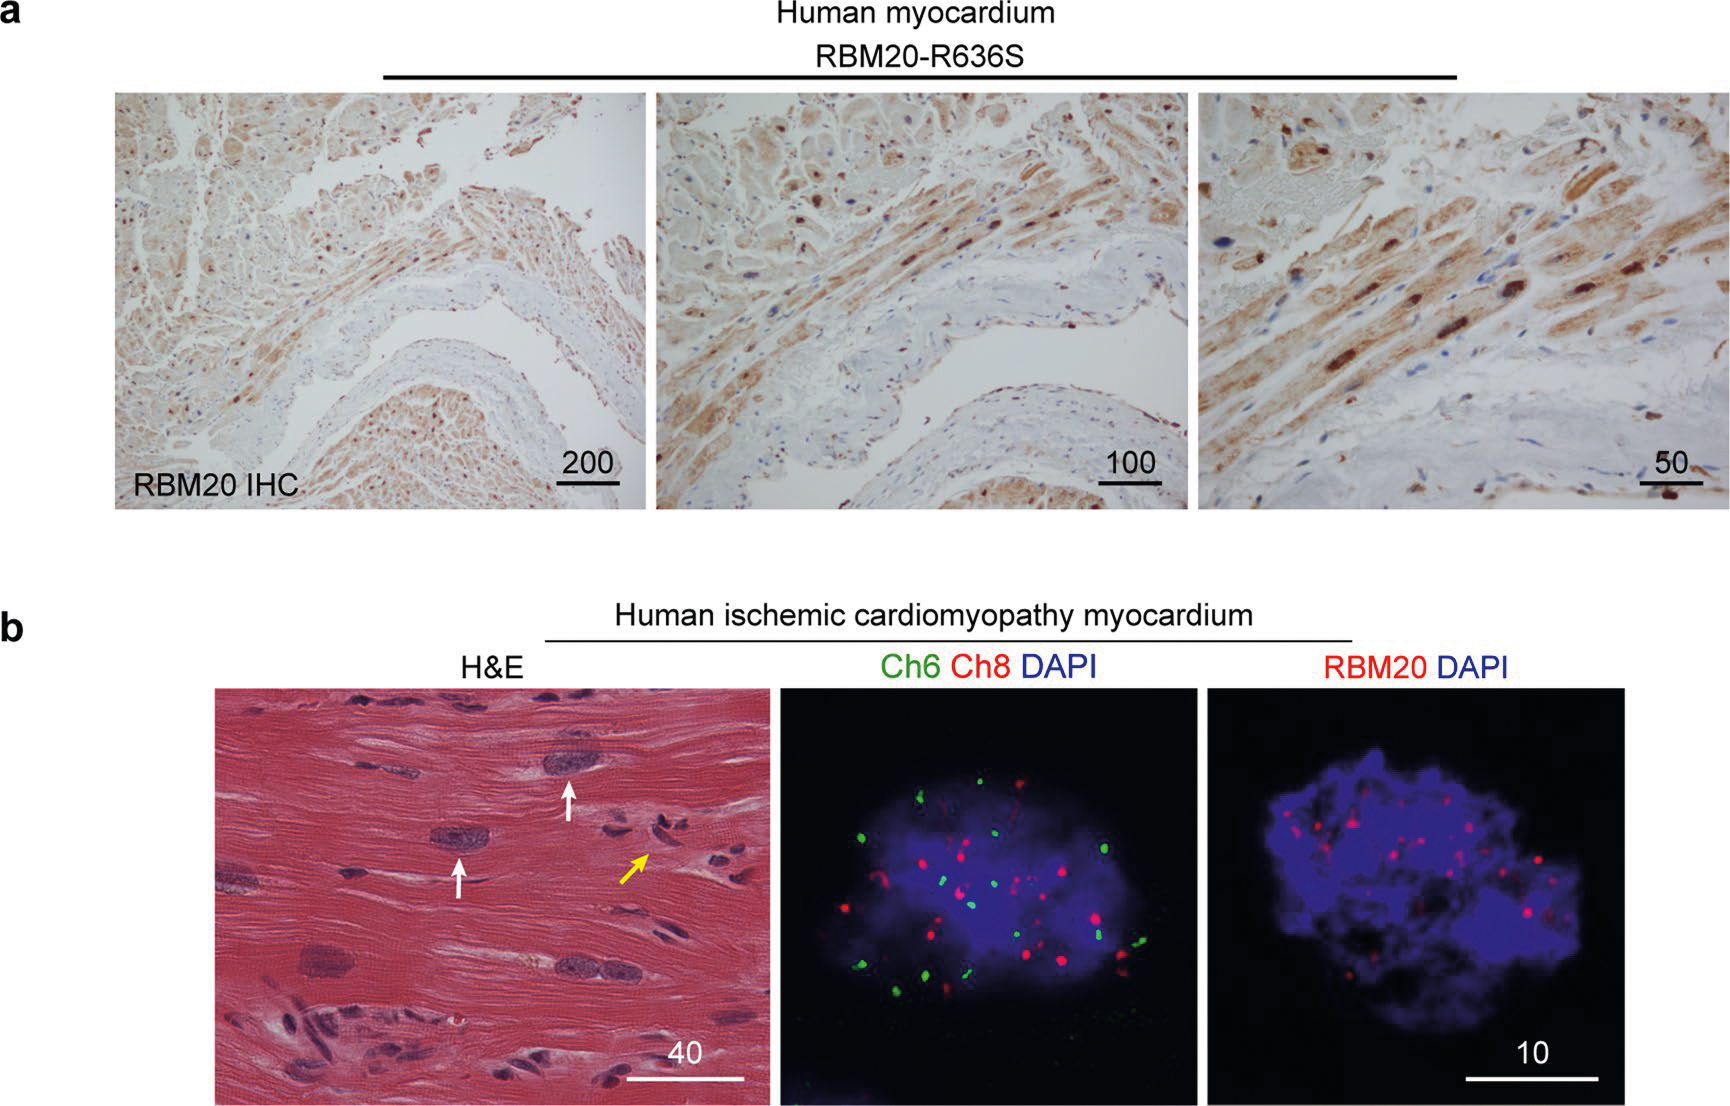
a, Expanded views of (Fig. 3a, third panel) demonstrating RBM20 IHC at increasing magnification power (10x, 20X and 40X) highlighting intense sarcoplasmic and nuclear expression in myocardium of DCM patient, an R636S mutant allele carrier, analogous to the HTZ gene-edited RBM20 pig (Fig. 1c, central panel). Automated IHC repeated three times in this patient’s myocardium yielded results. Scale bars, μm. b, Human end-stage ischemic cardiomyopathy myocardium stained by H&E histochemistry (left hand panel) comparing size of cardiomyocyte nuclei (white arrows) to non-cardiomyocytes (yellow arrow), FISH for human chromosomes 6 (green) and 8 (red) with DAPI highlighting advanced HF-associated polyploidy (central panel) and, correspondingly, amplification of transcriptionally-active RBM20 nuclear splicing speckles, each demonstrating a TTN gene locus on a human chromosome 2 by IF-IHC (right hand panel). Each result is representative of experiments repeated three times. Scale bars, μm.
Extended Data Fig. 6 |. Sarcoplasmic RBM20-R636S rosary beads compared with TDP-43 myo-granules in RBM20-DCM myocardium.
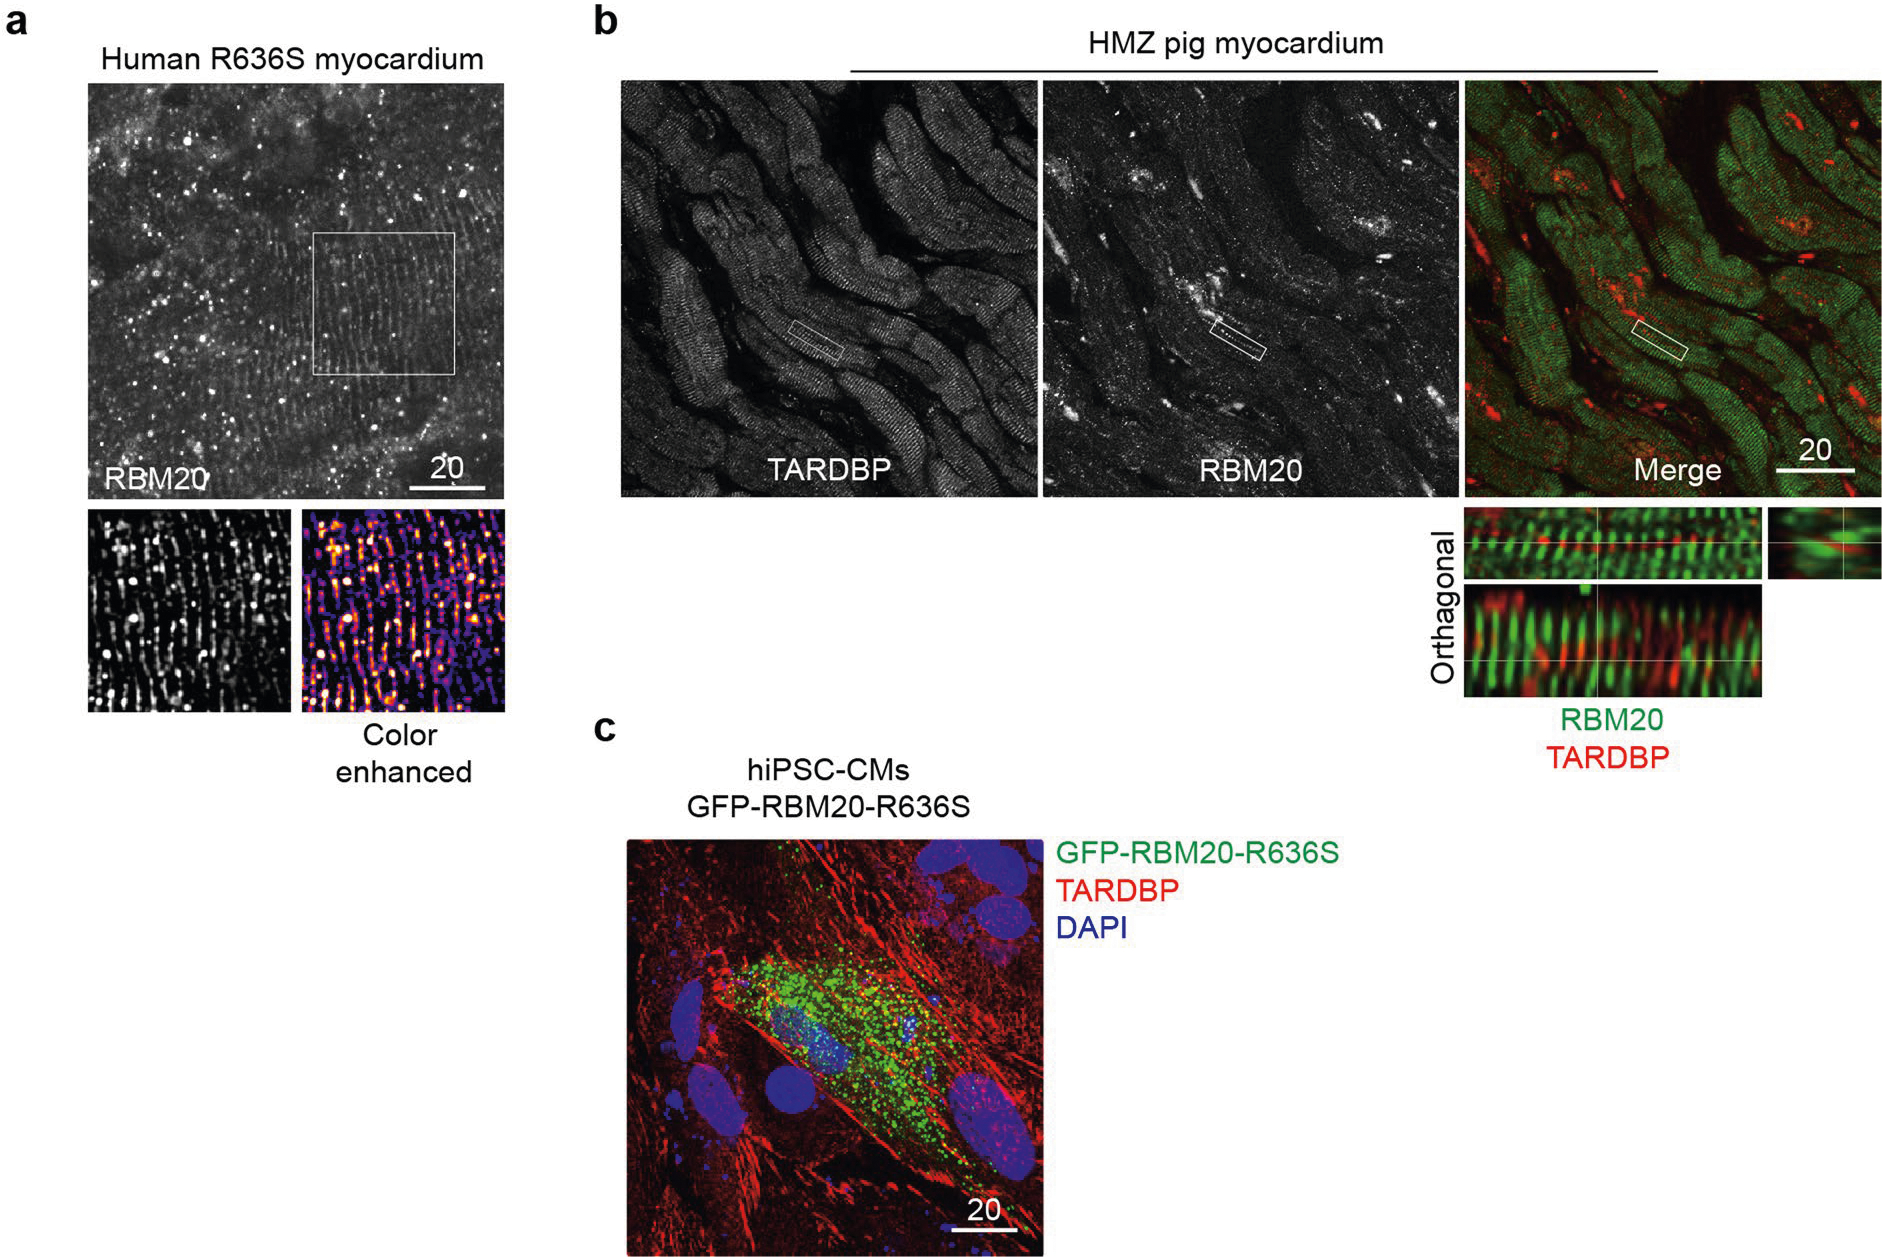
a, Expanding on the results shown in (Fig. 3c), RBM20 IF-IHC confocal microscopy of human RBM20-DCM myocardium highlighting rosary beads-on-a-string staining pattern when confocal plane is focused on sarcomeres in longitudinal orientation. Repeated three times, this experiment produced identical results. Scale bar, μm. b, Double IF-IHC confocal microscopy for TARDBP (TDP-43), the driver of myo-granules in skeletal muscle, and RBM20 in HMZ pig myocardium highlighting distinctive (non-coincident) linear staining patterns of these two RNA-binding proteins. Repeated three times, this experiment produced identical results. Scale bar, μm. c, Corroborating the results observed in (b) above, GFP-RBM20-R636S transfected human iPSC-CMs highlighting distinctive fibrillary TARDBP by ICC and droplet-like RBM20-R636S RNP granules by confocal microscopy. Scale bar, μm.
Extended Data Fig. 7 |. RBM20-R636S liquid droplets reconstructed by recombinant protein expression in U2OS cells.
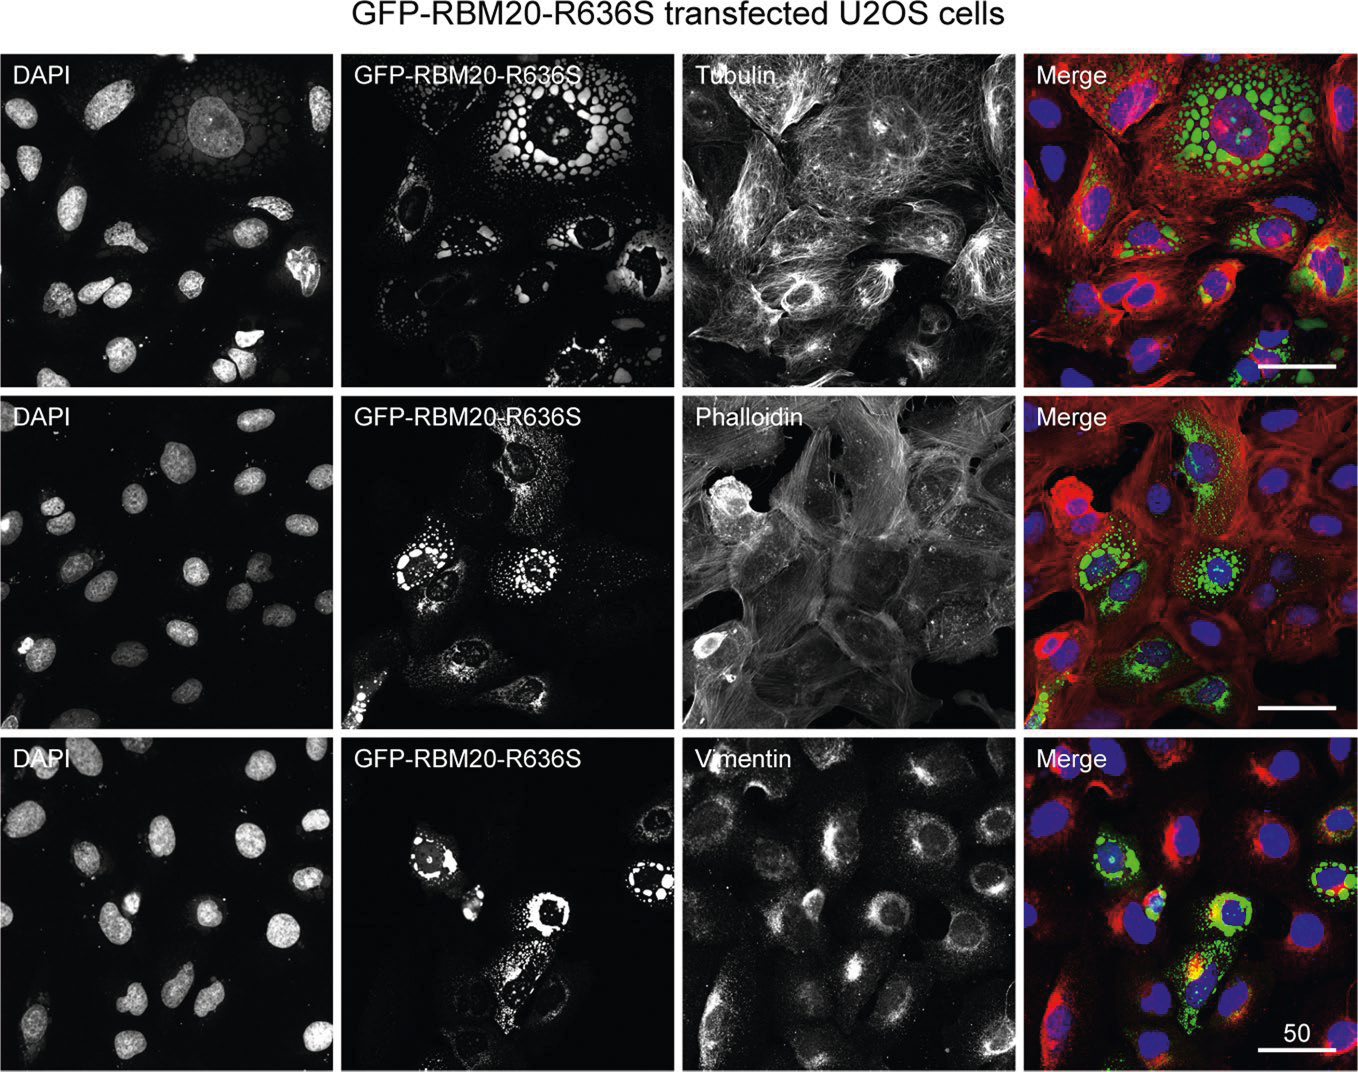
Transfection of GFP-RBM20-R636S in U2OS cells co-imaged with DAPI and ICC for cytoskeletal elements, microtubules (α-tubulin), F-actin microfilaments (phalloidin) or intermediate filaments (vimentin), highlighting the liquid behavior of GFP-RBM20-R636S droplets “beading-up” and fusing caused by the nuclear envelope’s surface tension. Experiment repeated numerous times with identical results. Scale bars, 50 μm for all panels.
Extended Data Fig. 8 |. RBM20-R636S RNP granules (R3Gs) at confocal microscopy super-resolution, laden with mRNA and associated with cytoskeletal elements in iPSC-CMs.
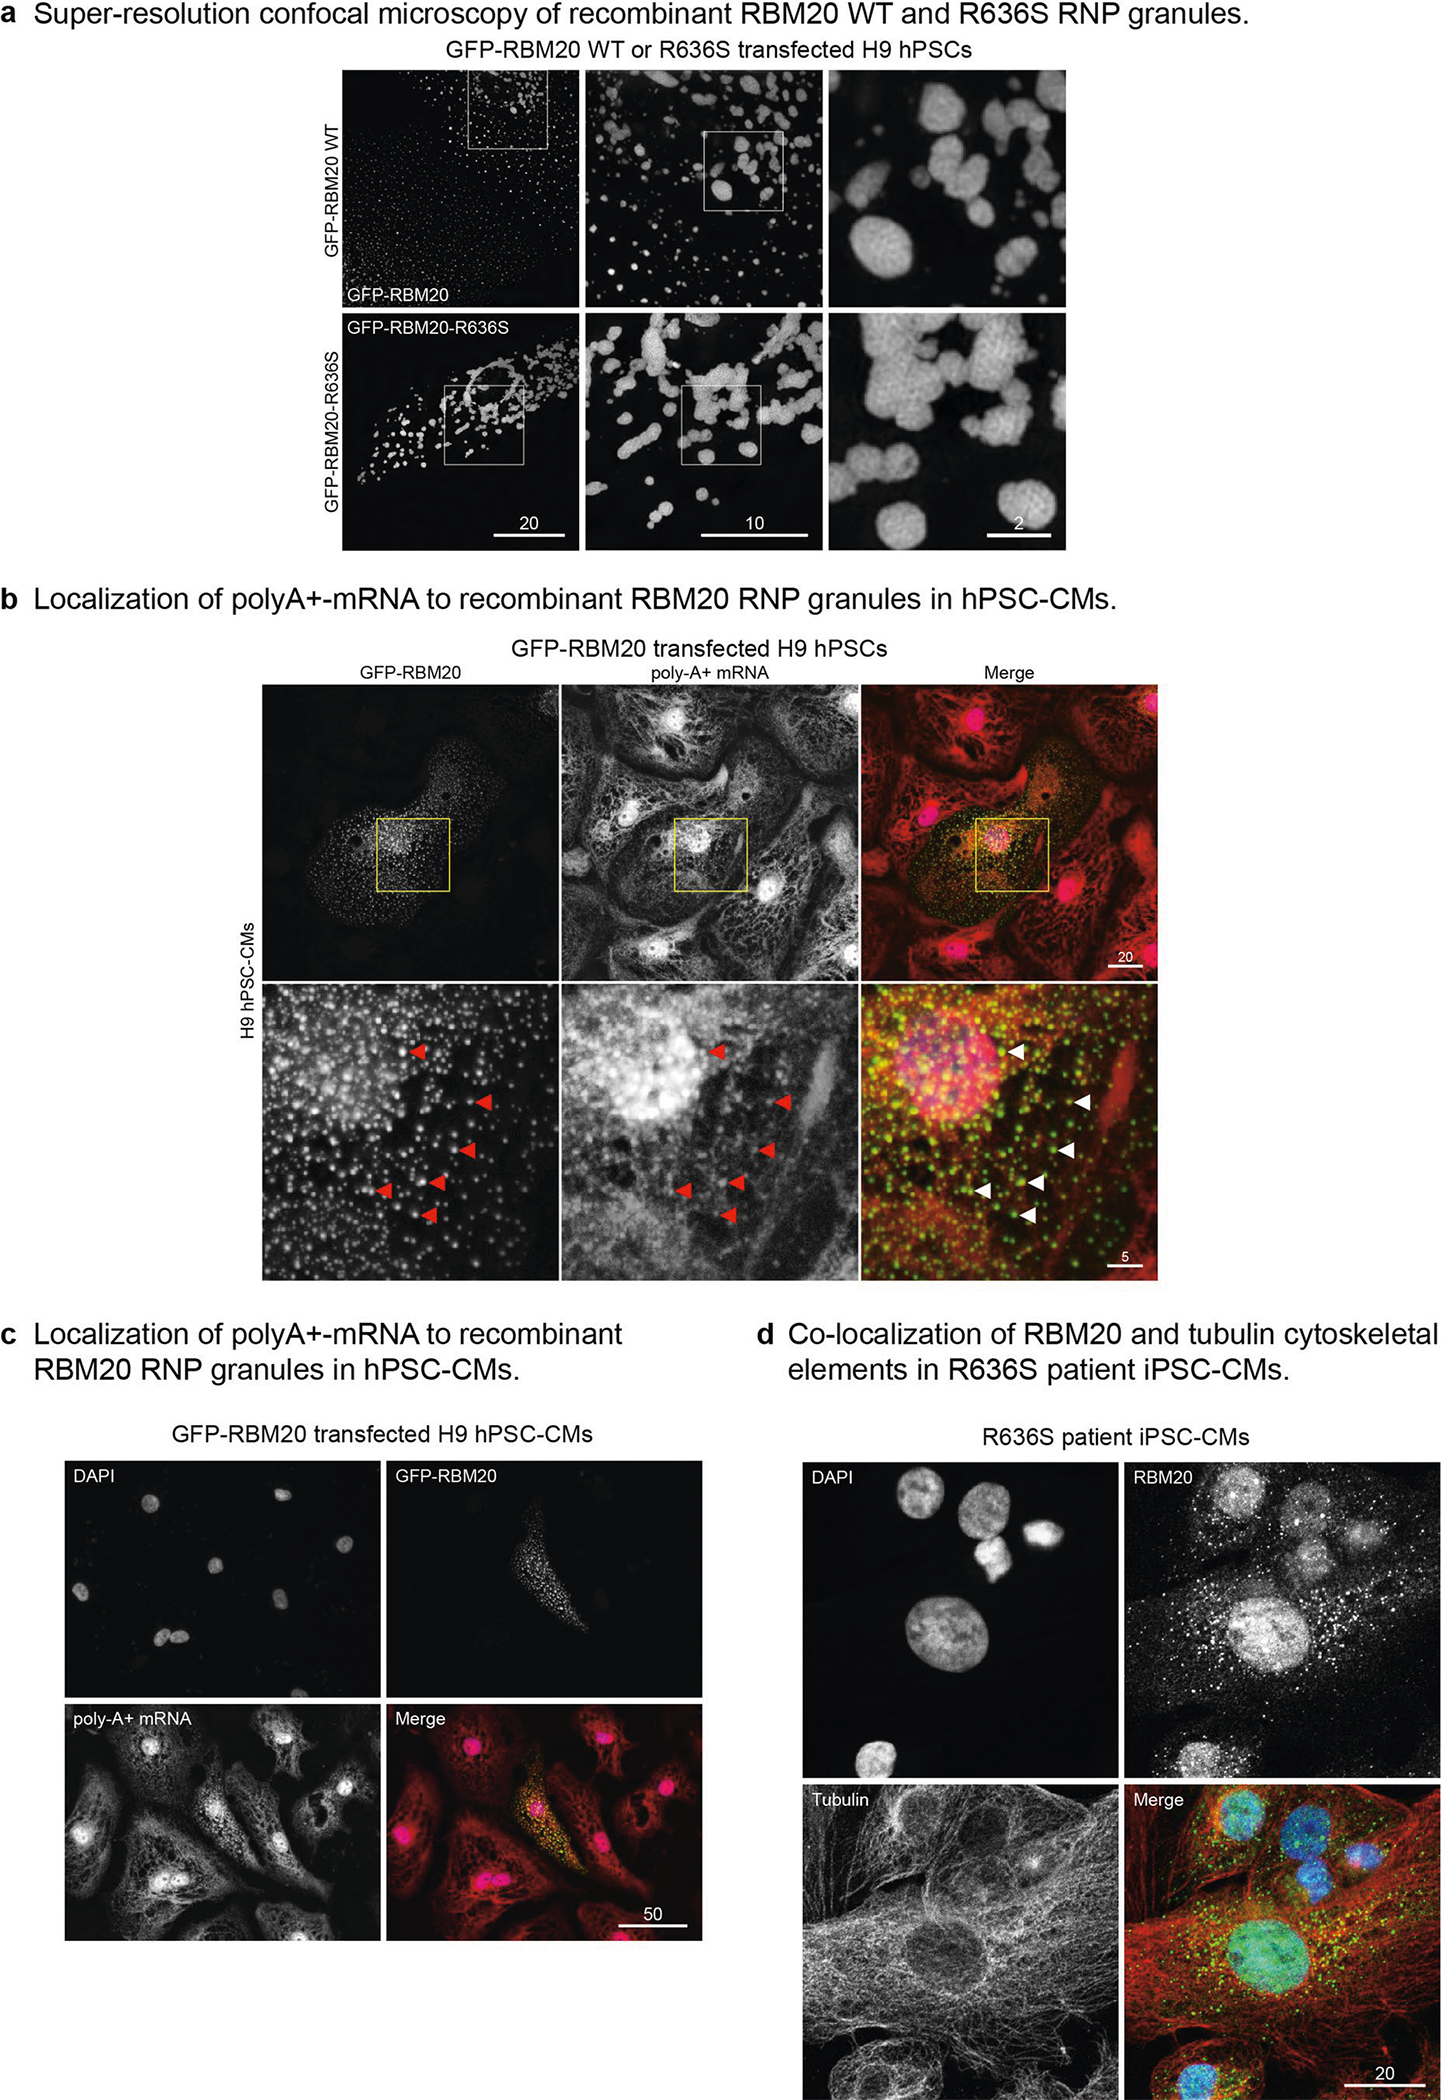
a, Additional images of GFP-RBM20 WT (upper panels) and GFP-RBM20-R636S (lower panels) R3Gs by super-resolution confocal microscopy, at increasing magnification from left-to-right, demonstrating SG-like stable core and dynamic shell sub-structural organization. Experiment repeated three times with identical results. Scale bars, μm. b, Additional image panel depicting poly-A+ mRNA FISH in GFP-RBM20 transfected hPSC-CMs demonstrating co-localization of mRNA signal with RBM20 RNP granules (in this case “overflow” RBM20 WT granules) in CM sarcoplasm. Scale bars, μm. c, Another example as in (b above). Three independent poly-A+ mRNA FISH plus RBM20 ICC co-localization experiments produced identical results. Scale bar, μm. d, Co-linearity of R3Gs and α-tubulin signal in R636S patient-derived iPSC-CMs suggesting association of R3Gs with microtubules in these cells. Similar results obtained in three independent ICC experiments, see (Fig. 6c) for TUBB co-staining. Scale bar, μm.
Extended Data Fig. 9 |. B-isox affinity chromatography evidence of ACTC1 associated with R3Gs in HMZ myocardium and R3G antagonized SG assembly in U2OS cells.
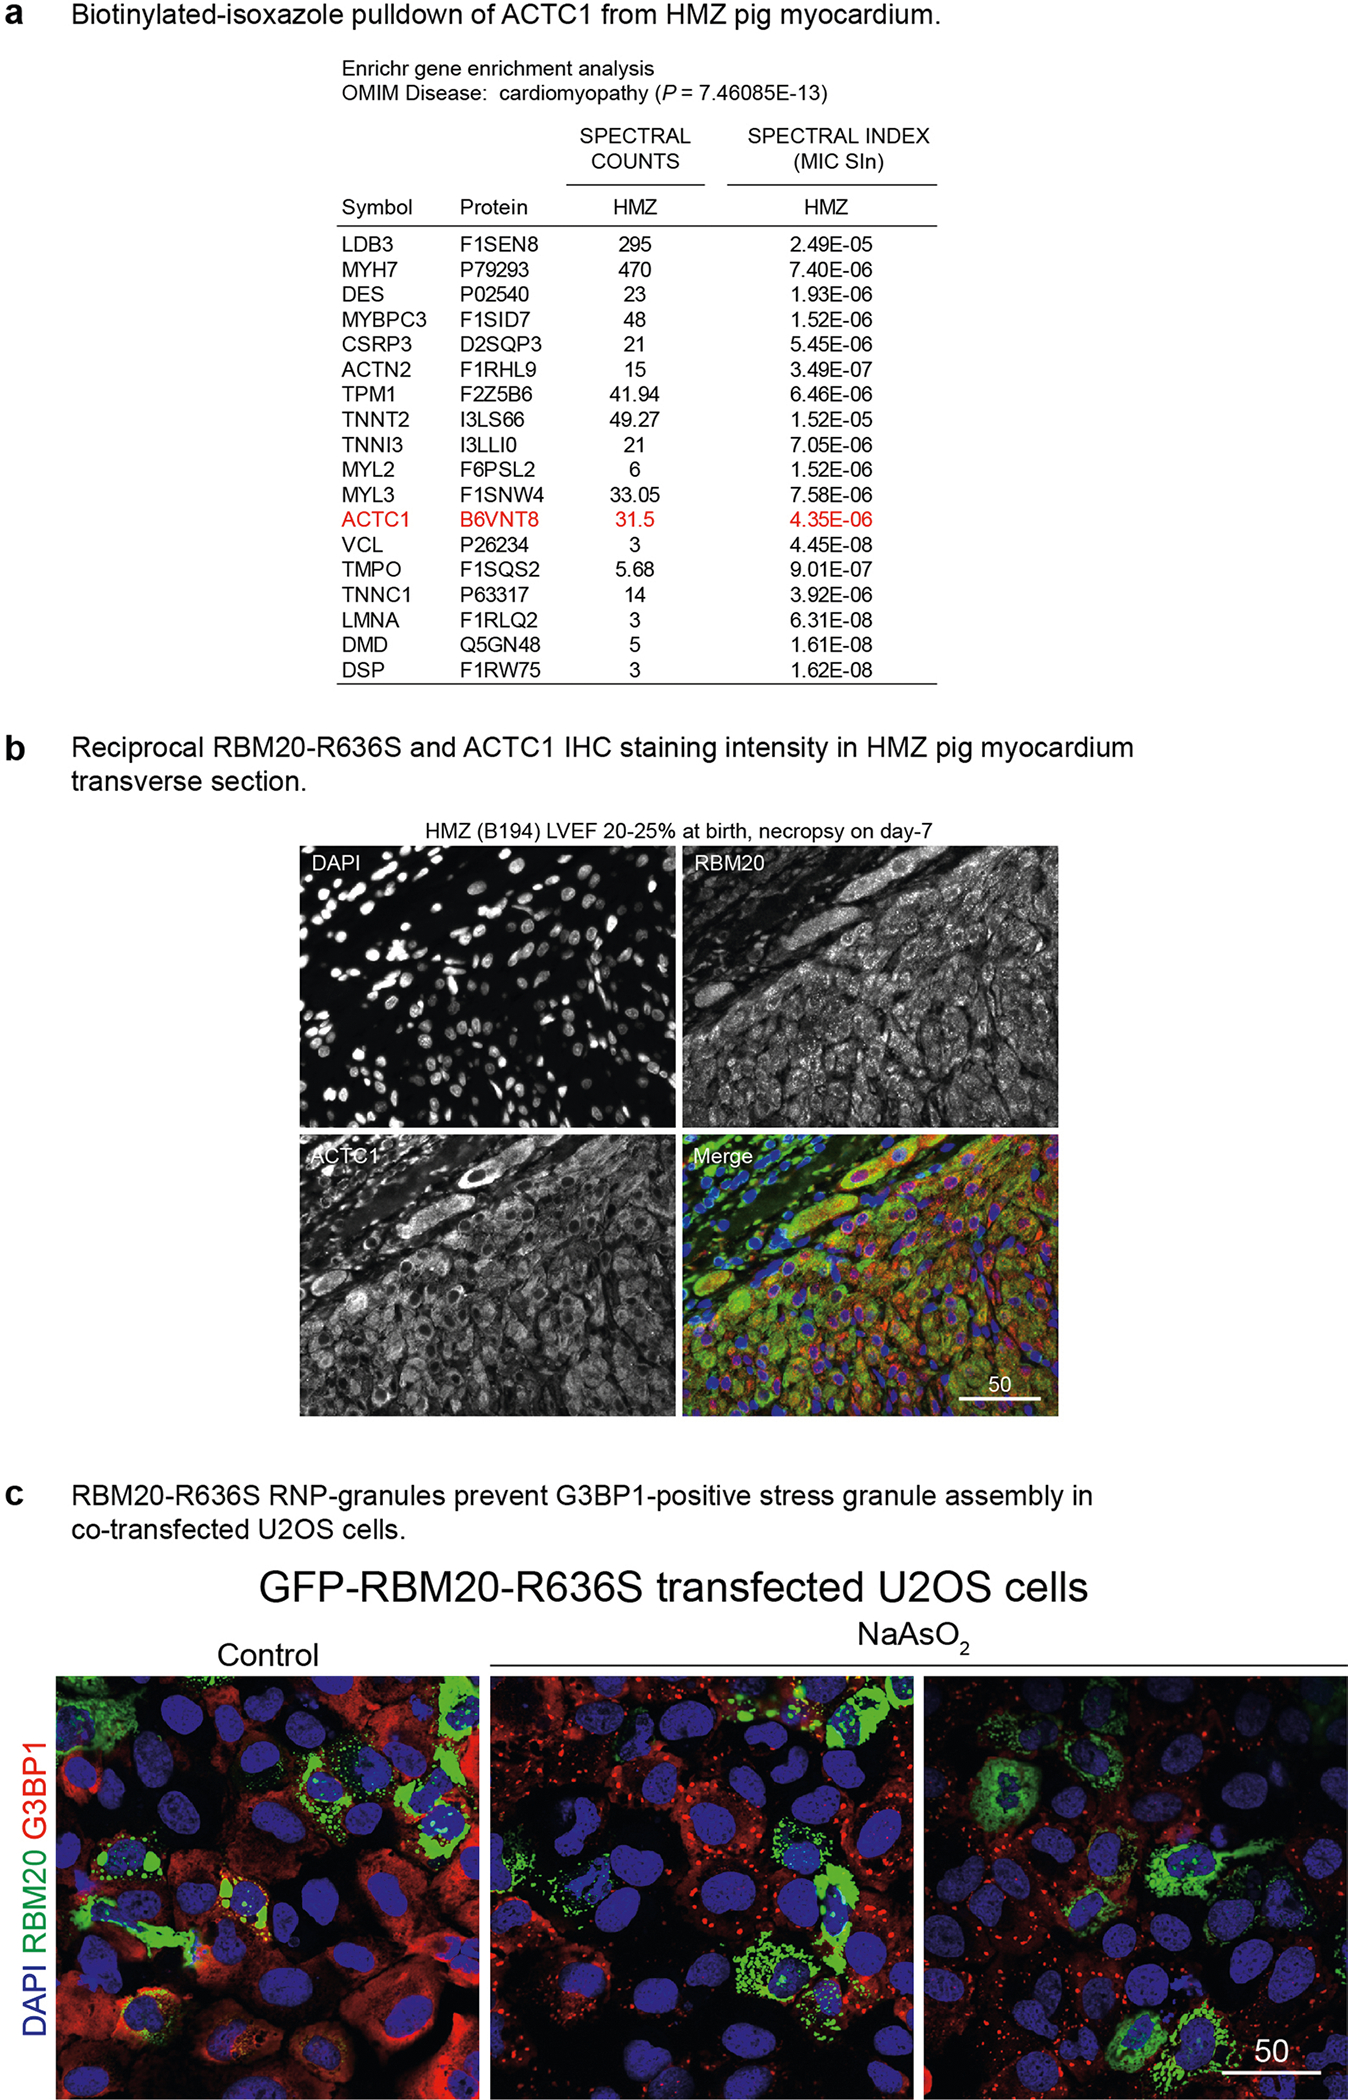
a, B-isox affinity chromatography proteomics demonstrating cardiomyopathy gene enrichment analysis and specifically ACTC1 pulldown from R3G-laden HMZ gene-edited pig myocardium, see (Fig. 4d, e). Repeated three times, this experiment consistently produced similar results. Proteomics statistical analysis as described in (Fig. 4d legend). b, Double IHC for RBM20 and ACTC1 in 7-day HMZ pig myocardium in transverse section confirming reciprocal staining intensity of R3Gs and ACTC1, see (Fig. 6a) for analogous longitudinal sections. This myocardial IHC experiment repeated in three different HMZ piglets produced identical results. Scale bar, μm. c, GFP signal and SG marker, G3BP1, by ICC with DAPI in NaAsO2 treated GFP-RBM20-R636S transfected U2OS cells, demonstrating that cells expressing R3Gs fail to construct G3BP1 SGs, consistent R3G sequestration of G3BP1, a protein critical for SG assembly. Similar results observed in multiple independent U2OS cell transfection ICC experiments. Scale bars, μm.
Extended Data Fig. 10 |. Workflow for FTT analysis of GFP-RBM20 transfected hPSC-CMs and model of the liquid droplet organizational logic of cardiomyocytes.
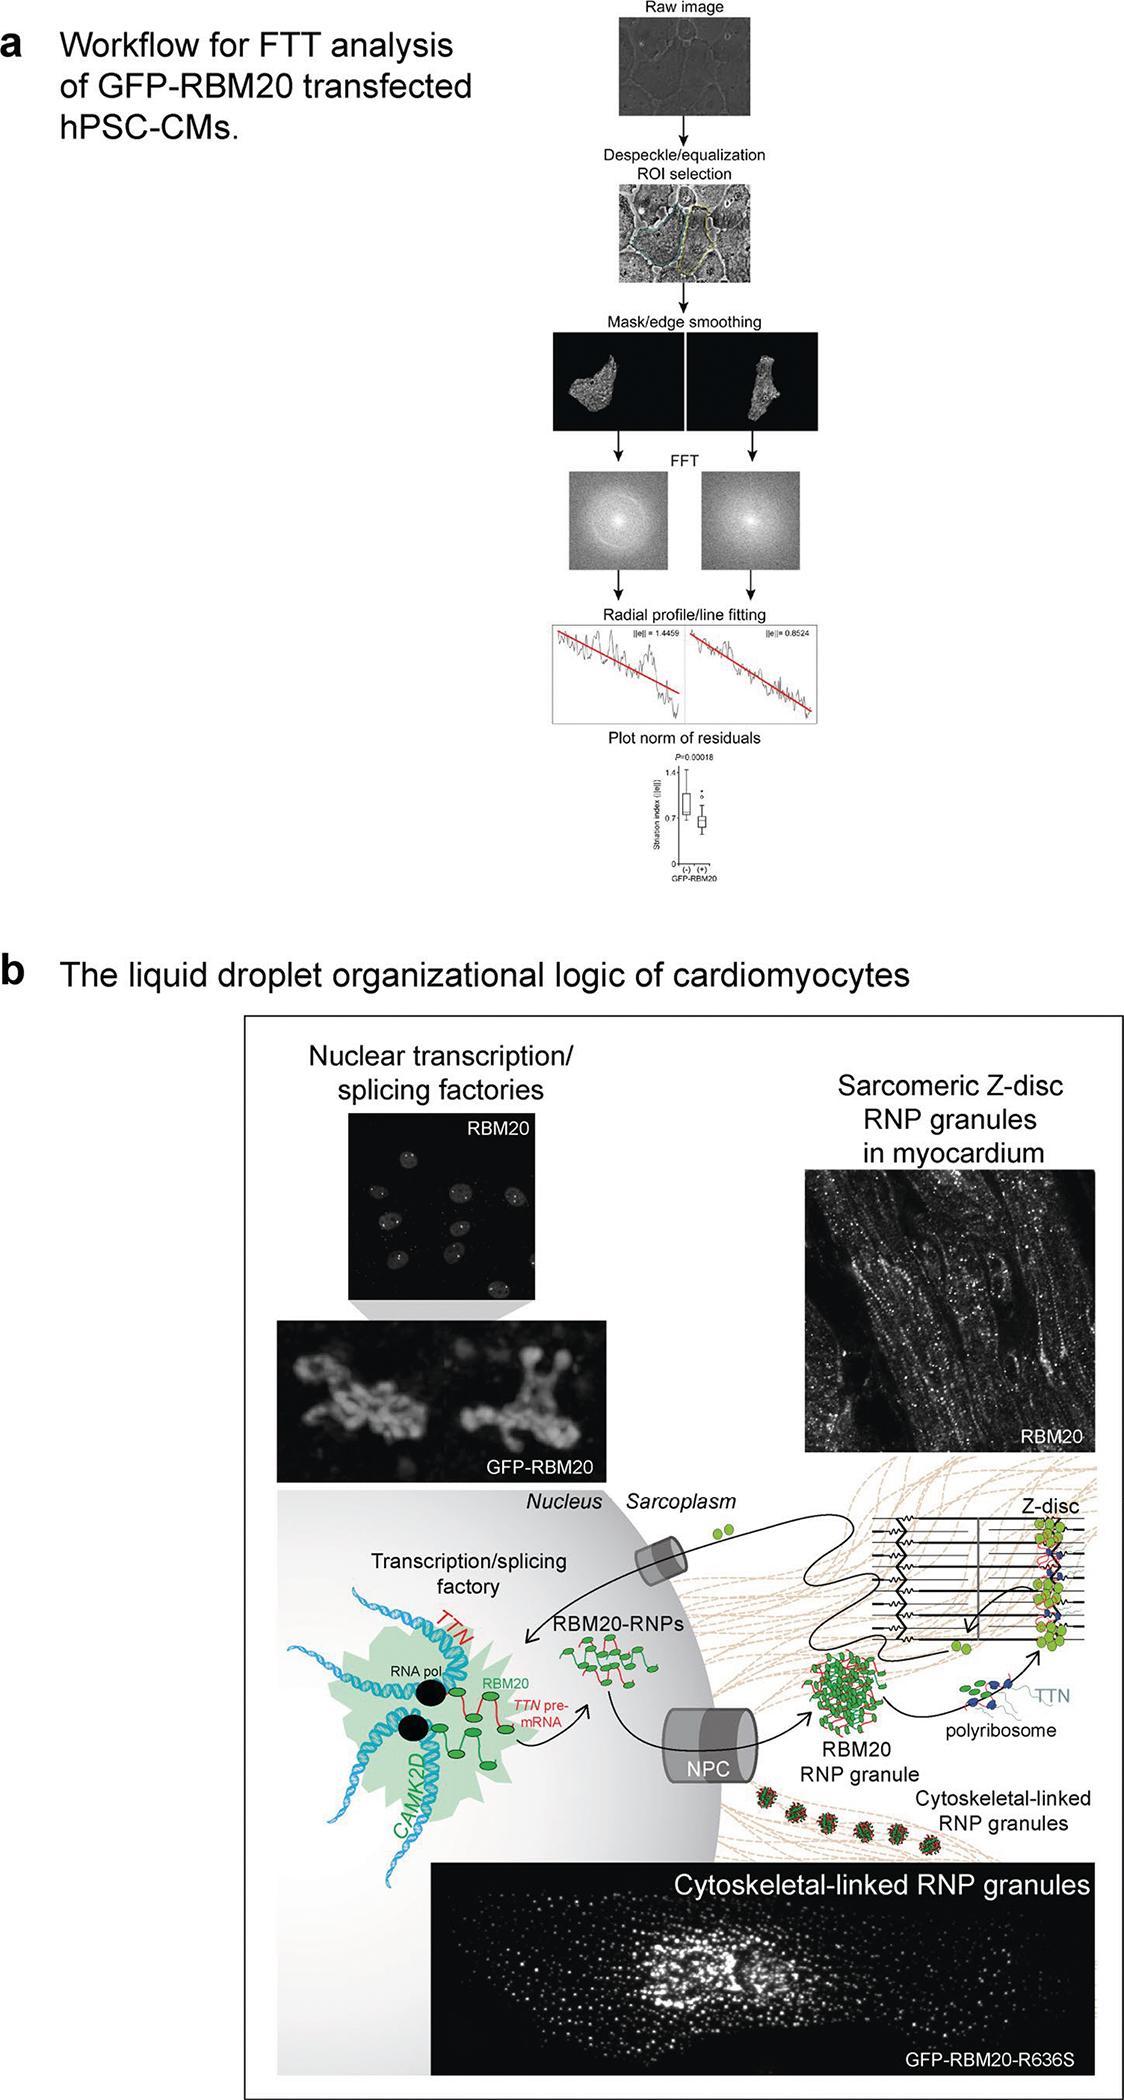
a, Workflow for quantitative analysis of decreased striated patterning associated with R3G accumulation in GFP-RBM20 transfected hPSC-CMs, see Methods for description of protocol. The symbol ||e|| in graph stands for ‘norm of residuals’ (square root of the sum of squares of residuals), which is a measure of ‘goodness of fit’ in regression analysis: lower numbers equal better fit. b, Infographic of RBM20 liquid pipeline for transfer of genetic information from nuclear transcription/splicing factories to sarcoplasmic Z-discs, the command center of myofibril biogenesis, across an elaborate sarcoplasmic network of cytoskeletal-linked biomolecular condensates. Conceptually, this liquid condensate pipeline organizes and manages the flow of genetic information from the cardiac genome-to-message-to-sarcomeres with RBM20 returning to the nucleus to pick-up new cargo.
Supplementary Material
Acknowledgements
We thank the patients who contributed cells and tissues to this study, E. Olson and J. Hill for support during the transition of J.W.S. from the University of Texas Southwestern Medical Center to Mayo Clinic, and J. Dearani and A. Terzic at Mayo Clinic. We also thank C. Riggs and N. Kedersha (Harvard Medical School) for sharing FRAP plasmids, and M. Rosen and S. McKnight (University of Texas Southwestern Medical Center) for sharing resources and helpful discussions. We also acknowledge grant support from NIH/NHLBI U01HL100404 (Progenitor Cell Biology Consortium) and NIH U54HD087351 (Wellstone Center for Muscular Dystrophy Research) to J.W.S., American Heart Association grant 19TPA34830072 to W.G., JSPS KAKENHI Grant Number JP20K21385 and Nanken-Kyoten, TMDU to H.K. and Steinmetz Cardiomyopathy Fund to L.M.S.
Footnotes
Competing interests
Generation of the RBM20R636S pig by gene-editing technology represents a collaborative partnership between Recombinetics (St. Paul, Minnesota), a commercial entity and Mayo Clinic in Rochester (Minnesota). T.M., A.W.C., D.A.W., D.F.C. and S.C.F. are shareholders in Recombinetics (St. Paul, Minnesota), which seeks to commercialize the RBM20R636S pig. The Todd and Karen Wanek Family Program for Hypoplastic Left Heart Syndrome at Mayo Clinic—the co-inventor of the RBM20R636S pig—maintains a profit-sharing agreement with Recombinetics regarding this gene-edited pig.
Additional information
Extended data is available for this paper at https://doi.org/10.1038/s41591-020-1087-x.
Supplementary information is available for this paper at https://doi.org/10.1038/s41591-020-1087-x.
Peer review information Michael Basson was the primary editor on this article and managed its editorial process and peer review in collaboration with the rest of the editorial team.
Reprints and permissions information is available at www.nature.com/reprints.
Wanek Program Preclinical Pipeline
Susana Cantero Peral13, Sarah Edgerton13, Joan Wobig13, Boyd Rasmussen13, Jodi A. Scholz14, Frank Cetta15, Scott H. Suddendorf16, Joanne M. Pedersen16, Steve Krage16, Craig S. Frisk14, Chelsea L. Reece17, Angela R. Miller17, Sara E. Martineau17, Rebecca K. Johnson17, Amanda L. Breuer17, Janell K. Fox17, Jay W. Schneider1,2, Saji Oommen1, Muhammad Y. Qureshi1, David R. Pease1, Rhianna S. Sundsbak1, Kimberly A. Holst1, Brooks S. Edwards1, Nikolas Newville1, Matthew A. Hathcock1, Timothy M. Olson1 and Timothy J. Nelson1,10,11,18
13Todd and Karen Wanek Family Program for Hypoplastic Left Heart Syndrome, Mayo Clinic, Rochester, MN, USA. 14Department of Comparative Medicine, Mayo Clinic, Rochester, MN, USA. 15Department of Pediatric Cardiology, Mayo Clinic, Rochester, MN, USA. 16Department of Cardiovascular Surgery, Mayo Clinic, Rochester, MN, USA. 17Echocardiography Laboratory, Mayo Clinic, Rochester, MN, USA.
Data availability
Additional information and detailed protocols regarding all experimental methodologies are available upon request from J.W.S. The RBM20R636S genetically engineered pig is commercially available through Recombinetics (D.F.C.) and/or through collaboration with Discovery Engine at Mayo Clinic (J.W.S. or T.J.N.; timothy.nelson@mayo.edu). Data on the human iPSCs and iPSC-derived cardiomyocytes used in this study, unique Mayo Clinic identifiers 5RCM1 and 4RCM1, unrelated patients with DCM heterozygous for the R636S variant (described in ref. 1) and normal control hiPSCs and derived cardiomyocytes (81HLH4) are available upon request from J.W.S. and T.J.N. (timothy.nelson@ mayo.edu) through the Mayo Clinic Discovery Engine and ReGen Theranostics (Rochester, Minnesota). The myocardial biopsy materials used in this study (from the patients described in ref. 1) are available upon request from T.M.O. (timothy. olson@mayo.edu) at the Mayo Clinic Discovery Engine. For the human and animal studies, all approved IRB, informed consent and IACUC animal treatment and husbandry protocols are available upon request from J.W.S. at Mayo Clinic or Recombinetics. Data on the plasmid DNA and all primer DNA sequences used in this study are available from J.W.S. upon request. There are no restrictions on data availability for any part of this paper. Source data are provided with this paper.
References
- 1.Brauch KM et al. Mutations in ribonucleic acid binding protein gene cause familial dilated cardiomyopathy. J. Am. Coll. Cardiol. 54, 930–941 (2009). [DOI] [PMC free article] [PubMed] [Google Scholar]
- 2.Li S, Guo W, Dewey CN & Greaser ML Rbm20 regulates titin alternative splicing as a splicing repressor. Nucleic Acids Res. 41, 2659–2672 (2013). [DOI] [PMC free article] [PubMed] [Google Scholar]
- 3.Watanabe T, Kimura A & Kuroyanagi H Alternative splicing regulator RBM20 and cardiomyopathy. Front. Mol. Biosci. 5, 105 (2018). [DOI] [PMC free article] [PubMed] [Google Scholar]
- 4.Murayama R et al. Phosphorylation of the RSRSP stretch is critical for splicing regulation by RNA-binding motif protein 20 (RBM20) through nuclear localization. Sci. Rep. 8, 8970 (2018). [DOI] [PMC free article] [PubMed] [Google Scholar]
- 5.Filippello A, Lorenzi P, Bergamo E & Romanelli MG Identification of nuclear retention domains in the RBM20 protein. FEBS Lett. 587, 2989–2995 (2013). [DOI] [PubMed] [Google Scholar]
- 6.Guo W et al. RBM20, a gene for hereditary cardiomyopathy, regulates titin splicing. Nat. Med. 18, 766–773 (2012). [DOI] [PMC free article] [PubMed] [Google Scholar]
- 7.Methawasin M et al. Experimentally increasing the compliance of titin through RNA binding motif-20 (RBM20) inhibition improves diastolic function in a mouse model of heart failure with preserved ejection fraction. Circulation 134, 1085–1099 (2016). [DOI] [PMC free article] [PubMed] [Google Scholar]
- 8.Bertero A et al. Dynamics of genome reorganization during human cardiogenesis reveal an RBM20-dependent splicing factory. Nat. Commun. 10, 1538 (2019). [DOI] [PMC free article] [PubMed] [Google Scholar]
- 9.Linke WA & Bucker S King of hearts: a splicing factor rules cardiac proteins. Nat. Med. 18, 660–661 (2012). [DOI] [PubMed] [Google Scholar]
- 10.Van den Hoogenhof MM, Pinto YM & Creemers EE RNA splicing: regulation and dysregulation in the heart. Circ. Res. 118, 454–468 (2016). [DOI] [PubMed] [Google Scholar]
- 11.Shin Y & Brangwynne CP Liquid phase condensation in cell physiology and disease. Science 357, eaaf4382 (2017). [DOI] [PubMed] [Google Scholar]
- 12.Nedelsky NB & Taylor JP Bridging biophysics and neurology: aberrant phase transitions in neurodegenerative disease. Nat. Rev. Neurol. 15, 272–286 (2019). [DOI] [PubMed] [Google Scholar]
- 13.Ramaswami M, Taylor JP & Parker R Altered ribostasis: RNA–protein granules in degenerative disorders. Cell 154, 727–736 (2013). [DOI] [PMC free article] [PubMed] [Google Scholar]
- 14.Ito D, Hatano M & Suzuki N RNA binding proteins and the pathological cascade in ALS/FTD neurodegeneration. Sci. Transl. Med. 9, eaah5436 (2017). [DOI] [PubMed] [Google Scholar]
- 15.Banani SF, Lee HO, Hyman AA & Rosen MK Biomolecular condensates: organizers of cellular biochemistry. Nat. Rev. Mol. Cell Biol. 18, 285–298 (2017). [DOI] [PMC free article] [PubMed] [Google Scholar]
- 16.Cutler AA, Ewachiw TE, Corbet GA, Parker R & Olwin BB Myo-granules connect physiology and pathophysiology. J. Exp. Neurosci. 13, 1179069519842157 (2019). [DOI] [PMC free article] [PubMed] [Google Scholar]
- 17.Vogler TO et al. TDP-43 and RNA form amyloid-like myo-granules in regenerating muscle. Nature 563, 508–513 (2018). [DOI] [PMC free article] [PubMed] [Google Scholar]
- 18.Protter DSW & Parker R Principles and properties of stress granules. Trends Cell Biol. 26, 668–679 (2016). [DOI] [PMC free article] [PubMed] [Google Scholar]
- 19.Gilks N et al. Stress granule assembly is mediated by prion-like aggregation of TIA-1. Mol. Biol. Cell 15, 5383–5398 (2004). [DOI] [PMC free article] [PubMed] [Google Scholar]
- 20.Waris S, Wilce MC & Wilce JA RNA recognition and stress granule formation by TIA proteins. Int. J. Mol. Sci. 15, 23377–23388 (2014). [DOI] [PMC free article] [PubMed] [Google Scholar]
- 21.Li YR, King OD, Shorter J & Gitler AD Stress granules as crucibles of ALS pathogenesis. J. Cell Biol. 201, 361–372 (2013). [DOI] [PMC free article] [PubMed] [Google Scholar]
- 22.Wolozin B Physiological protein aggregation run amuck: stress granules and the genesis of neurodegenerative disease. Discov. Med. 17, 47–52 (2014). [PMC free article] [PubMed] [Google Scholar]
- 23.Boeynaems S, Tompa P & Van Den Bosch L Phasing in on the cell cycle. Cell Div. 13, 1 (2018). [DOI] [PMC free article] [PubMed] [Google Scholar]
- 24.Jourdain AA, Boehm E, Maundrell K & Martinou JC Mitochondrial RNA granules: compartmentalizing mitochondrial gene expression. J. Cell Biol. 212, 611–614 (2016). [DOI] [PMC free article] [PubMed] [Google Scholar]
- 25.Kato M et al. Cell-free formation of RNA granules: low complexity sequence domains form dynamic fibers within hydrogels. Cell 149, 753–767 (2012). [DOI] [PMC free article] [PubMed] [Google Scholar]
- 26.Jain S et al. ATPase-modulated stress granules contain a diverse proteome and substructure. Cell 164, 487–498 (2016). [DOI] [PMC free article] [PubMed] [Google Scholar]
- 27.Sutcliffe MD et al. High content analysis identifies unique morphological features of reprogrammed cardiomyocytes. Sci. Rep. 8, 1258 (2018). [DOI] [PMC free article] [PubMed] [Google Scholar]
- 28.Arrell DK Delineating RBM20 regulation of alternative splicing in dilated cardiomyopathy. Circ. Cardiovasc. Genet. 7, 732–733 (2014). [DOI] [PMC free article] [PubMed] [Google Scholar]
- 29.Refaat MM et al. Genetic variation in the alternative splicing regulator RBM20 is associated with dilated cardiomyopathy. Heart Rhythm 9, 390–396 (2012). [DOI] [PMC free article] [PubMed] [Google Scholar]
- 30.Rexiati M, Sun M & Guo W Muscle-specific mis-splicing and heart disease exemplified by RBM20. Genes 9, 18 (2018). [DOI] [PMC free article] [PubMed] [Google Scholar]
- 31.Weeland CJ, van den Hoogenhof MM, Beqqali A & Creemers EE Insights into alternative splicing of sarcomeric genes in the heart. J. Mol. Cell Cardiol. 81, 107–113 (2015). [DOI] [PubMed] [Google Scholar]
- 32.Alberti S The wisdom of crowds: regulating cell function through condensed states of living matter. J. Cell Sci. 130, 2789–2796 (2017). [DOI] [PubMed] [Google Scholar]
- 33.Kato M & McKnight SL Cross-β polymerization of low complexity sequence domains. Cold Spring Harb. Perspect. Biol. 9, a023598 (2017). [DOI] [PMC free article] [PubMed] [Google Scholar]
- 34.Kato M & McKnight SL A solid-state conceptualization of information transfer from gene to message to protein. Annu. Rev. Biochem. 87, 351–390 (2018). [DOI] [PubMed] [Google Scholar]
- 35.De Graeve F & Besse F Neuronal RNP granules: from physiological to pathological assemblies. Biol. Chem. 399, 623–635 (2018). [DOI] [PubMed] [Google Scholar]
- 36.Kiebler MA & Bassell GJ Neuronal RNA granules: movers and makers. Neuron 51, 685–690 (2006). [DOI] [PubMed] [Google Scholar]
- 37.Zarnescu DC & Gregorio CC Fragile hearts: new insights into translational control in cardiac muscle. Trends Cardiovasc. Med. 23, 275–281 (2013). [DOI] [PMC free article] [PubMed] [Google Scholar]
- 38.Labeit S, Kolmerer B & Linke WA The giant protein titin. Emerging roles in physiology and pathophysiology. Circulation Res. 80, 290–294 (1997). [DOI] [PubMed] [Google Scholar]
- 39.Khong A et al. The stress granule transcriptome reveals principles of mRNA accumulation in stress granules. Mol. Cell 68, 808–820.e5 (2017). [DOI] [PMC free article] [PubMed] [Google Scholar]
- 40.Lee CY & Seydoux G Dynamics of mRNA entry into stress granules. Nat. Cell Biol. 21, 116–117 (2019). [DOI] [PMC free article] [PubMed] [Google Scholar]
- 41.Moon SL et al. Multicolour single-molecule tracking of mRNA interactions with RNP granules. Nat. Cell Biol. 21, 162–168 (2019). [DOI] [PMC free article] [PubMed] [Google Scholar]
- 42.Anderson P & Kedersha N Stress granules: the Tao of RNA triage. Trends Biochem. Sci. 33, 141–150 (2008). [DOI] [PubMed] [Google Scholar]
- 43.Buchan JR & Parker R Eukaryotic stress granules: the ins and outs of translation. Mol. Cell 36, 932–941 (2009). [DOI] [PMC free article] [PubMed] [Google Scholar]
- 44.Thomas MG, Loschi M, Desbats MA & Boccaccio GL RNA granules: the good, the bad and the ugly. Cell Signal. 23, 324–334 (2011). [DOI] [PMC free article] [PubMed] [Google Scholar]
- 45.Vanderweyde T, Youmans K, Liu-Yesucevitz L & Wolozin B Role of stress granules and RNA-binding proteins in neurodegeneration: a mini-review. Gerontology 59, 524–533 (2013). [DOI] [PMC free article] [PubMed] [Google Scholar]
- 46.Harvey R, Dezi V, Pizzinga M & Willis AE Post-transcriptional control of gene expression following stress: the role of RNA-binding proteins. Biochem. Soc. Trans. 45, 1007–1014 (2017). [DOI] [PMC free article] [PubMed] [Google Scholar]
- 47.Hey TM et al. Pathogenic RBM20-variants are associated with a severe disease expression in male patients with dilated cardiomyopathy. Circ. Heart Fail. 12, e005700 (2019). [DOI] [PubMed] [Google Scholar]
- 48.Gacita AM & McNally EM Genetic spectrum of arrhythmogenic cardiomyopathy. Circ. Heart Fail. 12, e005850 (2019). [DOI] [PMC free article] [PubMed] [Google Scholar]
- 49.Parikh VN et al. Regional variation in RBM20 causes a highly penetrant arrhythmogenic cardiomyopathy. Circ. Heart Fail. 12, e005371 (2019). [DOI] [PMC free article] [PubMed] [Google Scholar]
Associated Data
This section collects any data citations, data availability statements, or supplementary materials included in this article.
Supplementary Materials
Data Availability Statement
Additional information and detailed protocols regarding all experimental methodologies are available upon request from J.W.S. The RBM20R636S genetically engineered pig is commercially available through Recombinetics (D.F.C.) and/or through collaboration with Discovery Engine at Mayo Clinic (J.W.S. or T.J.N.; timothy.nelson@mayo.edu). Data on the human iPSCs and iPSC-derived cardiomyocytes used in this study, unique Mayo Clinic identifiers 5RCM1 and 4RCM1, unrelated patients with DCM heterozygous for the R636S variant (described in ref. 1) and normal control hiPSCs and derived cardiomyocytes (81HLH4) are available upon request from J.W.S. and T.J.N. (timothy.nelson@ mayo.edu) through the Mayo Clinic Discovery Engine and ReGen Theranostics (Rochester, Minnesota). The myocardial biopsy materials used in this study (from the patients described in ref. 1) are available upon request from T.M.O. (timothy. olson@mayo.edu) at the Mayo Clinic Discovery Engine. For the human and animal studies, all approved IRB, informed consent and IACUC animal treatment and husbandry protocols are available upon request from J.W.S. at Mayo Clinic or Recombinetics. Data on the plasmid DNA and all primer DNA sequences used in this study are available from J.W.S. upon request. There are no restrictions on data availability for any part of this paper. Source data are provided with this paper.