

Abstract
Aims
To examine how standard analytical approaches to model mortality outcomes of alcohol use compare to the true results using the impact of the March 2017 alcohol taxation increase in Lithuania on all-cause mortality as an example.
Methods
Four methodologies were used: two direct methodologies: (a) interrupted time-series on mortality and (b) comparing predictions based on time-series modeling with the real number of deaths for the year following the implementation of the tax increase; and two indirect methodologies: (c) combining a regression-based estimate for the impact of taxation on alcohol consumption with attributable-fraction methodology and (d) using price elasticities from meta-analyses to estimate the impact on alcohol consumption before applying attributable-fraction methodology.
Results and Conclusions
While all methodologies estimated reductions in all-cause mortality, especially for men, there was substantial variability in the level of mortality reductions predicted. The indirect methodologies had lower predictions as the meta-analyses on elasticities and risk relations seem to underestimate the true values for Lithuania. Directly estimated effects of taxation based on the actual mortalities seem to best represent the true reductions in alcohol-attributable mortality. A significant increase in alcohol excise taxation had a marked impact on all-cause mortality in Lithuania.
Short Summary: Four different analytic approaches were used to estimate the impact of a recent alcohol excise tax increase in Lithuania on all-cause mortality. While all resulted in decreases of mortality, the true effect was best estimated via a comparison between predictions derived from time-series methodology compared with actual number of deaths. The indirect analytic approaches based on alcohol-attributable fraction methodology seem to underestimate the true effect.
BACKGROUND
Alcohol use is a major risk factor for mortality and burden of disease (Rehm and Imtiaz, 2016; Shield et al., 2020) and incurs substantial costs to societies (Manthey et al., 2021). Increasing alcohol taxation as a means to increase the prices of alcoholic beverages is one of the most effective and cost-effective strategies to reduce alcohol use and attributable harm (Wagenaar et al., 2010; Chisholm et al., 2018; OECD, 2021). To plan and implement taxation policies for alcohol, governments often need to predict the effects of taxation increases, both with respect to health and to economic outcomes. This contribution examines how standard techniques to model health outcomes compare to the true results, using a recent example of a substantial alcohol taxation increase in Lithuania that was enacted on 1 March 2017 (Miščikienė et al., 2020). Specifically, there was an excise tax increase of 112% for beer, 111% for wine and 23% for ethyl alcohol (which impacted on spirits prices). This taxation increase resulted in alcohol becoming less affordable during a period of stable economic growth, with affordability being defined in terms of the price of alcohol increasing at a higher rate than average disposable income (Rehm et al., 2021b). We chose to use this taxation increase as an example given that, even though it was relatively recent, enough time had lapsed since it was implemented for the potential consequences to be measured, i.e. it was possible to conduct interrupted time-series analyses with sufficient time points available post-implementation (Beard et al., 2019).
Štelemėkas et al. (2021) showed that the increase in alcohol taxation in 2017 was associated with a marked decrease in all-cause mortality rates. Thus, we selected all-cause mortality as the health outcome to be measured. All-cause mortality is the most reliable mortality outcome, as all specific cause-of-death categories can be impacted by misclassification. This is particularly true for outcomes that are 100% attributable to alcohol, as they have been shown to be severely underestimated (Puffer and Griffith, 1967; Rehm et al., 2017b). Specifically for Lithuania, the coding rules for the most important 100% alcohol-attributable disease condition—alcoholic liver disease—changed several times, creating issues with comparability (Cicėnienė et al., 2019).
We compared the following analytic approaches, based on the theoretical considerations of how taxation may impact alcohol-attributable mortality (see Fig. 1):
Fig. 1.
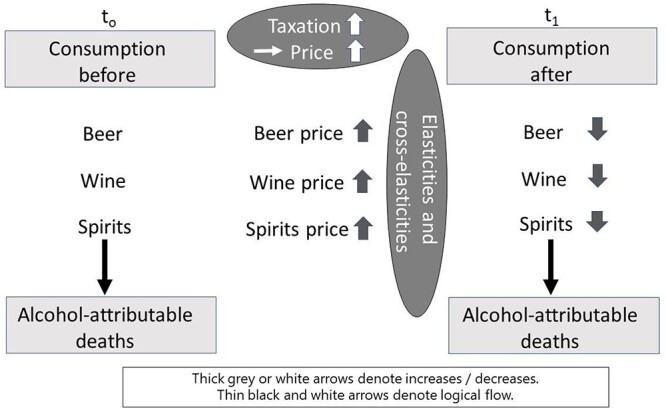
Flow diagram on alcohol use, taxation and alcohol-attributable deaths.
(1) An interrupted time-series analysis (Beard et al., 2019) of the direct effect of taxation on all-cause mortality, assuming an abrupt (i.e. immediate) and permanent effect (Štelemėkas et al., 2021)
(2) A comparison between the predicted values based on a time-series analysis before the event, and the actual values (Jiang et al., 2021)
(3) Regression-based analysis of the effect of taxation on alcohol consumption (on total alcohol per capita consumption, and separately by beverage type), combined with using attributable-fraction methodology (Rockhill et al., 1998; Rehm et al., 2010) to predict the impact of change in consumption on all-cause mortality
(4) Modeling the potential effects of taxation increases on alcohol consumption via price elasticities (Sornpaisarn et al., 2017), and then using the predicted changes in alcohol consumption to predict changes in all-cause mortality via attributable-fraction methodology (as in 3)
While Fig. 1 explicitly pertains to alcohol-attributable mortality, the same mechanisms apply for other health indicators that are causally impacted by alcohol (such as all-cause mortality, or alcohol-attributable hospitalizations). In countries such as Lithuania, alcohol-attributable mortality is at such a high level (e.g. (Rehm et al., 2007)) that changes in alcohol-attributable mortality are reflected in the all-cause mortality trends as well.
MATERIALS AND METHODS
Interrupted time-series methodology
The model of the interrupted time-series methodology is described in detail in Appendix Text A1 (see also (Štelemėkas et al., 2021) for further details). In short, an interrupted time-series of monthly all-cause mortality data was estimated, using generalized additive models (GAMs (Hastie and Tibshirani, 1990, Beard et al., 2019)), which were adjusted for seasonality by smoothing splines. The alcohol control policy intervention was tested using a dummy variable to model an abrupt and permanent effect. Potential confounding factors included centered monthly gross domestic product (GDP), centered unemployment rate and a second-order polynomial of the time to account for the overall curvilinear trend in all-cause mortality. In this model, which will be referred to herein as the direct estimation approach, the intervention effect equals the beta weight as derived from the interrupted time-series model.
Monthly data on all-cause mortality were provided to the project from the Lithuanian Institute of Hygiene, age-standardized to the Lithuanian population of February 2017, the month before the taxation increase (Lithuanian Department of Statistics, 2021c).
Methodology to compare predicted continuation of trends prior to taxation versus actual mortality
For the prediction model, we fitted a time-series model as described above to estimate the trend before the intervention and subsequently used this model to predict the 12 months after the intervention. In this prediction approach, the intervention effect is the difference between the predicted and the actual numbers of death.
Estimated effect of taxation on consumption and subsequent mortality using alcohol-attributable fractions
The third indirect two-step approach is a regression-based approach used to predict changes in recorded adult per capita consumption (APC), thus estimating the impact of the excise taxation on APC. Given the relatively short time series of APC (yearly data between 2001 and 2019, n = 18), we performed an ordinary least-squares regression on alcohol consumption per capita, with the taxation policy in 2017 as a dummy-coded variable. We included two additional economic indicators (gross domestic product (GDP), and consumer price index (CPI)), which were yearly time-series data covering the same period (from 2001 to 2019), as well as quadratic and linear time-trend covariates. In addition, we performed a regression using a different estimator, a ridge regression, which accounts for potential multicollinearity between independent predictors (Hoerl and Kennard, 1970). For the full methods and results of the regressions used to estimate the impact on per capita consumption, refer to Appendix Text A2.
Consumption was then related to alcohol-attributable mortality using the following formula for alcohol-attributable fractions (AAFs; see (Rehm et al., 2010)), where Pi and RRi denote the prevalence of consumption and the relative risk, respectively, for each consumption group—lifetime abstainers (‘abs’), former drinkers (‘form’) and current drinkers (‘CD’):
 |
(1) |
Note that this formula was applied to each disease category causally related and partially attributable to alcohol use ((Rehm et al., 2017a); for an overview of categories used, see Appendix Table A1), except for cancer where the impact of alcohol only manifests itself after a lag time. For cancer, we would thus not expect an effect within 12 months of the implementation of the policy.
The disease-specific risk functions (taken from (Shield et al., 2020), where applicable, separated by sex and age (Rehm et al., 2021a)), only depend on the level of alcohol ingested, as derived from reported APC (Lithuanian Department of Statistics, 2021b). The distribution of alcohol consumption by beverage type, sex and age was taken from Manthey and colleagues (Manthey et al., 2019; Shield et al., 2020). Finally, the data on the total number of deaths per year were obtained from the Institute of Health Metrics and Evaluation (Global Health Data Exchange, 2020).
However, not all the diseases causally impacted by alcohol use can be modeled using AAFs. For totally alcohol-attributable diseases, the AAF by definition is 1, independent of the level of consumption. To estimate change in these disease categories (e.g. alcohol use disorders), we followed the methodology used by Churchill and colleagues (Churchill et al., 2020); see Formula 2, where N is the number of deaths, S is the population size, p(x;k,t) is the risk function and F(x;μ) is the gamma distribution for the mean consumption μ.
 |
(2) |
The risk function only affects heavy drinkers, defined as women consuming 40 g or more ethanol per day, and men consuming 60 g or more ethanol per day.
Estimated effect of taxation on mortality based on alcohol price elasticity, consumption and subsequent mortality
Increasing taxes on alcoholic beverages means that their prices will increase, assuming the producers pass the cost entirely on to the consumer, which has generally been found to be the case (Nelson and Moran, 2020; Shang et al., 2020). The increase in product price can then be translated into a change in consumption if the price elasticity is known. Price elasticity is a measurement of the change in consumption of a product in relation to a change in its price (see Formula 3, where ∆Q is the percent change in consumption and ∆P is the percent change in price).
 |
(3) |
Price elasticity tends to depend on beverage type, and which beverages are preferred in different cultures but seem to be stable across countries (Fogarty, 2010). As in prior publications regarding European countries (e.g. (Rovira et al., 2021a, Rovira et al., 2021b)), we used elasticities based on published meta-analyses (Ornstein and Levy, 1983; Wagenaar et al., 2009; Fogarty, 2010; Sornpaisarn et al., 2013). That is, −0.36 (95% CI: −0.48, −0.24) for the most-preferred beverages, which for Lithuania in 2016 were spirits (Manthey et al., 2019); −1.20 (95% CI: −1.44, −0.96) for the least-preferred beverages, which were wines; and an intermediate value of −0.60 (95% CI: −0.72, −0.48) for beer. The negative values indicate the proportional decreases in the consumption of the respective beverages when the price is increased by 1 unit (Sornpaisarn et al., 2017).
For heavy drinkers, we modified the above-specified elasticities estimated based on the reported APC level, drinking status information (Manthey et al., 2019) and assuming a gamma distribution in the level of consumption (Rehm et al., 2010; Kehoe et al., 2012)). The distinction between heavy versus non-heavy drinkers was made based on a meta-analysis that showed that heavy drinkers or people with alcohol use disorders (for further discussion, see (Rehm et al., 2013)) tend to be less price-elastic (Wagenaar et al., 2009). In fact, continuation of alcohol consumption despite having good reasons to drink less or quit drinking altogether is one of the diagnostic criteria of alcohol use disorders (Carvalho et al., 2019). Based on the above-mentioned meta-analysis, the heavy drinkers, as defined above, were assigned an elasticity of −0.28 (95% CI: −0.37, −0.19), irrespective of alcoholic beverage type consumed.
As described above, the methodologies for partially and totally alcohol-attributable diseases can be applied to recorded consumption values before and after the taxation implementation to estimate the number of averted deaths.
Summary of assumptions
In Table 1, the main assumptions about each of the modeling approaches are given.
Table 1.
Main assumptions of the different modeling approaches used
| Analytical approach | Assumptions regarding effect of taxation on alcohol use | Assumptions regarding risk relations alcohol use and causes of death | Assumptions regarding lag time between alcohol use and mortality | Assumptions regarding lag time between taxation and mortality | Confounders | Comments |
|---|---|---|---|---|---|---|
| (1) Interrupted time-series (ITS) of all-cause mortality data (see Appendix Text A1; (Jiang et al., 2021, Štelemėkas et al., 2021) Direct estimation approach |
None | None. | None. | Abrupt and immediate effect | Assumes that all relevant confounders were included in the ITS model, and no other event at the same time could have caused the effect; effect depends on age-standardization used. | Modeling with different assumptions possible; if assumption of abrupt and immediate effect is not correct, impact estimate will be biased. Stockpiling may distort the results. |
| (2) Comparison of predicted (based on time-series) and actual all-cause mortality (see Appendix Text A1) Prediction approach |
None | None. | None. | Abrupt and immediate effect | Assumes that time-series model before the taxation intervention is correctly identified and all relevant confounders/predictors are identified; effect depends on age-standardization used. | Modeling with different assumptions possible; if assumption of abrupt and immediate is not correct, impact estimate will be biased. Stockpiling may distort the results. |
| (3) Two-step approach: (1) Regression-based estimate of changes in alcohol use (see Appendix Text A2); (2) alcohol-attributable fraction approach to model effect of alcohol on mortality Indirect approach 1 |
No stockpiling. | (1) All COD that alcohol use impacts upon immediately are identified; (2) the risk relations between level of drinking and COD are correctly identified from meta-analyses. |
Abrupt and immediate effect was modeled over one year. | None | Assumes that all relevant confounders were included in the model, and no other event at the same time could have caused the effect. | Modeling with different assumptions possible; if assumption of abrupt and immediate impact of alcohol on COD is wrong, this will not be detected. |
| (4) Three-step approach: (1) measuring the impact of taxation on price; (2) estimating the impact of price on consumption (via price elasticities); (3) using attributable-fraction approach to model effect of consumption on mortality Indirect approach 2 |
The price elasticities for different beverage types are correctly identified from meta-analyses, and there are no major cross-elasticities. The elasticities of non-drinkers do not play a role in taxation increases. | (1) All COD that alcohol use impacts upon immediately are identified; (2) the risk relations between level of drinking and COD are correctly identified from meta-analyses. |
Abrupt and immediate effect was modeled over one year. | None | Does not assume other direct impact on use than price as all other impacts are only indirectly included in the meta-analyses to derive price elasticities. | If assumption of abrupt and immediate impact of alcohol on COD is wrong, this will not be detected. Stockpiling does not change the results of the modeling. |
COD: cause of death
Validation of results
To validate the results, we compared empirical elasticities with the ones derived from meta-analyses, and we looked at how all-cause mortality and causes of death were impacted by alcohol from 2015 to 2019 (see Appendix Tables A1 and A2 for a list of causes of death).
RESULTS
While all methodologies indicated a decrease in mortality due to the implementation of the 2017 tax policy, point estimates of the number of deaths averted varied substantially (Table 2; see Appendix Texts A1 and A2 for details).
Table 2.
Results from four different modeling approaches for the 12 months following the taxation increases (March 2017–February 2018)
| Analytic approach | Number of deaths averted in the 12-month period following the implementation of increased excise taxation | ||
|---|---|---|---|
| Women | Men | Totala | |
| Interrupted time-series of mortality rates (Jiang et al., 2021) | 433 95% CI: −560, 1427 |
1718 95% CI: 203, 3232 |
2151 95% CI: 340, 3962 |
| Comparison between predictions based on time-series and actual deaths (Jiang et al., 2021) | 176 95% CI: −51, 404 |
979 95% CI: 618, 1340 |
1155 95% CI: 729, 1582 |
| Two-step approach: (1) Regression-based estimate of changes in alcohol use (2) Alcohol-attributable fraction approach to model the effect of alcohol on mortality |
77 95% CI: 54, 268 |
141 95% CI: 96, 210 |
217 95% CI: 171, 425 |
| Three-step approach: (1) Measuring the impact of taxation on price (2) Estimating the impact of price on consumption (3) Attributable-fraction approach to model effect of alcohol on mortality |
42 95% CI: 36, 169 |
65 95% CI: 53, 95 |
107 95% CI: 93, 244 |
aTotal effects are based on population-adjusted addition of sex-specific effects.
The two direct methodologies using interrupted time-series or predictions based on time series yielded much higher estimates than the indirect methodologies. But which methodologies are more valid?
Table 3 gives the observed changes in all-cause mortality and causes of death, which are impacted by alcohol use for the years 2015–2019. There is not a lot of variation for 2015 to 2016, or 2017 to 2019, and indeed the big changes are seen between 2016 and 2017 (see last row in the Table), consistent with an impact from changes in taxation. Moreover, the changes are mainly in men (and, also, therefore, when both sexes are combined), and the level of change in causes of death impacted by alcohol accounts for most of the decrease in all-cause mortality (for women: 179 of 220; for men: 1199 of 1787; total: 1377 of 2007; see Table 3). Given these numbers, the prediction approach comes closest to the data.
Table 3.
Number of deaths by all causes and by causes of death causally impacted by alcohol in Lithuania 2015–2019
| Causes of death impacted by alcohol (as per Appendix Tables A1 and A2) | All-cause deaths | |||||
|---|---|---|---|---|---|---|
| Women | Men | Total | Women | Men | Total | |
| 2015 | 13,741 | 12,578 | 26,319 | 20,632 | 20,074 | 40,706 |
| 2016 | 13,547 | 12,552 | 26,098 | 20,422 | 20,114 | 40,536 |
| 2017 | 13,368 | 11,353 | 24,721 | 20,202 | 18,326 | 38,529 |
| 2018 | 13,482 | 11,357 | 24,840 | 20,306 | 18,377 | 38,683 |
| 2019 | 13,637 | 11,081 | 24,718 | 20,501 | 18,001 | 38,501 |
| 2017–2016 | −179 | −1199 | −1377 | −220 | −1788 | −2007 |
Source: Global Health Data Exchange (2020); for a graphical display, see Appendix Figure A2.
The italic line at the end refers to the mortality reductions between the years 2016 and 2017.
Thus, based on the values in Table 3 and the above considerations, it seems likely that the estimated effect of taxation from the interrupted time-series analyses (the direct estimation approach) was an overestimate of the true effect, and the results of the two indirect analytic approaches were underestimates. The results of the three-step estimation based on elasticities underestimates the true elasticities as calculated based on the empirical data (see Appendix Table A3), especially for spirits.
DISCUSSION
Overall, as previously shown, the implementation of a higher tax on alcohol on 1 March 2017 in Lithuania was associated with a marked decrease in mortality, which was to be expected since it decreased the affordability of alcohol (Štelemėkas et al., 2021; Rehm et al., 2021b). Different methodologies were used to estimate this impact and yielded widely varying results. A validation suggested that indirect methodologies likely underestimated the impact and that using a direct methodology comparing the predicted deaths based on times-series methodology might have yielded a more accurate estimate. One major reason for this may be that the indirect method often fails to account for the internal structure of the data—for example, autocorrelation, trend or seasonal variation.
However, our study included the following limitations. The meta-analyses for the risk relationship between level of alcohol use and different causes of death may underestimate the mortality pattern in a country such as Lithuania. Indeed, in the comparative risk analyses, alcohol-attributable mortality in Lithuania has traditionally been modeled based on Russian studies, with a higher relative risk based on its more irregular heavy drinking pattern of predominantly spirits (Shield and Rehm, 2015; Shield et al., 2020); for a review on differential health risks for spirits, see (Rehm and Hasan, 2020). Even though drinking patterns have changed in Lithuania in 2019, and beer is now more commonly consumed than spirits (Lithuanian Department of Statistics, 2021a), the values arising from the meta-analyses used for non-Russian countries may still be underestimates.
The current situation in Lithuania, where two beverage types each account for more than 40% of alcohol consumption, may pose a problem when distinguishing between the least- and most-preferred beverages to determine price elasticities (based on (Ornstein and Levy, 1983)). Also, the price elasticities used in the fourth scenario based on meta-analyses clearly did not capture the actual situation in Lithuania (see Appendix Table A3). However, alternative price elasticities, such as the one derived by Nelson (Nelson, 2013), or not applying the reduction for heavier drinking (by using the overall beverage-specific elasticities of (Wagenaar et al., 2009)), would not have changed the general conclusion that all indirect methods underestimated the actual changes in mortality.
Another limitation is that within one year of the tax increase, at the beginning of 2018, other policies were implemented that may have affected the outcomes (i.e. reductions in hours of sale and the introduction of a minimum legal drinking age (Miščikienė et al., 2020)). However, a closer inspection of the results of the prediction approach shows that after the implementation of these alcohol control measures in January of 2018, the deaths averted actually decreased, indicating that these other policies could not be responsible for the main result.
Lastly, all analyses were ecological and, while we used causal language based on the postulated mechanisms, causality could not be firmly established based on the data. While we are not aware of alternative events beginning in early 2017, which could explain the abrupt decrease in alcohol consumption and alcohol-attributable deaths, we cannot fully exclude such events.
There are three main conclusions that can be drawn from this study. First, direct methodology should be used whenever feasible. Time-series methodologies (Beard et al., 2019) with monthly data make much fewer assumptions than indirect methods and can measure direct associations for an event happening in a specific month without the use of assumptions regarding price elasticity or risk relations between alcohol use and mortality (see Table 1). Obviously, the models need to be correctly specified to arrive at good estimates, and by using two different models—such as interrupted time-series analysis and prediction models—it can help identify the potential biases. Second, when a three-step methodology is used, at least some checks on the plausibility of meta-analyses for price elasticities should be performed. Since some time has passed since the publication of the meta-analyses on price elasticities we used (Ornstein and Levy, 1983; Wagenaar et al., 2009; Fogarty, 2010), and many more empirical research papers on the topic have been published in the intervening years, it may be time to conduct a new meta-analysis using meta-regressions for region, beverage type and beverage preference. Third, the implementation of alcohol excise taxation increases in Lithuania was clearly associated with important public health effects. Tax increases leading to reduced affordability (Rabinovich et al., 2009) continue to be an effective alcohol control policy— indeed, perhaps the most effective alcohol control policy (Babor et al., 2022 (forthcoming)).
In this sense, we would clearly expect that all excise taxation increases that reduce affordability of alcoholic beverages would result—at least in the short run—in reductions of consumption and mortality (Rehm and Purshouse, 2021). Regarding the level of the effects found for Lithuania, potential transferability is harder to assess. As alcohol-attributable mortality is impacted both by level of consumption and by patterns of drinking (Rehm et al., 2017a), we would expect a similar impact for countries with the same level of consumption and patterns of drinking.
Supplementary Material
ACKNOWLEDGEMENTS
We would like to acknowledge Astrid Otto for referencing and copy-editing the manuscript and Anush Zafar for helpful comments on an earlier version of the manuscript.
Contributor Information
Alexander Tran, Institute for Mental Health Policy Research, Centre for Addiction and Mental Health, 33 Ursula Franklin Street, Toronto, Ontario M5S 2S1, Canada.
Huan Jiang, Institute for Mental Health Policy Research, Centre for Addiction and Mental Health, 33 Ursula Franklin Street, Toronto, Ontario M5S 2S1, Canada; Epidemiology Division, Dalla Lana School of Public Health, University of Toronto, 155 College Street, Toronto, Ontario M5T 1P8, Canada.
Kawon Victoria Kim, Institute for Mental Health Policy Research, Centre for Addiction and Mental Health, 33 Ursula Franklin Street, Toronto, Ontario M5S 2S1, Canada; Epidemiology Division, Dalla Lana School of Public Health, University of Toronto, 155 College Street, Toronto, Ontario M5T 1P8, Canada.
Robin Room, Centre for Alcohol Policy Research, Building NR-1, La Trobe University, Bundoora, Victoria 3086, Australia; Department of Public Health Sciences, Centre for Social Research on Alcohol and Drugs, Department of Public Health Sciences, Albanovägen 12, floor 5, Stockholm University, Stockholm 106 91, Sweden.
Mindaugas Štelemėkas, Health Research Institute, Faculty of Public Health, Lithuanian University of Health Sciences, Tilžės str. 18, Kaunas 47181, Lithuania; Department of Preventive Medicine, Faculty of Public Health, Lithuanian University of Health Sciences, Tilžės str. 18, Kaunas 47181, Lithuania.
Shannon Lange, Institute for Mental Health Policy Research, Centre for Addiction and Mental Health, 33 Ursula Franklin Street, Toronto, Ontario M5S 2S1, Canada; Campbell Family Mental Health Research Institute, Centre for Addiction and Mental Health, Ursula Franklin Street 33, Toronto, OntarioM5S 3M1, Canada.
Pol Rovira, Program on Substance Abuse, Public Health Agency of Catalonia, 81-95 Roc Boronat St., Barcelona 08005, Spain.
Jürgen Rehm, Institute for Mental Health Policy Research, Centre for Addiction and Mental Health, 33 Ursula Franklin Street, Toronto, Ontario M5S 2S1, Canada; Epidemiology Division, Dalla Lana School of Public Health, University of Toronto, 155 College Street, Toronto, Ontario M5T 1P8, Canada; Campbell Family Mental Health Research Institute, Centre for Addiction and Mental Health, Ursula Franklin Street 33, Toronto, OntarioM5S 3M1, Canada; Program on Substance Abuse, Public Health Agency of Catalonia, 81-95 Roc Boronat St., Barcelona 08005, Spain; Institute of Clinical Psychology and Psychotherapy, Technische Universität Dresden, Chemnitzer Str. 46, Dresden 01187, Germany; Department of Psychiatry and Psychotherapy, Center for Interdisciplinary Addiction Research (ZIS), University Medical Center Hamburg-Eppendorf (UKE), Martinistraße 52, Hamburg 20246, Germany; Faculty of Medicine, Institute of Medical Science, University of Toronto, Medical Sciences Building, 1 King’s College Circle, Room 2374, Toronto, Ontario M5S 1A8, Canada; Department of Psychiatry, University of Toronto, 250 College Street, 8th floor, Toronto, Ontario M5T 1R8, Canada; Department of International Health Projects, Institute for Leadership and Health Management, I.M. Sechenov First Moscow State Medical University (Sechenov University), Trubetskaya Street 8, b. 2, Moscow 119991, Russian Federation.
FUNDING
Research reported in this publication was also supported by the (U.S.) National Institute on Alcohol Abuse and Alcoholism of the National Institutes of Health (NIAAA), grant number 1R01AA028224. This research was conducted as part of the project ‘Evaluation of the impact of alcohol control policies on morbidity and mortality in Lithuania and other Baltic states’ and we would like to thank the whole team for their input to wider discussions in generating the research reported in this paper. Content is the responsibility of the authors and does not reflect official positions of NIAAA or the National Institutes of Health.
CONFLICTS OF INTEREST STATEMENT
The authors declare no conflict of interest. The funders had no role in the design of the study; in the collection, analyses or interpretation of data; in the writing of the manuscript or in the decision to publish the results.
References
- Babor TF, Casswell S, Graham Ket al. (2022(forthcoming)) Alcohol: No Ordinary Commodity. Research and Public Policy. Oxford, UK: Oxford University Press. [Google Scholar]
- Beard E, Marsden J, Brown Jet al. (2019) Understanding and using time series analyses in addiction research. Addiction 114:1866–84. [DOI] [PubMed] [Google Scholar]
- Carvalho AF, Heilig M, Perez Aet al. (2019) Alcohol use disorders. The Lancet 394:781–92. [DOI] [PubMed] [Google Scholar]
- Chisholm D, Moro D, Bertram Met al. (2018) Are the "best buys" for alcohol control still valid? An update on the comparative cost-effectiveness of alcohol control strategies at the global level. J Stud Alcohol Drugs 79:514–22. [PubMed] [Google Scholar]
- Churchill S, Angus C, Purshouse Ret al. (2020) Expanding attributable fraction applications to outcomes wholly attributable to a risk factor. Stat Methods Med Res 29:2637–46. [DOI] [PubMed] [Google Scholar]
- Cicėnienė V, Mekšriūnaitė S, Malinauskienė Net al. (2019) Medicininio Mirties Liudijimo Pildymas: Metodinės rekomendacijos [Online]. Vilnius, Lithuania: Higienos Institutas. https://hi.lt/uploads/pdf/padaliniai/MPR/mml:rekomendacijos.pdf (20 December 2021, date last accessed). [Google Scholar]
- Fogarty J. (2010) The demand for beer, wine and spirits: a survey of the literature. J Econ Surv 24:428–78. [Google Scholar]
- Global Health Data Exchange . (2020) Global Burden of Disease Study 2019 (GBD 2019) Cause List Mapped to ICD Codes [Online]. Seattle, Washington: Institute for Health Metrics and Evaluation. http://ghdx.healthdata.org/record/ihme-data/gbd-2019-cause-icd-code-mappings (21 December 2021, date last accessed). [Google Scholar]
- Hastie TJ, Tibshirani RJ. (1990) Generalized additive models. Boca Raton: CRC Press. [Google Scholar]
- Hoerl AE, Kennard RW. (1970) Ridge regression: biased estimation for nonorthogonal problems. Dent Tech 12:55–67. [Google Scholar]
- Jiang H, Tran A, Gmel Get al. (2021) How to quanitfy deaths averted derived from interrupted time-series analyses. MedRxiv [Online]. https://www.medrxiv.org/content/10.1101/2021.03.23.21254181v1.article-info2 August 2021, date last accessed. [Google Scholar]
- Kehoe T, Gmel G, Shield KDet al. (2012) Determining the best population-level alcohol consumption model and its impact on estimates of alcohol-attributable harms. Popul Health Metr 10:6. doi: 10.1186/1478-7954-10-6. [DOI] [PMC free article] [PubMed] [Google Scholar]
- Lithuanian Department of Statistics . (2021a) Official Data Portal. Amount of Alcoholic Beverages Sold in Trade and Catering Enterprises per Capita [Online]. Vilnius, Lithuania: Lithuanian Department of Statistics https://osp.stat.gov.lt/statistiniu-rodikliu-analize#/ (13 August 2021, date last accessed).
- Lithuanian Department of Statistics . 2021b. Official Data Portal. Legal Alcohol Consumption per Person Aged 15 and Older [Online]. Vilnius, Lithuania: Lithuanian Department of Statistics https://osp.stat.gov.lt/statistiniu-rodikliu-analize#/ (10 August 2021, date last accessed).
- Lithuanian Department of Statistics . 2021c. Official Statistics Portal. Resident Population at the Beginning of the Year [Online]. Vilnius, Lithuania: Lithuanian Department of Statistics https://osp.stat.gov.lt/statistiniu-rodikliu-analize#/ (21 December 2021, date last accessed).
- Manthey J, Shield KD, Rylett Met al. (2019) Global alcohol exposure between 1990 and 2017 and forecasts until 2030: a modelling study. The Lancet 393:2493–502. [DOI] [PubMed] [Google Scholar]
- Manthey J, Hassan SA, Carr Set al. (2021) Estimating the economic consequences of substance use and substance use disorders. Expert Rev Pharmacoecon Outcomes Res. 21:869–876. 10.1080/14737167.2021.1916470. [DOI] [PubMed] [Google Scholar]
- Miščikienė L, Goštautaitė Midttun N, Galkus Let al. (2020) Review of the Lithuanian alcohol control legislation in 1990–2020. Int J Environ Res Public Health 17:3454. [DOI] [PMC free article] [PubMed] [Google Scholar]
- Nelson JP. (2013) Meta-analysis of alcohol price and income elasticities–with corrections for publication bias. Health economics review 3:1–10. [DOI] [PMC free article] [PubMed] [Google Scholar]
- Nelson JP, Moran JR. (2020) Effects of alcohol taxation on prices: a systematic review and meta-analysis of pass-through rates. BE J Econ Anal Policy 20:1–21. [Google Scholar]
- OECD . (2021) Preventing Harmful Alcohol Use [Online]. https://www.oecd.org/health/preventing-harmful-alcohol-use-6e4b4ffb-en.htm (30 July 2021, date last accessed).
- Ornstein SI, Levy D. (1983) Price and income elasticities of demand for alcoholic beverages. In Recent Developments in Alcoholism: An Official Publication of the American Medical Society on Alcoholism, the Research Society on Alcoholism, and the National Council on Alcoholism. American Medical Society on Alcoholism, the Research Society on Alcoholism, and the National Council on Alcoholism. 1:303–345. 10.1007/978-1-4613-3617-4_18 [DOI] [PubMed] [Google Scholar]
- Puffer RR, Griffith GW. (1967) Patterns of Urban Mortality: Report of the Inter-American Investigation of Mortality; Report of the Inter-American Investigation of Mortality, Washington, D.C.: Pan American Health Organization.
- Rabinovich L, Brutscher P-B, De Vries Het al. (2009) The Affordability of Alcoholic Beverages in the European Union: Understanding the link between Alcohol Affordability, Consumption and Harms. Cambridge, UK: RAND Corporation. [Google Scholar]
- Rehm J, Hasan OS. (2020) Is burden of disease differentially linked to spirits? A systematic scoping review and implications for alcohol policy. Alcohol 82:1–10. [DOI] [PubMed] [Google Scholar]
- Rehm J, Imtiaz S. (2016) A narrative review of alcohol consumption as a risk factor for global burden of disease. Subst Abuse Treat Prev Policy 11:1–12. [DOI] [PMC free article] [PubMed] [Google Scholar]
- Rehm J, Purshouse RC. (2021) Causality and initiation of alcohol control policy. A response to Allamani. Drug Alcohol Rev 40:1389–91. [DOI] [PMC free article] [PubMed] [Google Scholar]
- Rehm J, Sulkowska U, Mańczuk Met al. (2007) Alcohol accounts for a high proportion of premature mortality in central and eastern Europe. Int J Epidemiol 36:458–67. [DOI] [PubMed] [Google Scholar]
- Rehm J, Kehoe T, Gmel Get al. (2010) Statistical modeling of volume of alcohol exposure for epidemiological studies of population health: the US example. Popul Health Metr 8:1–12. [DOI] [PMC free article] [PubMed] [Google Scholar]
- Rehm J, Marmet S, Anderson Pet al. (2013) Defining substance use disorders: do we really need more than heavy use? Alcohol Alcohol 48:633–40. [DOI] [PubMed] [Google Scholar]
- Rehm J, Gmel GE Sr, GMEL Get al. (2017a) The relationship between different dimensions of alcohol use and the burden of disease—an update. Addiction 112:968–1001. [DOI] [PMC free article] [PubMed] [Google Scholar]
- Rehm J, Hasan OSM, Imtiaz Set al. (2017b) Quantifying the contribution of alcohol to cardiomyopathy: a systematic review. Alcohol 61:9–15. [DOI] [PubMed] [Google Scholar]
- Rehm J, Rovira P, Llamosas-Falcón Let al. (2021a) Dose–response relationships between levels of alcohol use and risks of mortality or disease for all people, by age, sex and specific risk factors. Nutrients 13:2652. [DOI] [PMC free article] [PubMed] [Google Scholar]
- Rehm J, Štelemėkas M, Ferreira-Borges Cet al. (2021b) Classifying alcohol control policies with respect to expected changes in consumption and alcohol-attributable harm: the example of Lithuania, 2000–2019. Int J Environ Res Public Health 18:2419. [DOI] [PMC free article] [PubMed] [Google Scholar]
- Rockhill B, Newman B, Weinberg C. (1998) Use and misuse of population attributable fractions. Am J Public Health 88:15–9. [DOI] [PMC free article] [PubMed] [Google Scholar]
- Rovira P, Belian G, Ferreira-Borges Cet al. (2021a) Alcohol taxation, alcohol consumption and cancers in Lithuania: a case study. Nordic Studies on Alcohol and Drugs [Epub ahead of print Jun 28] doi: 10.1177/14550725211021318. [DOI] [PMC free article] [PubMed] [Google Scholar]
- Rovira P, Kilian C, Neufeld Met al. (2021b) Fewer cancer cases in 4 countries of the WHO European region in 2018 through increased alcohol excise taxation: a modelling study. Eur Addict Res 27:189–97. [DOI] [PMC free article] [PubMed] [Google Scholar]
- Shang C, Ngo A, Chaloupka FJ. (2020) The pass-through of alcohol excise taxes to prices in OECD countries. Eur J Health Econ 21:855–67. [DOI] [PMC free article] [PubMed] [Google Scholar]
- Shield KD, Rehm J. (2015) Russia-specific relative risks and their effects on the estimated alcohol-attributable burden of disease. BMC Public Health 15:1–10. [DOI] [PMC free article] [PubMed] [Google Scholar]
- Shield K, Manthey J, Rylett Met al. (2020) National, regional, and global burdens of disease from 2000 to 2016 attributable to alcohol use: a comparative risk assessment study. Lancet Public Health 5:e51–61. [DOI] [PubMed] [Google Scholar]
- Sornpaisarn B, Shield K, Cohen Jet al. (2013) Elasticity of alcohol consumption, alcohol-related harms, and drinking initiation in low-and middle-income countries: a systematic review and meta-analysis. Int J Alcohol Drug Res 2:45–58. [Google Scholar]
- Sornpaisarn B, Shield KD, Österberg Eet al. (2017) Resource Tool on Alcohol Taxation and Pricing Policies. Geneva: World Health Organization and others. [Google Scholar]
- Štelemėkas M, Manthey J, Badaras Ret al. (2021) Alcohol control policy measures and all-cause mortality in Lithuania: an interrupted time-series analysis. Addiction 116:2673–84. [DOI] [PMC free article] [PubMed] [Google Scholar]
- Wagenaar AC, Salois MJ, Komro KA. (2009) Effects of beverage alcohol price and tax levels on drinking: a meta-analysis of 1003 estimates from 112 studies. Addiction 104:179–90. [DOI] [PubMed] [Google Scholar]
- Wagenaar AC, Tobler AL, Komro KA. (2010) Effects of alcohol tax and price policies on morbidity and mortality: a systematic review. Am J Public Health 100:2270–8. [DOI] [PMC free article] [PubMed] [Google Scholar]
Associated Data
This section collects any data citations, data availability statements, or supplementary materials included in this article.