

Abstract
A method for estimating denitrification and nitrogen fixation simultaneously in coastal sediments was developed. An isotope-pairing technique was applied to dissolved gas measurements with a membrane inlet mass spectrometer (MIMS). The relative fluxes of three N2 gas species (28N2, 29N2, and 30N2) were monitored during incubation experiments after the addition of 15NO3−. Formulas were developed to estimate the production (denitrification) and consumption (N2 fixation) of N2 gas from the fluxes of the different isotopic forms of N2. Proportions of the three isotopic forms produced from 15NO3− and 14NO3− agreed with expectations in a sediment slurry incubation experiment designed to optimize conditions for denitrification. Nitrogen fixation rates from an algal mat measured with intact sediment cores ranged from 32 to 390 μg-atoms of N m−2 h−1. They were enhanced by light and organic matter enrichment. In this environment of high nitrogen fixation, low N2 production rates due to denitrification could be separated from high N2 consumption rates due to nitrogen fixation. Denitrification and nitrogen fixation rates were estimated in April 2000 on sediments from a Texas sea grass bed (Laguna Madre). Denitrification rates (average, 20 μg-atoms of N m−2 h−1) were lower than nitrogen fixation rates (average, 60 μg-atoms of N m−2 h−1). The developed method benefits from simple and accurate dissolved-gas measurement by the MIMS system. By adding the N2 isotope capability, it was possible to do isotope-pairing experiments with the MIMS system.
Denitrification and nitrogen fixation are important counteractive processes affecting nitrogen dynamics in coastal sediments. Phytoplankton production can be limited by nitrogen availability (35), and sediments often serve as an important source of dissolved inorganic N (calculated as NH4+ + NO2− + NO3−). Denitrification is the only biological process that transforms combined N to gaseous forms (N2 or N2O) (36, 37). These gaseous end products are unavailable to most producers (e.g., phytoplankton and bacteria) unless N2 is transformed into organic N during nitrogen fixation (12). Benthic denitrification is a significant sink for combined N in systems and may drive systems toward N limitation (37). Nitrogen fixation increases the amount of biologically available N (7, 38, 42).
Despite the important role of denitrification in coastal and open ocean systems, accurate measurement is hindered by high background levels of N2 gas in the atmosphere and water column (1, 8, 9, 18, 20, 24, 30, 32, 39, 40). Isotope pairing and membrane inlet mass spectrometry (MIMS) techniques have improved the accuracy and precision of denitrification measurements (4, 15, 16, 25, 28, 29, 33).
The isotope-pairing technique developed by Nielsen (29) estimates denitrification by monitoring changes in nitrogen gas with different isotope compositions (29N2 = 14N + 15N, 30N2 = 15N + 15N) after enriching the overlying water with 15NO3−. The 28N2 (14N + 14N) production rate was calculated from the relative 29N2 and 30N2 production rates (4, 28, 29, 33). Avoiding the measurement of 28N2 reduced the possibility of contamination. A model simulation showed that the modified gradient created by 15NO3− addition has a minimal effect on in situ denitrification rates (26).
Quadruple mass spectrometers have been linked with a MIMS to enhance measurement of dissolved gases (15). The MIMS improved the accuracy of dissolved gas measurement and decreased chances of contamination. Observing the change in ratio between N2 and Ar measured with the MIMS provides a sensitive and convenient determination of net denitrification rates (8, 15), but measured N2 flux is a net result of production (denitrification) and consumption (nitrogen fixation).
Nitrogen fixation is a process mediated by microbes that convert N2 to organic nitrogen. Benthic nitrogen fixation can increase nitrogen availability for biological production in coastal regions (7, 38, 42). Nitrogen fixation rates are low in most coastal sediments, except for areas covered by microbial mats or sea grass beds. Simultaneous measurements of denitrification and nitrogen fixation are desirable, but such data are not common. A method to measure both processes in the same sample is needed to quantify the two processes in situations where both may be important.
Available methods for nitrogen fixation measurement require certain assumptions and have shortcomings (25, 38). A common method for nitrogen fixation measurement is an acetylene (C2H2) reduction assay (10). Nitrogen fixers do not discriminate between C2H2 and N2 as substrates during nitrogen fixation. Although simple, inexpensive, and sensitive, this technique requires a conversion constant relating the ethylene production rate to the N2 reduction rate (theoretical ratio = 3 mol of acetylene per 1 mol of N2 reduction) (38). The ratio varies and is affected by environmental conditions (38).
We expanded the capability of the MIMS system (15) to measure different isotopic forms of N2 gas (29N2 and 30N2) relative to Ar (S. An and W. S. Gardner, submitted for publication), for isotope-pairing experiments with the MIMS system. By comparing fluxes of three N2 gas species (28N2, 29N2, and 30N2), production (denitrification) and consumption (nitrogen fixation) rates for N2 gas could be measured at the same time. Here, we report the methodology and formulas developed for the simultaneous estimation of the two processes. Procedures for determining the different isotopic forms of N2 gas (29N2 and 30N2) using the MIMS and testing of the method are described . In a “potential-denitrification” experiment, conditions were optimized for denitrification measurements and fluxes for the three forms of N2 gas were observed. The sensitivities of the MIMS system for three isotopic forms of N2 were evaluated by comparing measured fluxes with expected production rates for each gas. A second experiment measured rates in algal mat sediments where nitrogen fixation was expected. The method differentiated and quantified both denitrification and total nitrogen fixation (net N2 change + denitrification) rates. Finally, rates of denitrification and nitrogen fixation were measured on intact sediment cores from Laguna Madre, Texas. Assumptions and problems associated with the method are discussed.
MATERIALS AND METHODS
(i) Formulas.
The 28N2 production rate estimated from the isotope-pairing technique should match the 28N2 production rate estimated from direct methods (for example, MIMS) in cores where no nitrogen fixation occurs. The proportional changes in three N2 species with time after 15NO3− addition can be predicted under such conditions. If nitrogen fixation occurs, however, predicted changes in the proportion of the three N2 species with time will not match the measured changes. The difference between predicted and measured proportional changes of the three N2 species can reflect nitrogen fixation and denitrification rates.
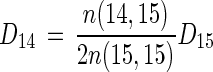
In the isotope-pairing technique (29), denitrification rates based on the added 15NO3− (D15) are calculated as follows:
 |
1 |
where n(15,15) is the net 30N2 production rate and n(14,15) is the net 29N2 production rate, and
 |
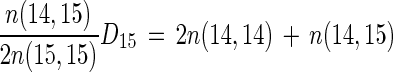
2 |
where D14 is the rate of denitrification based on 14NO3−, and
 |
3 |
The rate of denitrification based on 14NO3− (D14) calculated by the isotope-pairing technique should equal the net 28N2 production rate [n(14,14)] plus the amount of 14N in 29N2 when nitrogen fixation (f) is zero, or
 |
4 |
That is (from equations 2 and 4),
 |
5 |
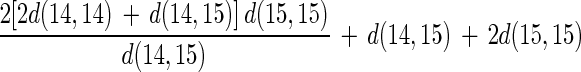
However, D14 (calculated from the isotope-pairing technique [equation 2]) can be larger than 2n(14,14) + n(14,15) if nitrogen fixation occurs. Since 28N2 is the most abundant among the three N2 gas species, the removal rate is the highest for 28N2 during nitrogen fixation. When nitrogen fixation coexists with denitrification, rates of N2 gas species are the result of the balance of production (denitrification) and consumption (nitrogen fixation); i.e., “gross” denitrification (d) is calculated as follows:
 |
6 |
where n is net N2 flux and f is gross nitrogen fixation (a positive number represents negative N2 flux). The relationship can be applied to the gross denitrification of each N2 species [d(14,14), d(14,15), and d(15,15)] as follows:
 |
7 |
 |
8 |
 |
9 |
If the three species of nitrogen gas (28N2, 29N2, and 30N2) are used in proportion to their concentration during nitrogen fixation (assuming no isotope fractionation), the gross nitrogen fixation based on each N2 species [f(14,14), f(14,15), and f(15,15)] can be represented as follows:
 |
10 |
 |
11 |
 |
12 |
where α is the abundance of 29N2 among three N2 gas species, β is the abundance of 30N2 among three N2 gas species, and (1 − α − β) is the abundance of 28N2 among three N2 gas species.
When f is greater than 0, equations 1 and 2 should be modified as follows:
 |
13 |
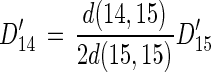 |
14 |
where D15′ is the rate of denitrification based on 15NO3 when f is greater than 0 and D14′ is the rate of denitrification based on 14NO3− when f is greater than 0.
Here again, D14′ (calculated from the isotope-pairing technique) should equal gross 28N2 production plus 14N in gross 29N2 flux (see equation 4).
 |
15 |
Equations 13, 14, and 15 are combined to give an equation with regard to d(14,14), d(14,15), and d(15,15), as follows:
 |
16 |
The MIMS system can measure n(14,14), n(14,15), n(15,15), α, and β. Applying the measured numbers, we have four equations (equations 7, 8, 9, and 16) to be solved with four unknowns [f, d(14,14), d(14,15), and d(15,15)]. By solving the equations, denitrification (D14′ and D15′) and nitrogen fixation rates (f) can be derived. Equations 7, 8, 9, and 16 become a quadratic equation with regard to f.
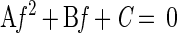 |
17 |
where A = 4β(1 − α − β) − α2, B = 4β n(14,14) + 4(1 − α − β) n(15,15) − 2α n(14,15), and C = 4 n(14,14)n(15,15) − n(14,15)2.
The solutions are
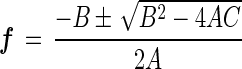 |
18 |
The positive solution estimates nitrogen fixation. The Appendix gives some sample calculations. The “no nitrogen fixation case” is illustrated in case 1. In this situation, total denitrification is a sum of three net N2 fluxes. When nitrogen fixation exists (case 2), however, the nitrogen fixation rate is added to the net fluxes of three N2 gases to obtain the total denitrification rate (see the Appendix).
(ii) Dissolved 29N2 and 30N2 measurements with the MIMS system.
We modified the method of Kana et al. (15) to measure dissolved 29N2 and 30N2 in addition to Ar, O2, and 28N2. The 29N2 and 30N2 concentrations were obtained from the “excess” atomic mass unit (AMU) 29 and 30 signals, respectively, caused by the conversion of added 15NO3−. The ratio between 29N2 and 28N2 is 0.00732 (0.00366 × 2) in natural samples, since the natural abundance of 15N is 0.366% (23). The relationship between 29N2 and 28N2 in samples was obtained from 30-ppt artificial seawater (standard water) held at different temperatures (21 and 30°C) (Fig. 1a). The ratio in our MIMS system was close to the theoretical value (Fig. 1a), but it was calculated in each measurement to account for small variability between measurements. This relationship was used to determine the excess AMU 29 signal. The feed water in a flowthrough incubation experiment does not have excess AMU 29 signal resulting from 29N2, while outflow water has excess AMU 29 signal, indicating that 29N2 was produced during denitrification (Fig. 1a). The excess AMU 29 signal was converted to excess 29N2 concentration by comparing the results with those from standard water.
FIG. 1.

Relationships between different AMU signals in liquid samples measured with the quadruple mass spectrometer. Solid symbols, standard water (▪, 30 ppt, 21°C; ▴, 30 ppt, 30°C); open symbols, samples (□, outflow water; ○, inflow water). The line represents the regression among the standard water samples. The signal represents partial pressure of gases (in pascals [102]) inside the mass spectrometer. Data are from the work of An and Gardner (submitted).
Interpreting the AMU 30 signal in a MIMS system is complicated by reactions between N2 and O2 in the ion source of the mass spectrometer. The NO+ ions (AMU 30 signal) formed from N2 and O+ inside the mass spectrometer can cause a linear relationship between AMU 30 and (AMU 28 × AMU 32)0.5 (13). Note that (AMU 28 × AMU 32)0.5 exhibited a better regression with AMU 30 signal than did (AMU 28 × AMU 32) as suggested by Jensen et al. (13) (Fig. 1b). If oxygen (O) and nitrogen (N) atoms are combined randomly as N2, NO, and O2, and the proportions of O and N are p and q, respectively, then the proportions of the three products should show a binomial distribution (N2 = p2, NO = 2pq, O2 = q2) that explains the observed square root relationship of N2O2 with NO. This relationship was used to determine the excess AMU 30 signal in the water samples by comparing values with those for standard water (Fig. 1b).
The apparent N2/Ar ratios decrease with increasing O2 concentration because the O− ion scavenges N2 during the formation of NO− inside the MIMS system. Since the O2 concentrations of outflow water in our flowthrough system were lower than those of inflow water, uncorrected denitrification rates would be overestimated by the NO− effect. This effect was corrected by an O2 concentration versus N2 concentration relationship obtained from standard water sample measurements. Standard water samples (21°C, 30 ppt) saturated with atmospheric N2 and with various O2 concentrations were prepared by selectively removing dissolved O2 with known concentrations of sodium sulfite. During our flowthrough incubation experiments (see section iii, paragraphs b and c), the overestimation of denitrification rates should have been less than 3% because O2 concentrations of outflow water were maintained at over 80% of that for inflow water during sediment incubations. The O2 effect was not present in the closed-bottle experiments (see section iii, paragraph a), because O2 concentrations were low and similar in both control and experimental treatments.
(iii) Sediment incubation experiments.
The MIMS system was evaluated for measuring different N2 species in three sediment incubation experiments. The developed formulas were applied to data from each experiment to obtain denitrification and nitrogen fixation rates under different conditions.
(a) Potential denitrification bottle experiment.
A potential denitrification experiment was performed in closed bottles. Sediment slurries (20 ml) from a fresh water pond (Research Park, College Station, Tex.) were placed in serum bottles (120 ml). The bottles were filled with distilled water saturated with air at 21°C before the bottles were sealed with gas tight caps. The distilled water was enriched with glucose (final concentration = 2 mM) to provide a carbon source. Five treatments with different proportions of 14NO3− and 15NO3− (0 and 100%, 25 and 75%, 50 and 50%, 75 and 25%, and 100 and 0%) and a control (no NO3− added) were prepared. Total concentrations of nitrate in each treatment bottle were the same (32 μg-atoms of N bottle−1). Duplicate bottles were prepared for each treatment to give a total of 12 bottles. Each bottle was sealed so as to be gas tight with no headspace. Sediment slurries in the bottles were mixed well and then incubated at room temperature (21°C). After 24 h of incubation, dissolved gases from one bottle of each treatment (total of six) were measured with the MIMS system. Turbid sediment slurry samples were drawn into the membrane inlet tubes without filtration. Before measurements, the sediment slurry was mixed vigorously and large particles were allowed to settle out. The concentration of each nitrogen gas species was calculated as described above. After 48 h of incubation, the N2 forms in the remaining six bottles were measured. The total production of each N2 gas species was estimated by the concentration difference between each treatment and control.
(b) Algal mat sediment incubation.
Undisturbed sediment cores (12-cm diameter, 30-cm length) with bottom water were collected in a shallow salt marsh area with algal mats near Port Aransas, Tex., in April 2000. The cores were transported to a temperature-controlled incubation room (21°C), and a flowthrough plunger with Teflon inlet and outlet tubes was installed over each sediment core. The flowthrough chamber setup consisted of an intake water vessel, Teflon flow tubes, a peristaltic pump, and a sample collection vessel (21). The bottom water collected from the site was passed over the core surface at a rate of 1.2 ml min−1. Duplicate sediment cores were incubated under four different treatment conditions (total of eight). For the GL treatment, flowthrough water was enriched with glucose (2 mM) and incubated in the light (∼300 microeinsteins m−2 s−1) to maximize N2 fixation rates. GD cores were enriched with glucose and incubated without light. NL cores were incubated in the light (∼300 microeinsteins m−2 s−1) without glucose enrichment. ND cores were incubated in the dark without glucose enrichment. Water column depth over the sediment was maintained at about 5 cm to give a water volume of ca. 570 ml in each core. Triplicate samples of feed water and outlet water were collected at intervals for dissolved-gas analysis after an initial incubation period of 1 day, to allow steady-state conditions to develop (21). Water samples were collected for analysis of dissolved inorganic nitrogen compounds (NH4+, NO3−, and NO2−).
After sampling on the second day, feed water was enriched with 15NO3− and concentrations of 28N2, 29N2, and 30N2 were measured in inflow and outflow waters. Denitrification and nitrogen fixation rates for each sediment core were calculated using equations 17 and 18. Sediment flux of each chemical compound was calculated based on the concentration difference between feed water and outflow water, flow rate, and cross-sectional area (21). Measurements were made on days 1, 2, 3, 4, and 7.
(c) Sediment core incubations with shallow estuarine sediments.
The flowthrough incubation experiment was repeated with sediment cores from Laguna Madre, a shallow, semienclosed estuary in the southeastern part of the Texas coast. Laguna Madre is a negative estuary where freshwater input is less than evaporation (water residence time = 1 year). The salinity is often more than 40 ppt and can vary annually up to 60 ppt (6). Laguna Madre stations had depths of 0.8 to 0.9 m and were populated with Thalassia testudinum (300 to 600 shoots m−2) (22). During our sampling period, salinity was lower than in earlier observations (6) and did not exceed 40 ppt. Bottom water was oxygenated at most stations due to wind-driven mixing. Sediment cores (four in each station) were collected from two sites (L155 and L189). Station details are described elsewhere (An and Gardner, submitted). One half of the cores were incubated under dim light (∼30 microeinsteins m−2 s−1), and the others were covered with aluminum foil. The dim-light condition did not cause significant light effects, so data from the two treatments were combined. The 15NO3− was added after the day 1 samples were taken.
RESULTS AND DISCUSSION
(i) Potential denitrification experiment.
Most of the added nitrate was converted to N2 gas within 24 h. The average production rate of total N2 (28N2 + 29N2 + 30N2) was 28.6 (standard error [SE] = 1.5) μg-atoms of N bottle−1 day−1, accounting for 90% of the added nitrate (32 μg-atoms of N bottle−1). The concentrations of the three N2 species were similar after 48 h of incubation (27.9 ± 1.2 μg-atoms of N bottle−1). For calculations, the N2 species production was assumed to be completed at 24 h for both the 24- and 48-h-incubation samples. The production rates may have been higher than calculated because conversion of added nitrate to N2 gas may have occurred before 24 h.
The isotopic distribution of each N2 species end product matched the expected distribution based on the proportion of 14NO3− and 15NO3− species in the feed water (Fig. 2). Assuming that 14N and 15N bound randomly to form the N2 gas species, the production of 28N2, 29N2, and 30N2 would show binomial distribution (29). When the proportion of 15NO3− is p (and that for 14NO3− is 1 − p), the production rates of the N2 species would be calculated as follows: for 28N2, (1 − p)2; for 29N2, 2p(1 − p); and for 30N2, p2.
FIG. 2.

Production rates of N2 isotope species in a potential-denitrification experiment with sediments enriched with different proportions of 14NO3− and 15NO3−. The line represents the expected production rate of the three N2 isotope species based on the proportion of each NO3− species. Symbols represent measured production rates of three N2 gases (solid symbols, day 1; open symbols, day 2). Total amounts of NO3− were constant in each treatment (32 μmol bottle−1). About 90% of added NO3− was recovered as N2 gas in this experiment.
Although each treatment was designed to have 0, 25, 50, 75, and 100% 15NO3− enrichment (p), the background level of 14NO3− in the sediment caused the resulting 15NO3− proportions (0, 22, 44, 65, and 87%) to be less than the calculated values. The 14NO3− concentration in the control treatment was considered the background level of 14NO3− to estimate p in each treatment. The 28N2 flux was lower than expected at low p values and higher than expected at high p values (Fig. 2). This trend may have resulted from underestimating the background concentration of 14NO3−.
When the production rates of each N2 isotope species show expected distributions, the nitrogen fixation rates can be assumed to be zero. In this case, the denitrification rates obtained from the N2/Ar method should be identical to those from the isotope-pairing technique. The average measured nitrogen fixation rate was not exactly zero in this experiment but was a small negative number (average ± SE = −2.4 ± 0.81 μg-atoms of N bottle−1day−1). The number of replicates was not large enough to confirm statistically the zero nitrogen fixation condition observed in this experiment.
The isotope-pairing technique allowed estimation of denitrification rates produced from 14NO3− (D14′) and 15NO3− (D15′) (29). In our experiment, D14′ and D15′ showed the expected trends with the 15NO3−-to-14NO3− proportions (Fig. 3). Denitrification rates based on the D15′ increased as the proportion of 15NO3− increased. This result indicates that the excess AMU 29 signal and AMU 30 signal observed with the MIMS system for 29N2 and 30N2 concentration measurements is valid and the MIMS system has similar sensitivities for the three N2 gas species. In another MIMS system using a quadruple mass spectrometer, the instrumental response to 29N2 over 30N2 was close to 1 but larger (1.030) than the theoretical value (1.017 [13]). The sensitivity of each MIMS system for three N2 gas species may be determined in a bioassay experiment using cultured denitrification bacteria (13).
FIG. 3.

Denitrification based on 14NO3− (D14′) and 15NO3− (D15′) during potential denitrification experiment. Error bar represents 1 SE for two incubation bottles.
(ii) Sediment core incubations with algal mats.
An experiment was performed on sediments covered with an algal mat to evaluate the method in a nitrogen fixation environment (14, 43). Potential enhancers for the nitrogen fixation process, such as high light and a usable carbon source (11, 14, 25), were provided to some core samples. Before the 15NO3− addition (days 1 and 2), 28N2 fluxes into the sediment were observed with all treatments (Table 1), suggesting high nitrogen fixation rates. The lighted core without glucose (NL) had a higher negative flux than dark cores without glucose (ND). The glucose-enriched cores (GD and GL) had higher negative N2 fluxes than treatments without glucose enrichments (ND and NL). The light effect was not obvious among glucose-enriched treatments (GD and GL). Sediment oxygen demand (SOD) was higher in dark (ND and GD) than light (NL and GL) treatments, suggesting active photosynthesis. The differences in SOD between dark and light cores were about 1,000 μmol of O2 m−2 h−1 and resemble typical benthic primary production rates reported for shallow coastal environments (31). The glucose effect on SOD was not observed before the 15NO3− addition.
TABLE 1.
Variations of N2 isotope species and O2 fluxes during a sediment incubation experiment
| Gas and treatmenta | Fluxb on day:
|
||||
|---|---|---|---|---|---|
| 1 | 2 | 3 | 4 | 7 | |
| 28N2 (μg-atom of N m−2 h−1) | |||||
| ND | −80 (5.2) | −58 (14) | 2.4 (22) | −30 (28) | −36 |
| NL | NA | −194 (28) | −148 (20) | −140 (60) | −366 (50) |
| GD | NA | −176 (28) | −200 (120) | −17 | −20 |
| GL | −72 (28) | −116 (34) | −520 | −420 (110) | −264 (16) |
| 29+30N2 (μg-atom of N m−2 h−1) | |||||
| ND | 12.4 (0.4) | 71 (18) | 90 | ||
| NL | 0.6 (0.3) | 2.2 (1.2) | 3.7 (3) | ||
| GD | 0.2 (1.5) | 11 | 13 | ||
| GL | 1.2 | 3.4 (1.4) | 3.3 (9) | ||
| O2 (μmol m−2 h−1) | |||||
| ND | −1,040 (20) | −1,300 (320) | −860 (60) | −1,200 (200) | −490 |
| NL | NA | −360 (130) | 1,200 (800) | 1,400 (900) | 4,500 (350) |
| GD | NA | −1,400 (240) | −1,050 (5) | −1,300 | −1,300 |
| GL | 240 (200) | −390 (200) | 460 | 480 (85) | 160 (640) |
See the text and Fig. 4 for explanations of the treatments.
Values are averages (SEs) from replicate cores (where no SE is given, replicate data were not available). Negative flux represents a flux into the sediment. Heavy nitrate (15NO3−) was added after day 2, and the 29+30N2 flux was measured from day 3. NA, not available.
After 15NO3− additions, the sediment produced O2 in light treatments, suggesting that photosynthesis was increased with added nitrate. Photosynthetic rates calculated from the SOD difference between light and dark treatments increased from 1,000 μmol of O2 m−2 h−1 before the addition to 1,500 to 5,000 μmol of O2 m−2 h−1 after the addition.
Light and dark cores showed different 28N2 and 29+30N2 fluxes. After the 15NO3− addition, negative 28N2 fluxes were higher in lighted cores than dark cores, suggesting light-enhanced nitrogen fixation activity. The 29+30N2 fluxes were higher in dark cores than in light ones (Table 1). The results agree with the light enhancement effect observed for nitrogen fixation (11, 14, 25) and suggest that denitrification was inhibited by high oxygen concentrations (3, 19). The 15NO3− uptake by primary producers would be higher in lighted versus dark cores, making the 15NO3− less available for denitrification and causing the 29+30N2 production to be lower in lighted cores. Increased oxygen penetration depth caused by benthic photosynthesis would reduce denitrification rates for the NO3− from the water column and cause reduced denitrification rates in lighted cores (33, 34). Benthic photosynthesis can enhance denitrification by increasing coupled nitrification-denitrification rates (2, 33). When O2 production is high, however, the inhibitory effect may dominate the enhancement effect (2, 33, 34).
Figure 4 shows calculated total denitrification (D14′ + D15′) and gross nitrogen fixation (f) rates after the 15NO3− additions. Denitrification rates were highest in ND cores and comparable to nitrogen fixation rates. Both denitrification and nitrogen fixation rates increased with time during the 7 days of incubation in the ND treatment. Denitrification rates in other treatments were low. Denitrification rates depended on O2 levels in these experiments. Benthic photosynthesis would be low in dark cores, and the O2 inhibition effect may be lower in dark than in light cores. The GD cores had higher denitrification rates than GL cores, but the denitrification rates were lower than those of ND cores (Table 1; Fig. 4).
FIG. 4.

Total denitrification (DNF) and nitrogen fixation (NF) rates under different light and carbon enrichment conditions. Data are averages ± SE for two sediment cores. Duplicate measurements were not available for day 4 and 7 of treatment GD and day 3 of treatment GL.
Nitrogen fixation rates measured in this experiment (32 to 390 μg-atoms of N m−2 h−1) are comparable to rates for other cyanobacterial mats (8 to 650 μg-atoms of N m−2 h−1 [11]). The highest nitrogen fixation rate occurred in GL cores (average ± SE = 390 ± 60 μg-atoms of N m−2 h−1). The NL cores also had high nitrogen fixation rates (220 ± 50 μg-atoms of N m−2 h−1), suggesting that nitrogen-fixing cyanobacteria were present in the cores. GD cores had higher nitrogen fixation rates (110 ± 50 μg-atoms of N m−2 h−1) than ND cores (32 ± 17 μg-atoms of N m−2 h−1). The observed glucose effect suggests the presence of heterotrophic nitrogen fixers as well as photoautotrophic cyanobacteria in the sediments (11, 27). The method presented here enables denitrification rates to be evaluated when nitrogen fixation is dominant and may provide a helpful tool for studying the complex interactions between nitrogen fixers and other microbial processes in algal mat communities (42, 43).
(iii) Sediment core incubation with shallow estuarine sediment.
The cores were maintained at near natural conditions except that the illuminated ones were maintained under continuous laboratory fluorescent lighting rather than natural outdoor light conditions. Although the water depths were shallow at the sampling stations, in situ light levels at the sediment-water interface were about 10% of the surface values due to high turbidity (S. An and W. S. Gardner, Nitrogen Cycling in Laguna Madre and Baffin Bay, final report to the Texas Water Development Board). The dim light treatment during our laboratory incubation tended to lower SOD compared to dark treatments, suggesting that some benthic primary production activity occurred at the sites. However, data from the two treatments were combined because light effects were not obvious in other processes.
Negative 28N2 fluxes (37 ± 10 μg-atoms of N m−2 h−1) were observed before the 15NO3− addition, suggesting that nitrogen fixation rates were higher than denitrification rates (Fig. 5A). Denitrification rates in these sediments have been limited by organic matter supply. Temporal 28N2 flux varied with water column chlorophyll concentrations (An and Gardner, submitted; An and Gardner, report to the Texas Water Development Board). The net flux was highest in April 1999 (∼130 μg-atoms of N m−2 h−1) and decreased in August 1999 (41 to 78 μg-atoms of N m−2 h−1) despite higher temperatures (An and Gardner, Nitrogen Cycling in Laguna Madre and Baffin Bay). During December 1999, a negative 28N2 flux was measured, indicating nitrogen fixation and low denitrification rates. The water column chlorophyll seemed to recover during January 2000, but denitrification rates continued to decrease in April 2000. Negative 28N2 fluxes increased from ∼20 μg-atoms of N m−2 h−1 in December 1999 to 37 μg-atoms of N m−2 h−1 in April 2000 (An and Gardner, report to Texas Water Development Board).
FIG. 5.

Nitrogen gas flux changes during sediment incubation experiments. The arrow shows the time at which 15NO3− was added. Total denitrification is calculated as 28N2 + 29N2 + 30N2 flux. Data are averages ± 1 SE for four replicate cores. Note the scale change in panel C.
The estimated denitrification rate was ∼20 μg-atoms of N m−2 h−1, about one-third of the nitrogen fixation rate. The fixation rate may have been underestimated in these cores because of dark or dim light conditions. About 98% of the denitrification was from the added 15NO3− rather than from 14NO3− (Fig. 5C). Considering that the sodium nitrate used in this study had 99% 15N and 1% 14N, it is possible that part of the 14NO3−-based denitrification may have resulted from added 14NO3− rather than from nitrification-coupled denitrification (29). The measured nitrogen fixation rate (∼60 μg-atoms of N m−2 h−1) is in the range of those reported for other sea grass beds. Sea grass beds can have higher nitrogen fixation rates (1 to 250 μg-atoms of N m−2 h−1) than uncolonized areas (0.02 to 5 μg-atoms of N m−2 h−1) (11). Potential rates of dissimilatory nitrate reduction to ammonium were also high in this region (An and Gardner, submitted). High nitrogen fixation activity together with high rates of dissimilatory nitrate reduction to ammonium may help sustain replete biota, including the Texas Brown Tide in this area (6; An and Gardner, submitted).
(iv) Sensitivity test.
To evaluate measurement errors associated with 29N2 and 30N2 measurement, dissolved-gas data for seawater (30 ppt) at different temperatures (30 and 21°C) measured over 4 days were combined (total n = 32). The average excesses of AMU 29 signal and AMU 30 signal were −0.00007 (SE = 0.0002) and 0.001 (SE = 0.001) μM, respectively. The amount of dissolved gases interfering with the 29N2 and 30N2 measurement is different in experimental samples than in standard water, and the measurement error is larger. For example, nitric oxide (NO) produced during denitrification would interfere with the AMU 30 signal measurement and cause the 30N2 flux to be overestimated (41). The formation of 13CO+ from CO2 also may interfere with 29N2 measurements (5). However, the excess AMU 29 signal and its variability in water samples prepared in different ways (different salinity, sulfite addition, or helium bubbling) were similar to those of standard water, suggesting that the interference of CO2 in 29N2 measurement was small.
The behaviors of estimated denitrification and nitrogen fixation rates were assessed by varying the 28N2, 29N2, and 30N2 fluxes in two experiments (Table 2). The error range of the flux measurements used in this practice (2%) may overestimate variability, since the precision of 28N2 measurement of the MIMS system is less than 0.05% (15) and NO is a minor intermediate product during denitrification. When coupled nitrification-denitrification was low and denitrification depended on the added 15NO3− (D14 ≪ D15), the estimation of denitrification and nitrogen fixation rates was not sensitive to the 29N2 flux measurement. An overestimation of 30N2 fluxes caused an overestimation of denitrification rates but did not affect nitrogen fixation rates. The 28N2 flux affected only nitrogen fixation rates in this situation. When the amount of D14 is similar to D15, small measurement errors in each flux can cause large changes in estimates of denitrification and nitrogen fixation. For example, the overestimation of 29N2 by 2% would cause an overestimation of nitrogen fixation by 70%. The overestimation of 30N2 and 28N2 fluxes caused about a 30% decrease in nitrogen fixation estimates in this example.
TABLE 2.
Sensitivity test for denitrification (DNF) and nitrogen fixation (NF) measurementsa
| Flux adjustment | Sensitivity (%) in:
|
|||
|---|---|---|---|---|
| Case 1
|
Case 2
|
|||
| DNF | NF | DNF | NF | |
| 29N2 | ||||
| −2% | 100 | 100 | 97 | 34 |
| +2% | 100 | 100 | 103 | 168 |
| 30N2 | ||||
| −2% | 98 | 100 | 101 | 134 |
| +2% | 102 | 100 | 99 | 67 |
| 28N2 | ||||
| −2% | 100 | 102 | 100 | 131 |
| +2% | 100 | 98 | 100 | 69 |
Each N2 isotope species flux was decreased and increased by 2% from the measured values, and resulting DNF and NF rates are presented as the percentage of the original values. In case 1, the 14NO3−-based DNF rate (D14′) is much smaller than the 15NO3−-based DNF (D15′) rate; in case 2, the two DNF rates are similar.
The sensitivity of the results depends on the absolute concentrations as well as fluxes of three N2 species and should be evaluated in each measurement. An independent measurement of interference gases may be necessary when the result is sensitive to flux data. The method relies on the accurate measurement of three N2 gas species. When one or more flux measurements are not accurate, all estimates will be affected. A high-resolution mass spectrometer can discriminate gases with the same masses but different origins (13). Independent measurement of interference gases or parallel measurements with the high-resolution mass spectrometer could be used to calibrate the MIMS measurements.
One of the most powerful features of the MIMS system in denitrification measurements is the direct introduction of the water sample (15). The accuracy of the measurement is enhanced by avoiding the dissolved-gas-stripping step. The ability of the MIMS system to measure dissolved gases in turbid water samples prevents manipulation errors. By adding the capability of measuring isotopes of N2 gas to the MIMS system, denitrification rates can be measured with an isotope-pairing technique. The simple and fast measurement procedure can be used in flowthrough and closed system sediment incubations.
ACKNOWLEDGMENTS
This study was supported by the Texas Water Development Board (contract 99-483-278; David Brock, project officer) and by the Nancy Lee and Perry Bass Regents Chair in Marine Science (held by W.S.G.).
We thank Mark McCarthy for technical assistance, Jay Brandes for advice, and Tracy Villareal for providing the environmental chamber for the second experiment.
Appendix
Some sample calculations with hypothetical 28N2, 29N2, and 30N2 production rates are presented below. See the text for explanations of each flux and constant.
Case 1. N fixation (f) = 0. For case 1, the following data were obtained with the MIMS system:
n(14,14) (net production rate of 28N2), 20 μmol of N2 m−2 h−1
n(14,15) (net production rate of 29N2) 12 μmol of N2 m−2 h−1
n(15,15) (net production rate of 30N2), 1.8 μmol of N2 m−2 h−1
α (proportion of 29N2 among three N2), 0.00628
β (proportion of 30N2 among three N2), 0.00159
The equation is
0.006293f2 + 7.120f = 0
The solutions are f = 0 and f = −1,131. Therefore, the nitrogen fixation rate is zero, and gross denitrification (d) is equal to net N2 flux (n).
The denitrification based on 14NO3− (D14′) is
2d(14,14) + d(14,15) = 2 × 20 + 12
= 52 μg-atoms of N m−2 h−1, or 26 μmol of N2 m−2 h−1
and total denitrification based on 15NO3− (D15′) is
2d(15,15) + d(14,15) = 2 × 1.8 + 12
= 15.6 μg-atoms of N m−2 h−1, or 7.8 μmol of N2 m−2 h−1
Case 2. N fixation (f) > 0. For case 2, the following data were obtained with the MIMS system:
n(14,14) (net production rate of 28N2), 15 μmol of N2 m−2 h−1
n(14,15) (net production rate of 29N2), 12 μmol of N2 m−2 h−1
n(15,15) (net production rate of 30N2), 1.8 μmol of N2 m−2 h−1
α (proportion of 29N2 among three N2), 0.00628
β (proportion of 30N2 among three N2), 0.00159
The equation is
0.006293f2 + 7.008f − 36 = 0
The solutions are f = 5.06 and f = −1,131.4. Therefore, the nitrogen fixation rate is 5.06 μmol of N2 m−2 h−1, and gross denitrification (d) is net N2 flux (n) plus N fixation (f).
The denitrification based on 14NO3− (D14′) is
2d(14,14) + d(14,15) = 2[n(14,14) + f(1 −α−β) + [n(14,15) + fα]
= 2[15 + 5.06 (1 − 0.00628 − 0.00159)] + (12 + 5.06 × 0.00628)
= 52.07 μg-atoms of N m−2 h−1, or 26.03 μmol of N2 m−2 h−1
and total denitrification based on 15NO3− (D15′) is
2d(15,15) + d(14,15) = 2[n(15,15) + fβ] + [n(14,15) + fα]
= 15.64 μg-atoms of N m−2 h−1, or 7.82 μmol of N2 m−2 h−1
Footnotes
This paper is UTMSI contribution 1169 and University of Maryland Center for Environmental Science contribution 3401.
REFERENCES
- 1.An S, Joye S B. An improved chromatographic method to measure nitrogen, oxygen, argon and methane in gas or liquid samples. Mar Chem. 1997;59:63–70. [Google Scholar]
- 2.An S, Joye S B. Enhancement of coupled nitrification-denitrification by benthic photosynthesis in shallow estuarine sediments. Limnol Oceanogr. 2001;46:42–47. [Google Scholar]
- 3.Anderson T K, Hensen M H, Sørensen J. Diurnal variation in nitrogen cycling in coastal marine sediments. I. Denitrification. Mar Biol. 1984;83:171–176. [Google Scholar]
- 4.Anette P, Risgaard-Petersen N, Revsbech N P. Denitrification and microphytobenthic NO3 consumption in a Danish lowland stream: diurnal and seasonal variation. Aquat Microb Ecol. 1997;12:275–284. [Google Scholar]
- 5.Bender L M, Tans P P, Ellis T, Orchardo J, Habfast K. A high precision isotope ratio mass spectrometer method for measuring the O2/N2 ratio of air. Geochim Cosmochim Acta. 1994;58:4751–4758. [Google Scholar]
- 6.Buskey E J, Wysor B, Hyatt C. The role of hypersalinity in the persistence of the Texas 'brown tide' in the Laguna Madre. J Plankton Res. 1998;20:1553–1565. [Google Scholar]
- 7.Capone D G. Benthic nitrogen fixation. In: Blackburn T H, Sørensen J, editors. Nitrogen cycling in coastal marine environments. New York, N.Y: Wiley; 1988. [Google Scholar]
- 8.Cornwell J C, Kemp W M, Kana T M. Denitrification in coastal ecosystems: methods, environmental controls and ecosystem level controls, a review. Aquat Ecol. 1999;33:41–54. [Google Scholar]
- 9.Devol A H. Direct measurement of nitrogen gas fluxes from continental shelf sediments. Nature. 1991;349:319–321. [Google Scholar]
- 10.Dilworth M J. Acetylene reduction by nitrogen-fixing preparations from Clostridium pasteurianum. Biochem Biophys Acta. 1966;127:285–294. doi: 10.1016/0304-4165(66)90383-7. [DOI] [PubMed] [Google Scholar]
- 11.Herbert R A. Nitrogen cycling in coastal marine ecosystems. FEMS Microbiol Rev. 1999;23:563–590. doi: 10.1111/j.1574-6976.1999.tb00414.x. [DOI] [PubMed] [Google Scholar]
- 12.Howarth R W, Marino R, Lane J. Nitrogen fixation in freshwater, estuarine and marine ecosystems. I. Rates and importance. Limnol Oceanogr. 1988;33:669–687. [Google Scholar]
- 13.Jensen K M, Jensen M H, Cox R P. Membrane inlet mass spectrometric analysis of N-isotope labeling for aquatic denitrification studies. FEMS Microbiol Ecol. 1996;20:101–109. [Google Scholar]
- 14.Joye S B, Paerl H W. Nitrogen cycling in microbial mats: rates and patterns of denitrification and nitrogen fixation. Mar Biol. 1994;119:285–295. [Google Scholar]
- 15.Kana T M, Darkangelo C, Hunt M D, Oldham J B, Bennett G E, Cornwell J C. Membrane inlet mass spectrometer for rapid high-precision determination of N2, O2, and Ar in environmental water samples. Anal Chem. 1994;66:4166–4170. [Google Scholar]
- 16.Kana T M, Sullivan M B, Cornwell J C, Groszkowski K. Denitrification in estuarine sediments determined by membrane inlet mass spectrometry. Limnol Oceanogr. 1998;43:334–339. [Google Scholar]
- 17.Kasper H F. Denitrification, nitrate reduction to ammonium and inorganic nitrogen pools in intertidal sediments. Mar Biol. 1983;74:133–139. [Google Scholar]
- 18.Koike I, Hattori A. Denitrification and ammonia formation in anaerobic coastal sediments. Appl Environ Microbiol. 1978;35:278–282. doi: 10.1128/aem.35.2.278-282.1978. [DOI] [PMC free article] [PubMed] [Google Scholar]
- 19.Koike I, Sørensen J. Nitrate reduction and denitrification in marine sediments. In: Blackburn T H, Sørensen J, editors. Nitrogen cycling in coastal marine environments. New York, N.Y: Wiley; 1988. [Google Scholar]
- 20.Lamontagne G M, Valiela I. Denitrification measurement by a direct N2 flux method in sediment of Waquoit Bay, MA. Biogeochemistry. 1995;31:63–83. [Google Scholar]
- 21.Lavrentyev P, Gardner W S, Yang L. Effects of the zebra mussel on microbial composition and nitrogen dynamics at the sediment-water interface in Saginaw Bay, Lake Huron. Aquat Microb Ecol. 2000;21:187–194. [Google Scholar]
- 22.Lee K, Dunton K H. Inorganic nitrogen acquisition in the seagrass Thalassia testudinum: development of a whole-plant nitrogen budget. Limnol Oceanogr. 1999;44:1204–1215. [Google Scholar]
- 23.Lide D R. CRC handbook of chemistry and physics. Boca Raton, Fla: CRC Press Inc.; 1992. [Google Scholar]
- 24.Luijn V F, Boers P C, Lijklema L. Comparison of denitrification rates in lake sediments obtained by the N2 flux method, the 15N isotope pairing technique and the mass balance approach. Water Res. 1996;30:893–900. [Google Scholar]
- 25.McGlathery K J, Risgaard-Petersen N, Christensen P B. Temporal and spatial variation in nitrogen fixation activity in the eelgrass Zostera marina rhizosphere. Mar Ecol Prog Ser. 1998;168:245–258. [Google Scholar]
- 26.Middelburg J J, Soetaert K, Herman P M J. Evaluation of the nitrogen isotope-pairing method for measuring benthic denitrification: a simulation analysis. Limnol Oceanogr. 1996;41:1839–1844. [Google Scholar]
- 27.Nedwell D, Aziz S. Heterotrophic nitrogen fixation in an intertidal salt marsh sediment. Estuar Coast Mar Sci. 1980;10:699–702. [Google Scholar]
- 28.Nielson L P, Glud R N. Denitrification in a coastal sediment measured in situ by the nitrogen isotope pairing technique applied to a benthic flux chamber. Mar Ecol Prog Ser. 1996;173:181–186. [Google Scholar]
- 29.Nielson L P. Denitrification in sediment determined from nitrogen isotope pairing. FEMS Microb Ecol. 1992;86:357–362. [Google Scholar]
- 30.Nowicki B L. The effect of temperature, oxygen, salinity, and nutrient enrichment on estuarine denitrification rates measured with a modified nitrogen gas flux technique. Estuar Coast Shelf Sci. 1994;38:137–156. [Google Scholar]
- 31.Pinckney J L, Zingmark R G. Modeling the annual production of intertidal benthic microalgae in estuarine ecosystems. J Phycol. 1993;29:396–407. [Google Scholar]
- 32.Risgaard-Peterson N, Nielsen L P, Blackburn T H. Simultaneous measurement of benthic denitrification, with the isotope pairing technique and the N2 flux method in a continuous flowthrough system. Water Res. 1998;32:3371–3377. [Google Scholar]
- 33.Risgaard-Peterson N, Rysgaard S, Nielsen L P, Revsbech N P. Diurnal variation of denitrification and nitrification in sediments colonized by benthic microphytes. Limnol Oceanogr. 1994;39:573–579. [Google Scholar]
- 34.Rysgaard S, Christensen P B, Nielsen L P. Seasonal variation in nitrification and denitrification in estuarine sediment colonized by benthic microalgae and bioturbating infauna. Mar Ecol Prog Ser. 1995;126:111–121. [Google Scholar]
- 35.Ryther J M, Dunston W M. Nitrogen, phosphorus and eutrophication in the coastal marine environment. Science. 1971;171:1008–1013. doi: 10.1126/science.171.3975.1008. [DOI] [PubMed] [Google Scholar]
- 36.Seitzinger S P. Denitrification in freshwater and coastal marine ecosystem: ecological and geochemical significance. Limnol Oceanogr. 1988;33:702–724. [Google Scholar]
- 37.Seitzinger S P. Denitrification in aquatic sediments. FEMS Symp. 1990;56:301–322. [Google Scholar]
- 38.Seitzinger S P, Garber J H. Nitrogen fixation and 15N2 calibration of the acetylene reduction assay in coastal marine sediments. Mar Ecol Prog Ser. 1987;37:65–73. [Google Scholar]
- 39.Seitzinger S P, Nixon S W, Pilson M E Q, Burke S. Denitrification and nitrous oxide production in near shore marine sediments. Geochim Cosmochim Acta. 1980;44:1853–1860. [Google Scholar]
- 40.Sørensen J. Capacity for denitrification and reduction of nitrate to ammonia in a coastal marine sediment. Appl Environ Microbiol. 1978;35:301–305. doi: 10.1128/aem.35.2.301-305.1978. [DOI] [PMC free article] [PubMed] [Google Scholar]
- 41.Sørensen J. Occurrence of nitric and nitrous oxides in a coastal marine sediment. Appl Environ Microbiol. 1978;36:809–813. doi: 10.1128/aem.36.6.809-813.1978. [DOI] [PMC free article] [PubMed] [Google Scholar]
- 42.Stal L J. Physiological ecology of cyanobacteria in microbial mats and other communities. New Phytol. 1995;131:1–32. doi: 10.1111/j.1469-8137.1995.tb03051.x. [DOI] [PubMed] [Google Scholar]
- 43.Stal L J, Behrens S B, Villbrandt M, Bergeikl S V, Kruyning F. The biogeochemistry of two eutrophic marine lagoons and its effect on microphytobenthic communities. Hydrobiologia. 1996;329:185–198. . Equations are as follows: [Google Scholar]