Abstract
Background
To explore the feasibility of the depth ratio method partitioning the lung parenchyma and the depth distribution of lung nodules in pulmonary segmentectomy.
Methods
Based on the measurement units, patients were allocated to the chest group, the lobar group, and the symmetrical 3 sectors group. In each unit, the center of the respective bronchial cross-section was set as the starting point (O). Connecting the O point with the center of the lesion (A) and extending to the endpoint (B) on the pleural, the radial line (OB) was trisected to divide the outer, middle, and inner regions. The depth ratio and relevant regional distribution were simultaneously verified using 2-dimensional (2D) coronal, sagittal, and axial computed tomography images and 3-dimensional (3D) reconstruction images.
Results
Two hundred and nine patients were included in this study. The median age was 53 (IQR, 44.5–62) years and 64 were males. The intra-group consistency of the depth ratio region partition was 100%. The consistency of the inter-group region partition differed among the three groups (Kappa values 0.511, 0.517, and 0.923). The chest group, lobar group, and symmetrical 3 sectors group had 69.4%, 26.3%, and 4.8% mediastinum disturbance, respectively (P<0.001).
Conclusions
The depth ratio method in the symmetrical 3 sectors of the lung maximally eliminated the disturbance of the mediastinal structures and more accurately trisected the lung parenchymal in 3D space. Sublobar resection based on subsegments strategy is feasible for outer 2/3 pulmonary nodules when depth ratio is used as the measurement method.
Keywords: Depth ratio, 3-dimensional partition, lung parenchyma
Introduction
The depth location of the lung nodule is an important factor in determining an individualized surgical strategy for early-stage lung cancer. There are more opportunities for sublobar resections in peripheral superficial early lung cancer (1). However, the definitions of peripheral and central pulmonary lesions are controversial. For example, in the American College of Chest Physicians (ACCP) guidelines, the outer 2/3 of the thoracic cavity is considered the periphery (2), while in the National Comprehensive Cancer Network (NCCN) and the European Society of Thoracic Surgeons (ESTS), the outer 1/3 of the pulmonary parenchymal is considered the periphery (3,4). In addition, the measurement details are inconsistent from one guide to another (5,6). Moreover, these methods are limited to the 2D level, and they are non-quantitative and subjective. Therefore, we need a quantitative method validated at the 3-dimensional level to measure the depth location of lung nodules.
In recent years, in the practice of performing pulmonary sublobar resections at our center, we have used the depth ratio method to quantitatively evaluate the depth location of the pulmonary nodules using the initial 2D computed tomography (CT) images, and the latest 3D reconstruction images. It is now reported as follows.
Methods
Participants
Patients who underwent pulmonary sublobar resection applying subsegment as anatomical unit (7) at our center from January 2016 to April 2019 were retrospectively analyzed. Patients met the following inclusion criteria: (I) maximum diameter of lung nodule ≤2 cm and ground-glass opacity (GGO) component ≥50%; (II) cutting margin ≥2 cm (8) or ≥ tumor diameter (9,10), (III) with complete information. Exclusion criteria: (I) unsatisfactory 3D reconstruction image; (II) with rare anatomical variations. The study was conducted in accordance with the Declaration of Helsinki (as revised in 2013). The study was approved by the Jiangsu Province Hospital and The First Affiliated Hospital of Nanjing Medical University Ethics Review Board (No. 2019-SR-450). Individual consent for this retrospective analysis was waived.
CT scan and 3D reconstruction
The scan was performed using a Siemens 64-slice dual-source CT (Somatom force, Siemens, Germany), a double-syringe power injector, and iopromide 370 (Bayer Healthcare Ltd.). The patient was placed in the supine position. The start time of the scanning and the injection dose of the contrast agent was set, and the time-density curves were then obtained by bolus injection. The scanning range included the whole lung field with the collimator thickness of 0.6 mm, the reconstructed layer thickness of 1 mm, and the interlayer spacing of 1 mm. The convolution kernel of reconstruction was the soft tissue algorithm (B30) (11). During the scan, the patient held his/her breath as instructed. After the acquisition of images, the volume data from the arterial and venous phases were transmitted to a reconstruction software workstation. The data were then converted into 3D-CTBA images (DeepInsight, Demo Version 21.0). A region-growing algorithm was used to reconstruct the pleurae (12).
Measurement unit
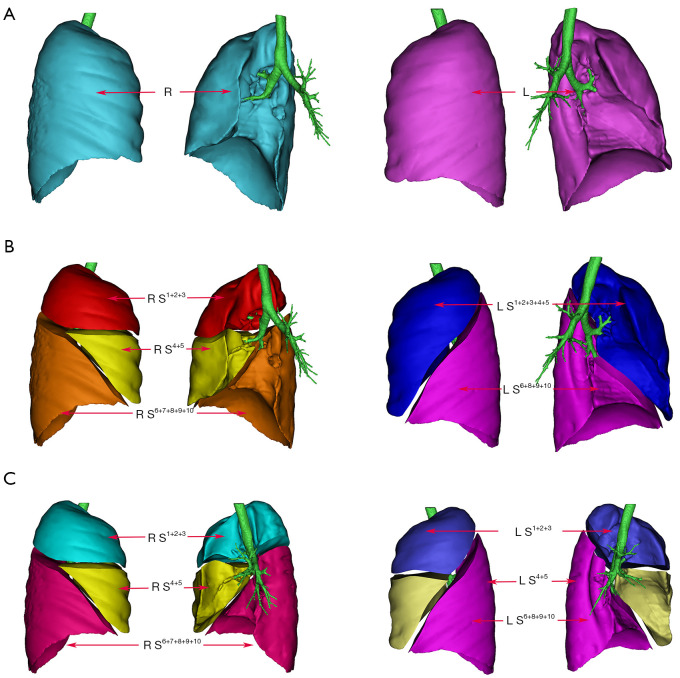
Three groups were specified according to the unit of measurement. In the chest group, the unilateral lung was measured wholly as a unit. In the lobar group, each lobe of the bilateral lungs was the measurement unit. In the symmetrical 3 sectors group, the upper right lobe and the left upper division segment were set as the superior unit, the right middle lobe, and the left lingular segments as the middle unit, the bilateral lower lobes each as a lower unit (see Figure 1).
Figure 1.
Schematic diagram of the measurement unit (rib view and mediastinal view). (A) The chest group: the unilateral lung was measured wholly as a unit; (B) the lobar group: upper right lobe (R S1+2+3), middle right lobe (R S4+5), lower right lobe (R S6+7+8+9+10), upper left lobe (L S1+2+3+4+5), and lower left lobe (L S6+8+9+10) each as a separate measurement unit; (C) the symmetrical 3 sectors group: the upper right lobe (R S1+2+3) and the left upper division segment (L S1+2+3) were set as the superior unit, the right middle lobe (R S4+5) and the left lingular segments (L S4+5) as the middle unit, bilateral lower lobes (R S6+7+8+9+10 and L S6+8+9+10) as the lower unit, respectively. R, right; L, left.
The depth ratio and corresponding partition of the outer, middle, and inner regions
In the above-mentioned measurement units, the bronchial cross-section center of each unit was set as the starting point (O) for measurement. By connecting the O point with the center of the lesion (A) and extending to the endpoint (B) on the pleural, the radial line OB was trisected into 0–33.3%, 33.4–66.6%, and 66.7–100%, respectively, corresponding to the outer, middle, and inner regions in the lung field, and the depth ratio (BA/BO) was calculated to determine the depth location of the lesion (see Figure 2).
Figure 2.
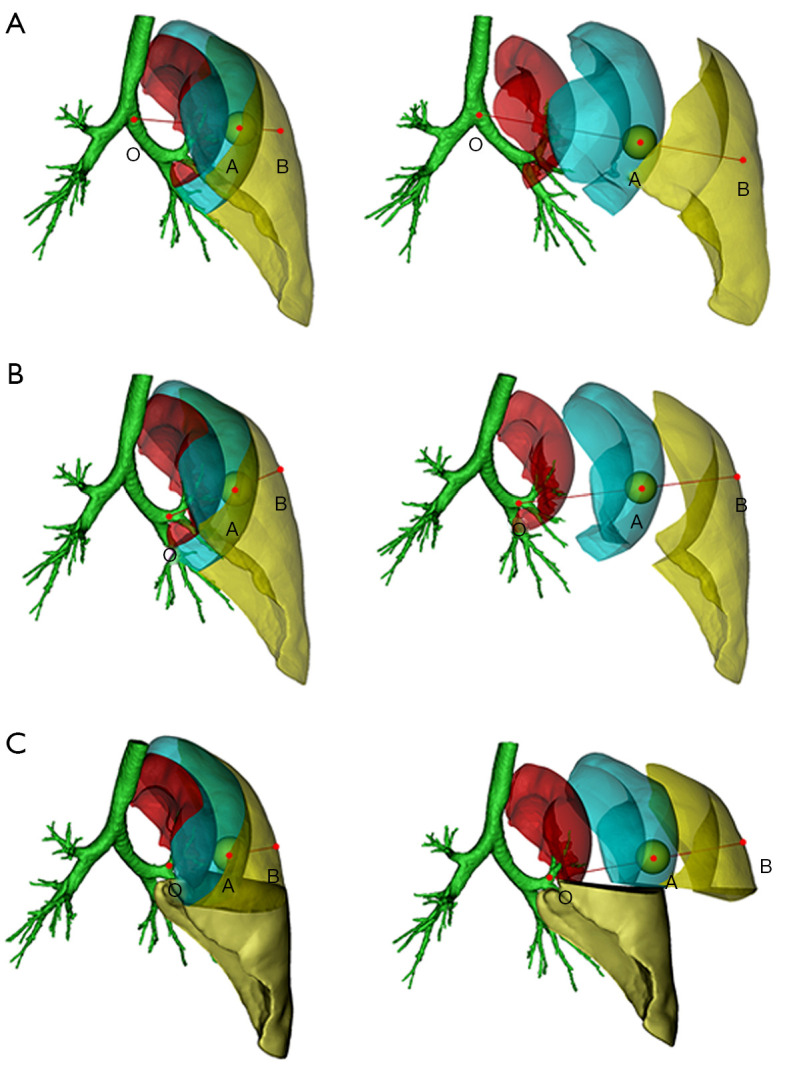
Illustration diagram of the outer, middle, and inner regions of the left upper lobe in the chest group, the lobar group, and the symmetrical 3 sectors group. (A) The chest group set the center of the left main bronchial opening section as the O point. (B) The lobar group set the center of the bronchial opening section of the left upper lung lobe as the O point. (C) The symmetrical 3 sectors group set the center of the left upper lung lingual segment bronchial opening section as the O point. All three groups took the center of the pulmonary nodule as point A and the intersection of the OA extension with the left upper lung visceral pleura as point B. The radial line (OB) was trisected to divide the outer (yellow), middle (teal), and inner (red) regions.
Specific measurement method in 2D coronal, sagittal, and axial CT images and 3D reconstruction images
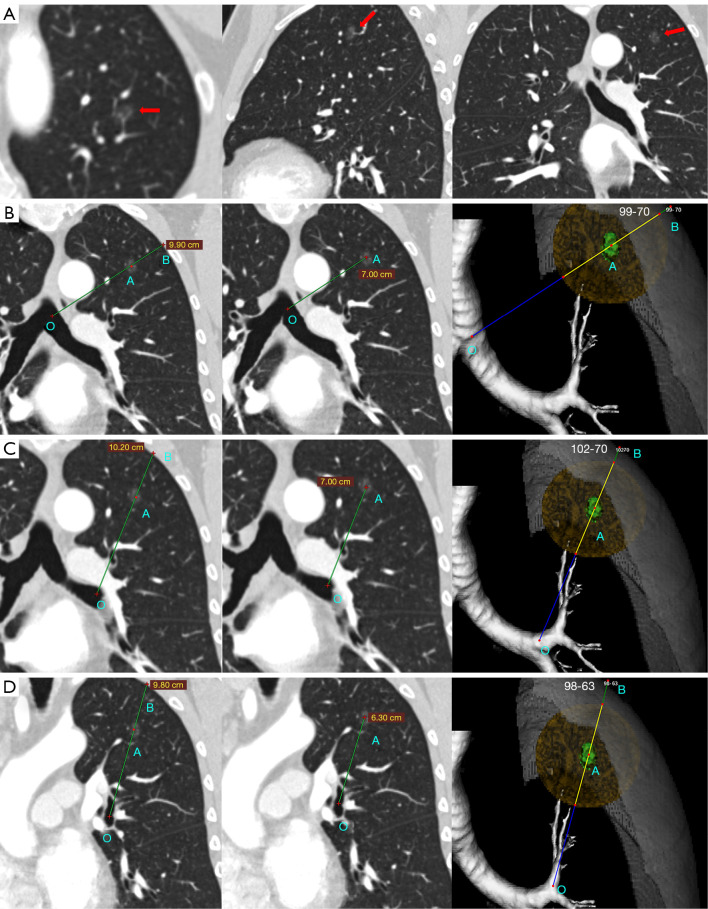
In the RadiAnt Viewer software (Medixant, Poland), the 2D coronal, sagittal, and axial CT images were observed simultaneously using the multiplanar reconstruction function. The nodule was first located in the axial image, and the center of the lesion was confirmed and locked in the coronal and sagittal images. By rotating the axes of the axial plane image, the unit of the lesion was determined in the coronal image, and the bronchial opening in the unit was further adjusted in the sagittal image. The starting point of the measurement was set according to the above criteria, and the depth ratio was calculated to determine the depth location of the lesion in the lung field. In the 3D reconstruction software DeepInsight, the bronchial opening of the measurement unit was confirmed by rotating the 3D image, and the center of the lesion was directly set to the center of the simulated sphere of the lesion. The subsequent measurements were consistent with those in the 2D image (see Figure 3 and Video 1). 2D and 3D measurements were performed by a senior radiologist and a senior thoracic surgeon, respectively. If there was any dispute, another thoracic surgeon joined the discussion and made a decision.
Figure 3.
A graphic example of actual measurement in 2D and 3D images. (A) Lung nodules in 2D coronal, sagittal, and axial CT images; (B) measurement of depth ratio in the chest group; (C) measurement of depth ratio in the lobar group; and (D) measurement of depth ratio in the symmetrical 3 sectors group. CT, computed tomography. O is the starting point of depth ratio measurement, A is the center of the lesion, and B is the intersection of the OA extension line with the pleura.
Video 1.
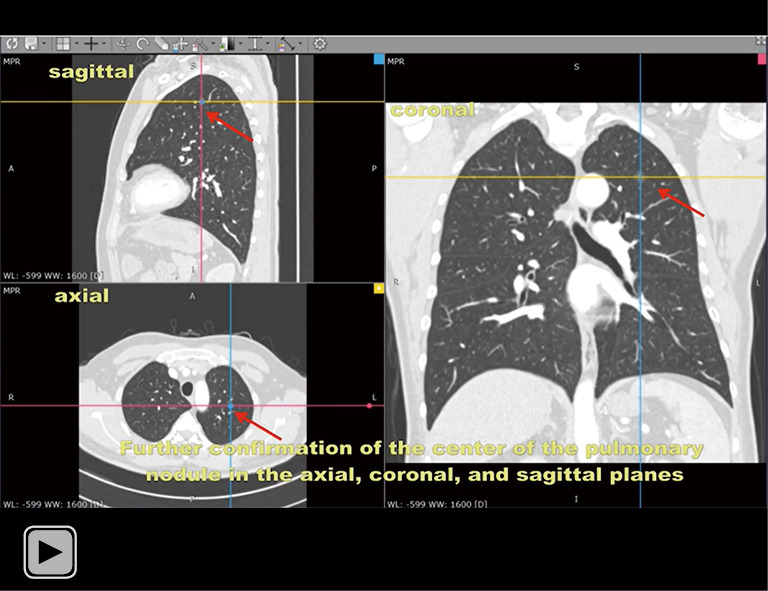
Demonstration of measurements in 2D and 3D software using the depth ratio method in the chest group, the lobar group, and the symmetric 3 sectors groups.
Statistical analysis
The statistical analysis was performed with SPSS (IBM SPSS Statistics, version 26.0), and GraphPad Prism (GraphPad Software, version 9.0). The continuous variables are presented as medians with interquartile ranges (IQRs), and the categorical variables are expressed as frequencies with percentages (%). An intraclass correlation coefficient (ICC) was used to determine the intra-group consistency of the depth ratio measurement values. The intra-group and inter-group agreement of partitioning results in the 2D and 3D images for the chest, lobar, and symmetrical 3 sectors groups were tested by Fleiss’s Kappa coefficient analysis. The Likelihood ratio test and chi-square test were used to analyze some categorical variables.
Results
Participant characteristics
Two hundred and nine patients (64 males and 145 females) with a median age of 53 years (IQR, 44.5–62 years) were included in this study. The median diameter of the lesions was 10.3 mm (IQR, 9.13–12.9 mm). There were 78 lesions in the right upper lobe, 2 in the right middle lobe, 39 in the right lower lobe, 58 in the left upper lobe, and 32 in the left lower lobe (see Table 1). Detailed distribution information of the lung nodules is listed in Table S1.
Table 1. Participant and nodule characteristics.
| Subjects | Overall |
|---|---|
| Age (year)† | 53 (44.5–62) |
| Sex, n [%] | |
| Men | 64 [31] |
| Women | 145 [69] |
| Nodule diameter (mm)† | 10.3 (9.13–12.9) |
| Nodule location, n [%] | |
| RUL | 78 [37] |
| RML | 2 [1] |
| RLL | 39 [19] |
| LUL | 58 [28] |
| LLL | 32 [15] |
| Image features on CT, n [%] | |
| GGO | 169 [81] |
| Part solid | 40 [19] |
†, data are medians, with interquartile ranges in parentheses. RUL, right upper lung; RML, right middle lung; RLL, right lower lung; LUL, left upper lung; LLL, left lower lung; GGO, ground-glass opacity.
Consistency of the depth ratio and corresponding partition in 2D coronal, sagittal, and axial CT images and 3D reconstruction Images
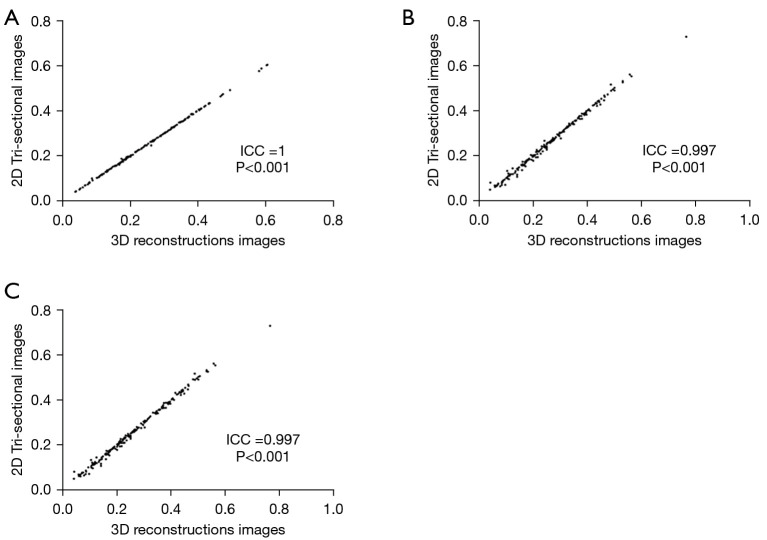
The scatter plot and ICC results indicated that in each measurement unit, the depth ratio in the 2D coronal, sagittal, and axial CT images was closely correlated with that of the 3D reconstructions images (chest group: ICC =1, P<0.001; lobar group: ICC =0.997, P<0.001; symmetrical 3 sectors group: ICC =0.997, P<0.001; Figure 4).
Figure 4.
Scatter plot and ICC correlation analysis of the depth ratio in 2D coronal, sagittal, and axial CT images (2D tri-sectional image), and 3D reconstruction images. (A) The chest group; (B) the lobar group; and (C) the symmetrical 3 sectors group. P value reported by intraclass correlation efficient. ICC, intraclass correlation coefficient.
According to the regional partition defined by the depth ratio method in both the 2D coronal, sagittal, and axial CT images and 3D reconstructed images, 0 inner nodules, 48 middle nodules, and 161 outer nodules were observed in the chest group, 1 inner nodule, 62 middle nodules, and 146 outer nodules were observed in the lobar group, and 1 inner nodule, 69 middle nodules, and 139 outer nodules were observed in the symmetrical 3 sectors group. A Fleiss’s Kappa coefficient analysis of all three groups indicated that the intra-group partition results derived from the depth ratio of the 2D coronal, sagittal, and axial CT images were positively consistent with the partition results derived from the depth ratio of the 3D reconstructed images (Fleiss’s Kappa value =1, P<0.001; see Table 2).
Table 2. Relationship between partition in 2D coronal, sagittal, and axial CT images and 3D reconstruction images.
| Group | 3D | Consistency (%) | Fleiss’s Kappa value | P value | ||
|---|---|---|---|---|---|---|
| Inner | Middle | Outer | ||||
| The chest group 2D | 1 | <0.001 | ||||
| Inner | 0 | 0 | 0 | 100 | ||
| Middle | 0 | 48 | 0 | 100 | ||
| Outer | 0 | 0 | 161 | 100 | ||
| The lobar group 2D | 1 | <0.001 | ||||
| Inner | 1 | 0 | 0 | 100 | ||
| Middle | 0 | 62 | 0 | 100 | ||
| Outer | 0 | 0 | 146 | 100 | ||
| The symmetrical 3 sectors group 2D | 1 | <0.001 | ||||
| Inner | 1 | 0 | 0 | 100 | ||
| Middle | 0 | 69 | 0 | 100 | ||
| Outer | 0 | 0 | 139 | 100 | ||
P value is reported by Fleiss’s kappa coefficient. 2D, two-dimensional; CT, computed tomography; 3D, three-dimensional.
Partition results of the chest, lobar, and symmetrical 3 sectors groups, and the relationship between the results
In our study, there were no statistical differences in the final partition results between the 3 groups (see Table S2; λ=7.234, P=0.124), but obvious deviations in the region partition were found in different measurement units. Among the 161 outer pulmonary nodules in the chest group, 27 became middle pulmonary nodules in the lobar group, and 31 became middle pulmonary nodules in the symmetrical 3 sectors group. Among the 48 middle pulmonary nodules in the chest group, 12 became outer pulmonary nodules and 1 became inner pulmonary nodule in the lobar group, and in the symmetrical 3 sectors group 9 became outer pulmonary nodules and 1 became inner pulmonary nodule. There was also some variation in the findings when comparing the lobar group to the symmetrical 3 sectors group; the 7 outer pulmonary nodes in the lobar group became the middle pulmonary nodes in the symmetrical 3 sectors group. Further, Fleiss’s Kappa coefficient analysis revealed that the Fleiss’s Kappa coefficients were 0.511 (95% CI: 0.507, 0.515; P<0.001) for the chest group and lobar groups, and 0.517 (95% CI: 0.513, 0.522; P<0.001) for the chest group and symmetrical 3 sector groups. The partition results of the chest group were in general accord with the lobar group and the symmetrical 3 sectors group. The Fleiss’s Kappa coefficient for the lobar group and symmetrical 3 sectors group was 0.923 (95% CI: 0.919, 0.928; P<0.001; see Table 3). The lobar group was more consistent with the symmetrical 3 sectors group.
Table 3. Consistency of partition results between the chest group, lobar group, and symmetrical 3 sectors group.
| Group | The chest group | The symmetrical 3 sectors group | |||||||||||
|---|---|---|---|---|---|---|---|---|---|---|---|---|---|
| Inner | Middle | Outer | Total | Fleiss’s Kappa value (95% CI) | P value | Inner | Middle | Outer | Total | Fleiss’s Kappa value (95% CI) | P value | ||
| The lobar group | |||||||||||||
| Inner | 0 | 1 | 0 | 1 | 0.511 (0.507, 0.515) | <0.001 | 1 | 0 | 0 | 1 | 0.923 (0.919, 0.928) | <0.001 | |
| Middle | 0 | 35 | 27 | 62 | 0 | 62 | 0 | 62 | |||||
| Outer | 0 | 12 | 134 | 146 | 0 | 7 | 139 | 146 | |||||
| Total | 0 | 48 | 161 | 209 | 1 | 69 | 139 | 209 | |||||
| The symmetrical 3 sectors group | |||||||||||||
| Inner | 0 | 1 | 0 | 1 | 0.517 (0.513, 0.522) | <0.001 | |||||||
| Middle | 0 | 38 | 31 | 69 | |||||||||
| Outer | 0 | 9 | 130 | 139 | |||||||||
| Total | 0 | 48 | 161 | 209 | |||||||||
P value is reported by Fleiss’s kappa coefficient. CI, confidence interval.
Interference of mediastinal structures in depth ratio measurements
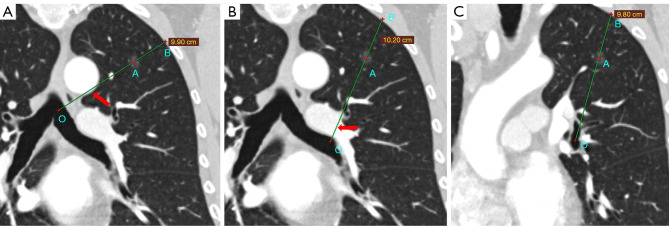
We found that the measurements in the 3 different groups were influenced by mediastinal structures to varying levels, which caused errors in the calculation of the depth ratio and the related region partition. Mediastinal factors affected 145 cases in the chest group, 55 cases in the lobar group, and only 10 cases in the symmetrical 3 sectors group. The chi-square test showed a statistically significant difference in the probability of being affected by the mediastinum in the three groups (χ2=202.986, P<0.001; see Table 4). The number of cases affected by the mediastinum in each group is shown in detail in Table S3, and the left upper lobe was observed to be the unit most affected by the mediastinum during measurement (see Figure 5).
Table 4. Analysis of nodes affected by the mediastinum in the chest, lobar, and symmetrical 3 sectors groups.
| Variables | The chest group (%) | The lobar group (%) | The symmetrical 3 sectors group (%) | χ2 | P value |
|---|---|---|---|---|---|
| Yes | 145 (69.4) | 55 (26.3) | 10 (4.8) | 202.986 | <0.001 |
| No | 64 (30.6) | 154 (73.7) | 199 (95.2) |
P values are reported by the chi-square test.
Figure 5.
Example of the effect of mediastinal structures. (A) The chest group, is affected by the aorta; (B) the lobar group, affected by the left pulmonary artery; and (C) the symmetrical 3 sectors group, without any effect. The red arrows indicate mediastinal influences in different measurement units in the same case. O is the starting point of depth ratio measurement, A is the center of the lesion, and B is the intersection of the OA extension line with the pleura.
Discussion
The depth location of early lung cancer is one of the most important factors for individualized surgery. For a pulmonary nodule, various surgical approaches are feasible when it is close to the pleura, and when it is deeper, subsegmentectomy, segmentectomy, or lobectomy is usually performed, but when it is further deeper, only lobectomy can be performed. The NCCN guidelines state that sublobar resection is feasible for early lesions in the peripheral of the lung parenchyma (3). However, the definition of peripheral pulmonary nodules is not consistent across guidelines (2-4).
In traditional X-ray images, the lung parenchyma is divided into the inner, middle, and outer zones vertically (13). For example, a peripheral lesion adjacent to the cardiophrenic angle would be classified as an inner nodule, but from a 3D perspective, its position may not be so. Some researchers have suggested that lesions located in the region of 4th or more distant bronchi be defined as peripheral lesions (14). However, indeed, in the 3D images, both the 3rd and 4th bronchus may be in the peripheral area. In the study of Altorki et al., peripheral lesions were defined as having a tumor center that “was peripheral in the axial, coronal and sagittal plane” (15). This definition reflected the investigator’s 3D spatial awareness in determining the location of the lesion. However, this method is very subjective and lacks quantitative data.
Some researchers investigated the use of various methods to define the pulmonary central region and reported that the concentric lines radiating from the hilum to the periphery were the most widely used (16). The basis of the concentric line method was essentially based on Lee’s concept that peripheral or central lesions should be defined by measuring the distance of the radial line from the pulmonary hilum to the periphery (17), which was adopted by many subsequent studies (18-20). Unfortunately, when we reviewed the previous studies that used concentric lines to divide the lung, we found that there was no detail on how to draw the radial lines or the concentric lines, and the center of the concentric lines was not consistent (either the midline or the hilum was used as the starting point) (5,6).
The location index method proposed by Choi et al. quantitatively measured the distance from the nodule to the mediastinal center to analyze the correlation between the location and prognosis of patients with lesions (21). However, there were some defects in this research. First, they used the chest as the measurement unit to divide the location of lesions in the pulmonary lobe unit, and second, they set the contact point between the cross-sectional midline of the thorax and mediastinum as the starting point for the measurement, which inevitably caused errors when the radial line crossed the pulmonary fissure. In addition, their study lacked verification with 3D images.
The virtual radial lines, the concentric lines, and the location index method inspired us to use the depth ratio method to quantitatively partition the lung field in 3D images. In our study, based on different measurement units, we established the chest group, lobar group, and symmetrical 3 sectors group, then the depth ratio and relevant regional distribution were simultaneously verified in 2D CT images and 3D reconstruction images. The concept of the symmetrical 3 sectors was inspired by the definition of the “peripheral lung parenchyma” in the NCCN guidelines (3), the description of the periphery lesion in Altorki’s study (15), and Nelson’s suggestion that each lung included 4 major secondary bronchi that form the “superior, inferior, ventral and dorsal” units (22).
Our results showed that the depth ratio data and the corresponding region partition were highly consistent in the 2D and 3D images for each measurement unit. However, all measurement units suffered different levels of mediastinal influence. There were 145, 55, and 10 cases affected in the chest, lobar, and the symmetrical 3 sectors group, respectively. In all 3 groups, the measurement in the left upper lung was most affected by the mediastinum. The mediastinal structures affecting measurement mainly included the aorta, the pulmonary vein, and the pericardium. It was clear that the final depth ratio calculation and the corresponding region partition could not reflect the true depth location of pulmonary nodules in the lung parenchyma if the depth measurement data included a portion that traversed the mediastinal structure. So the symmetrical 3 sectors group was most suitable for the measurement of the depth location of lesions in the lung parenchyma. Furthermore, as we mentioned in the Materials and Methods section, all cases in this study underwent sublobar resection with subsegment as basic anatomical unit, and all patients met a resection margin greater than 2 cm or the tumor diameter. Our final data imply that all pulmonary nodules are located in the outer 2/3. Therefore, we believe that the outer 2/3 of the lung parenchyma defined by the depth ratio in the symmetrical 3 sectors should correspond to the periphery in the NCCN guidelines and that pulmonary nodules in this region can be planned for a sublobar resection surgical strategy.
The region partition defined by the depth ratio method had a high consistency in 2D CT images and 3D reconstruction images, but there were some limitations in this study. First, the starting point of the measurement was subjectively selected by the investigator, which inevitably led to selection bias, moreover, due to the difference in measurement software, some errors in the location of point A (center of the pulmonary nodule) are inevitable for 2D versus 3D measurements. Second, as we chose to use the center of the nodule to determine the region location of the lesion, the margin of some lesions inevitably crossed the boundary of the adjacent regions. Finally, patients who underwent pulmonary sublobar resection applying subsegment as anatomical unit at our center were retrospectively analyzed, thus resulting in an inadequate sample size, which requires us to further expand the sample size in the follow-up study.
The depth ratio method was used in each unit of the symmetrical 3 sectors to quantitatively determine the depth location of lesions in the outer, middle, and inner regions of the lung, which showed high consistency in both 2D and 3D images and maximally eliminated the effect of the mediastinal structures. This quantitative method provided a beneficial supplement for depth location determination in various guidelines and could also be used to objectively analyze the relationship between the lesion location and lymph node metastasis, surgical approach, and treatment outcome.
Supplementary
The article’s supplementary files as
Acknowledgments
The authors appreciate the academic support from the AME Thoracic Surgery Collaborative Group.
Funding: This work was supported in part by a key medical research project of the Jiangsu Provincial Health Commission (No. K2019002), the Ethicon Excellence in Surgery Grant (No. HZB-20190528-13), and the Jiangsu Province Natural Science Foundation (No. BK20201492).
Ethical Statement: The authors are accountable for all aspects of the work in ensuring that questions related to the accuracy or integrity of any part of the work are appropriately investigated and resolved. The study was conducted in accordance with the Declaration of Helsinki (as revised in 2013). The study was approved by the Jiangsu Province Hospital and The First Affiliated Hospital of Nanjing Medical University Ethics Review Board (No. 2019-SR-450). Individual consent for this retrospective analysis was waived.
Footnotes
Data Sharing Statement: Available at https://tlcr.amegroups.com/article/view/10.21037/tlcr-22-391/dss
Conflicts of Interest: All authors have completed the ICMJE uniform disclosure form (available at https://tlcr.amegroups.com/article/view/10.21037/tlcr-22-391/coif). The authors have no conflicts of interest to declare.
References
- 1.Zhang Y, Fu F, Chen H. Management of Ground-Glass Opacities in the Lung Cancer Spectrum. Ann Thorac Surg 2020;110:1796-804. 10.1016/j.athoracsur.2020.04.094 [DOI] [PubMed] [Google Scholar]
- 2.Silvestri GA, Gonzalez AV, Jantz MA, et al. Methods for staging non-small cell lung cancer: Diagnosis and management of lung cancer, 3rd ed: American College of Chest Physicians evidence-based clinical practice guidelines. Chest 2013;143:e211S-50S. [DOI] [PubMed] [Google Scholar]
- 3.National Comprehensive Cancer Network. Clinical Practice Guidelines in Oncology–Non-Small Cell Lung Cancer, version 6.2021. 2021. Available online: https://www.nccn.org/professionals/physician_gls/pdf/nscl.pdf, date last accessed: October 2nd, 2021.
- 4.De Leyn P, Dooms C, Kuzdzal J, et al. Revised ESTS guidelines for preoperative mediastinal lymph node staging for non-small-cell lung cancer. Eur J Cardiothorac Surg 2014;45:787-98. 10.1093/ejcts/ezu028 [DOI] [PubMed] [Google Scholar]
- 5.Shin SH, Jeong DY, Lee KS, et al. Which definition of a central tumour is more predictive of occult mediastinal metastasis in nonsmall cell lung cancer patients with radiological N0 disease? Eur Respir J 2019;53:1801508. 10.1183/13993003.01508-2018 [DOI] [PMC free article] [PubMed] [Google Scholar]
- 6.Casal RF, Sepesi B, Sagar AS, et al. Centrally located lung cancer and risk of occult nodal disease: an objective evaluation of multiple definitions of tumour centrality with dedicated imaging software. Eur Respir J 2019;53:1802220. 10.1183/13993003.02220-2018 [DOI] [PubMed] [Google Scholar]
- 7.Wu W, He Z, Xu J, et al. Anatomical Pulmonary Sublobar Resection Based on Subsegment. Ann Thorac Surg 2021;111:e447-50. 10.1016/j.athoracsur.2020.10.083 [DOI] [PubMed] [Google Scholar]
- 8.Goldstein NS, Ferkowicz M, Kestin L, et al. Wedge resection margin distances and residual adenocarcinoma in lobectomy specimens. Am J Clin Pathol 2003;120:720-4. 10.1309/P47FYW5U4CRQ0WFE [DOI] [PubMed] [Google Scholar]
- 9.Sawabata N, Ohta M, Matsumura A, et al. Optimal distance of malignant negative margin in excision of nonsmall cell lung cancer: a multicenter prospective study. Ann Thorac Surg 2004;77:415-20. 10.1016/S0003-4975(03)01511-X [DOI] [PubMed] [Google Scholar]
- 10.Schuchert MJ, Pettiford BL, Keeley S, et al. Anatomic segmentectomy in the treatment of stage I non-small cell lung cancer. Ann Thorac Surg 2007;84:926-32; discussion 932-3. 10.1016/j.athoracsur.2007.05.007 [DOI] [PubMed] [Google Scholar]
- 11.Mayo JR. High resolution computed tomography. Technical aspects. Radiol Clin North Am 1991;29:1043-9. [PubMed] [Google Scholar]
- 12.Hassani AE, Skourt BA, Majda A. Efficient Lung CT Image Segmentation using Mathematical Morphology and the Region Growing algorithm. 2019 International Conference on Intelligent Systems and Advanced Computing Sciences (ISACS). IEEE, 2019. [Google Scholar]
- 13.Grant LA, Griffin N. Grainger & Allison’s Diagnostic Radiology Essentials. Elsevier, 2018. [Google Scholar]
- 14.Shimosato Y, Suzuki A, Hashimoto T, et al. Prognostic implications of fibrotic focus (scar) in small peripheral lung cancers. Am J Surg Pathol 1980;4:365-73. 10.1097/00000478-198008000-00005 [DOI] [PubMed] [Google Scholar]
- 15.Altorki NK, Wang X, Wigle D, et al. Perioperative mortality and morbidity after sublobar versus lobar resection for early-stage non-small-cell lung cancer: post-hoc analysis of an international, randomised, phase 3 trial (CALGB/Alliance 140503). Lancet Respir Med 2018;6:915-24. 10.1016/S2213-2600(18)30411-9 [DOI] [PMC free article] [PubMed] [Google Scholar]
- 16.Casal RF, Vial MR, Miller R, et al. What Exactly Is a Centrally Located Lung Tumor? Results of an Online Survey. Ann Am Thorac Soc 2017;14:118-23. 10.1513/AnnalsATS.201607-568BC [DOI] [PubMed] [Google Scholar]
- 17.Lee PC, Port JL, Korst RJ, et al. Risk factors for occult mediastinal metastases in clinical stage I non-small cell lung cancer. Ann Thorac Surg 2007;84:177-81. 10.1016/j.athoracsur.2007.03.081 [DOI] [PubMed] [Google Scholar]
- 18.Park HK, Jeon K, Koh WJ, et al. Occult nodal metastasis in patients with non-small cell lung cancer at clinical stage IA by PET/CT. Respirology 2010;15:1179-84. 10.1111/j.1440-1843.2010.01793.x [DOI] [PubMed] [Google Scholar]
- 19.Zhang Y, Sun Y, Xiang J, et al. A prediction model for N2 disease in T1 non-small cell lung cancer. J Thorac Cardiovasc Surg 2012;144:1360-4. 10.1016/j.jtcvs.2012.06.050 [DOI] [PubMed] [Google Scholar]
- 20.Farjah F, Lou F, Sima C, et al. A prediction model for pathologic N2 disease in lung cancer patients with a negative mediastinum by positron emission tomography. J Thorac Oncol 2013;8:1170-80. 10.1097/JTO.0b013e3182992421 [DOI] [PubMed] [Google Scholar]
- 21.Choi H, Kim H, Park CM, et al. Central Tumor Location at Chest CT Is an Adverse Prognostic Factor for Disease-Free Survival of Node-Negative Early-Stage Lung Adenocarcinomas. Radiology 2021;299:438-47. 10.1148/radiol.2021203937 [DOI] [PubMed] [Google Scholar]
- 22.Nelson HP. Postural drainage of the lungs. Br Med J 1934;2:251-5. 10.1136/bmj.2.3840.251 [DOI] [PMC free article] [PubMed] [Google Scholar]
Associated Data
This section collects any data citations, data availability statements, or supplementary materials included in this article.
Supplementary Materials
The article’s supplementary files as


