

Abstract
Ethanol exposure during the early stages of embryonic development can lead to a range of morphological and behavioral differences termed fetal alcohol spectrum disorders (FASD). In a zebrafish model, we have shown that acute ethanol exposure at 8-10 hours post fertilization (hpf), a critical time of development, produces birth defects similar to those clinically characterized in FASD. Dysregulation of the Sonic hedgehog (Shh) pathway has been implicated as a molecular basis for many of the birth defects caused by prenatal alcohol exposure. We observed in zebrafish embryos that shh expression was significantly decreased by ethanol exposure at 8-10 hpf, while smo expression was much less affected. Treatment of zebrafish embryos with SAG or purmorphamine, small molecule Smoothened agonists that activate Shh signaling, ameliorated the severity of ethanol-induced developmental malformations including altered eye size and midline brain development. Further, this rescue effect of Smo activation was dose-dependent and occurred primarily when treatment was given after ethanol exposure. Markers of Shh signaling (gli1/2) and eye development (pax6a) were restored in embryos treated with SAG post-ethanol exposure. Since embryonic ethanol exposure has been shown to produce later-life neurobehavioral impairments, juvenile zebrafish were examined in the novel tank diving test. Our results further demonstrated that in zebrafish embryos exposed to ethanol, SAG treatment was able to mitigate long-term neurodevelopmental impairments related to anxiety and risk-taking behavior. Our results indicate that pharmacological activation of the Shh pathway at specific developmental timing markedly diminishes the severity of alcohol-induced birth defects.
Keywords: Zebrafish, behavior, FASD, SAG, Shh, SMO, RRID:CVCL_0190, RRID:SCR_002798, RRID:SCR_000441
Graphical Abstract
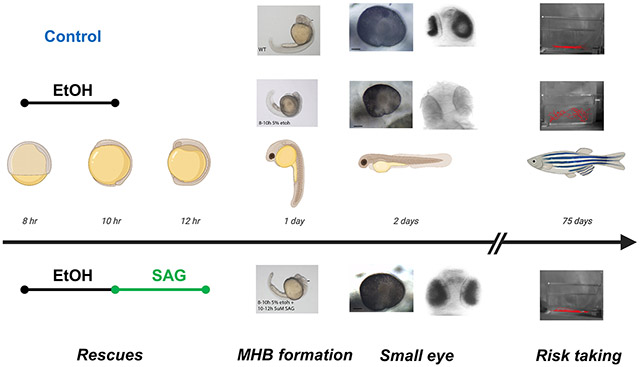
Exposure of zebrafish embryos to acute ethanol during the late gastrulation phase (8-10 hpf) results in defects in brain development (midbrain-hindbrain boundary formation; microphthalmia) and long-lasting behavioral deficits (increase in risk taking behavior). The addition of a sonic hedgehog pathway agonist (SAG) to the zebrafish embryos immediately after the ethanol exposure (10-12 hpf) rescues both the short term morphological and long-term behavioral defects.
1. INTRODUCTION
Prenatal alcohol exposure (PAE) can cause significant and irreversible teratogenic effects in the developing fetus that are the basis for fetal alcohol spectrum disorders (FASD) (Chandrasena et al., 2009; Ramsay, 2010). Craniofacial abnormalities, pre- and postnatal growth retardation, cardiac and skeletal defects, as well as abnormal brain and neurobehavioral development have been observed in those diagnosed with FASD (Eberhart et al., 2016; Jones, 1986). These alcohol induced morphological and behavioral changes are critically dependent on the timing of exposure during development, with early gestational exposure being the most damaging (Sulik et al., 1981). PAE has a major effect on eye development. Ocular aberrations such as microphthalmia are often seen in FAS children, and may be diagnostic of fetal alcohol syndrome (FAS) (Brennan et al., 2014). Moderate alcohol exposure during pregnancy, while not resulting in observable morphological changes, can impact cognitive development with cognitive delays and deficiencies persisting at least into adolescence (Foltran et al., 2011). A number of animal models have been developed to model FASD (Patten et al., 2014), including mice (Sulik et al., 1981), chick (Flentke et al., 2018; Kiecker, 2016; Sandor et al., 1968; Smith, 2008) and zebrafish (Blader et al., 1998; Loucks et al., 2012). These models recapitulate the pathological changes seen in humans with FASD, including smaller eye size (Sulik et al., 1981; Zhang et al., 2014), limb defects, smooth philtrum (Sulik et al., 1983) and also behavioral changes (Bailey et al., 2015; Burton et al., 2017; Fernandes et al., 2015).
Significant literature points to disruption of Sonic hedgehog (Shh) signaling, a major morphogenic pathway regulating embryonic development, as a consequence of PAE (Ahlgren et al., 2002; Aoto et al., 2008; Arenzana et al., 2006; Loucks et al., 2009; Yelin et al., 2007; Zhang et al., 2013). Shh signaling has fundamental roles in embryonic neural, craniofacial and eye development (Cavodeassi et al., 2019; Chen et al., 2018; Cordero et al., 2004; Eberhart et al., 2006; Wang et al., 2013). Disruption of Shh signaling during development can result in a wide range of effects depending on the degree to which the pathway is disrupted and can be severe, potentially resulting in fatal developmental disorders of the brain such as holoprosencephaly (Arsić et al., 2007; Heyne et al., 2016). Facial and neural phenotypes in FAS closely resemble those seen if Shh is disrupted during development, including by Shh pathway antagonists (Heyne et al., 2015; Lipinski et al., 2010), implicating a relationship between Shh pathway expression and FASD (Eberhart et al., 2016). Mediators of Shh signaling such as the Gli transcription factors have been shown to be downregulated by ethanol during embryogenesis (Ahlgren et al., 2002; Zhang et al., 2013). Pregnant mice with genetic disruptions of Shh pathway components, including Cdon, Ptch2, Gli1/2, have embryos with increased susceptibility to the effects of prenatal alcohol including increases in holoprosencephaly and limb defects (Fish et al., 2017a; Heyne et al., 2015; Hong et al., 2012; Kahn et al., 2017; Kietzman et al., 2014). Ethanol exposure has also been shown to disrupt Shh signaling in developing chick (Ahlgren et al., 2002) and zebrafish embryos (Li et al., 2007).
Several studies have demonstrated that the effects of PAE can be prevented by genetically upregulating Shh signaling. The susceptibility of Cdon−/− mice to embryonic ethanol exposure was rescued in mice that also had reduced Ptch1 gene expression (Hong et al., 2013). Application of Shh itself to chick embryos prior to alcohol exposure was able to rescue ethanol induced neural crest cell death (Ahlgren et al., 2002). Further, administration of anti-oxidants such as vitamin C and E to mouse embryos blocks the reduction in Shh expression caused by ethanol, with vitamin E reducing the incidence of ethanol-induced birth defects in early gestation (Aoto et al., 2008). In zebrafish FASD models, a number of the morphological and behavioral changes associated with PAE could be rescued by pre-injection with shh mRNA at the single cell stage (Burton et al., 2017; Loucks et al., 2009; Schwend et al., 2009; Zhang et al., 2013; Zhang et al., 2011).
Activation of Shh signaling is also possible with a number of small molecule compounds acting at the level of the Shh co-receptor Smoothened (SMO), such as SAG (Smoothened Agonist)(Chen et al., 2002; Frank-Kamenetsky et al., 2002). These agonists have shown promise therapeutically as neuroprotective agents (Chechneva et al., 2014; Hu et al., 2017; Jin et al., 2017) and in developmental syndromes, such as Down syndrome (Das et al., 2013; Roper et al., 2006), when given postnatally. In Shh−/− mouse embryos, midline defects seen at GD8.5 were partially rescued by SMO agonist treatment (Frank-Kamenetsky et al., 2002).
In our study, we tested the hypothesis that a small molecule Shh pathway agonist when given at the appropriate dose and timing relative to ethanol exposure during embryogenesis may alleviate the effects of PAE. The zebrafish model of PAE is able to recapitulate many of the pathological (Zhang et al., 2014) and behavioral (Bailey et al., 2015; Burton et al., 2017; Fernandes et al., 2015) changes observed in humans and allows testing of multiple doses of ethanol and SAG, including varied timing and sequence of dosing. Our findings herein demonstrate that SAG when administered at specific developmental timing relative to ethanol exposure, can rescue ethanol-induced morphological defects and long-term behavioral deficits.
2. METHODS
2.1. Animals and husbandry
Zebrafish (Danio rerio, AB strain, ZFIN ID: ZDB-GENO-960809-7) were obtained from the Zebrafish International Resource Center and were bred and maintained as previously described (Boa-Amponsem et al., 2020; Burton et al., 2017). Zebrafish were housed at 28.5°C and kept on a 14h:10h light dark cycle. All procedures using zebrafish were conducted according to North Carolina Central University IACUC policy in accordance with NIH regulations.
2.2. Ethanol exposure and drug treatments of zebrafish embryos
Zebrafish embryos in fish water (egg water) containing 1:500 dilution of 0.1% Methylene Blue were exposed to ethanol (1% - 5%) in diluted fish water from 8-10 hours post fertilization (hpf). These concentrations of ethanol exposure, at this critical point of development, have been previously shown to elicit phenotypes associated with FASD (Zhang et al. 2014). Zebrafish embryos were exposed to varying concentrations of SMO agonists (SAG (Santa Cruz) or purmorphamine (PUR) (Fisher Scientific)) at 6-8 hpf or 10-12 hpf by diluting with egg water (Figure 1). Embryos were incubated in sterile 100 mm petri dishes, with 25-40 embryos per petri dish. Following exposure, embryos were washed three times with fresh egg water to completely remove any drug treatment. Embryos were not disturbed until later morphological measurement.
Fig. 1. Timeline schematic for ethanol and SAG treatment of zebrafish embryos.

Developmental timing (hpf, hours post fertilization; dpf, hours post fertilization) for ethanol exposure and SAG treatments are shown. Embryos are assessed for midbrain-hindbrain boundary (MHB) disruption at 24 hpf and eye size at 2 dpf.
2.3. Morphological Assessment
Eye size was assessed at 2 days post fertilization (dpf) using a previously described protocol (Zhang et al., 2014; Zhang et al., 2011). Eyes are measured along the longest axis, with a normal eye size considered to be greater than or equal to 240 μm (Burton et al., 2017). Eye size measurements were made blinded to experimental group whenever possible.
The midbrain hindbrain boundary (MHB), a defined division between the midbrain and hindbrain, was visually assessed at 24 hpf as we have previously described (Zhang et al., 2015; Zhang et al., 2014). The MHB is defined as present when one can visually observe 3 or 4 ridges at the midbrain hindbrain junction. The MHB is defined as disrupted when this boundary is absent.
2.4. Quantitative real-time PCR
For each treatment group, pooled embryos (>10) were placed into microcentrifuge tubes containing RNAzol (Molecular Research Center, Inc), and immediately stored at −80°C. RNA was extracted and cDNA synthesized from RNA (1 μg) using iScript Reverse Transcriptase (Bio-Rad) and oligo(dT) and random hexamers as primers. cDNA was used for quantitative PCR, which was carried out using TaqMan® Gene Expression (Master Mix and TaqMan® Gene Expression Assays ID (Thermo Fisher Scientific) for the following zebrafish targets; gli1a (Dr03093666_m1), gli1b (Dr3093663_g1), gli2a (Dr03144185_m1), gli2b (Dr03135220_m1), shha (Dr03432631_m1) and smo (Dr03131349_m1) expression, along with endogenous control zebrafish ribosomal protein L13a (Rpl13a) (Dr03432610_m1). PCR was performed in triplicate on a QuantStudio 6 flex (Thermo Fisher Scientific). Quantitation of gli1a, gli1b, gli2a, gli2b, shha, and smo mRNA expression was normalized to the internal rpl13a and calculated using the comparative Ct method.
2.5. Whole mount in situ RNA hybridization for pax6a
Whole mount in situ RNA hybridization was performed as previously described with probe hybridization at 65°C (Zhang et al., 2015; Zhang et al., 2013; Zhang et al., 2011). Digoxigenin-labeled riboprobes were transcribed from cDNAs encoding pax6a. Embryos were cleared in glycerol (50%) and viewed on an Olympus MVX-10 microscope. Stained embryos were scored for normal or altered pax6a staining as a result of treatment. Fisher’s exact test was used to analyze pax6a in situ expression data.
2.6. C3H10T1/2 cell-based hedgehog signaling assay
Prior to use in the zebrafish studies, the activity of SAG stock solutions were routinely assessed by the C3H10T1/2 Shh-responsive cell-based assay (Nakamura et al., 1997; Reznikoff et al., 1973; Williams et al., 1999), which was carried out as previously detailed (House et al., 2015; Tarpley et al., 2021; Williams et al., 1999). Briefly, C3H10T1/2 cells were plated overnight and then different concentrations of SAG or PUR were added in triplicate and cells were incubated for a further 5 days. Alkaline phosphatase (AP) activity, which reflects Shh-mediated differentiation of these cells, was measured using pNPP as the substrate and plates were read at 405 nm. Effective concentration (EC50) values were determined by non-linear regression in GraphPad 8.0. SAG EC50 values were typically in the range 40 to 50 nM comparable to our previously published values (Fish et al., 2019; Fish et al., 2017b).
2.7. Behavior assessment of juvenile zebrafish
There is significant literature supporting the use of zebrafish to model human behavior, including (Bailey et al., 2013; Levin, 2011; Levin et al., 2009). Juvenile zebrafish were assessed for anxiety-like and risk-taking behavior in the novel tank diving test using a previously established protocol (Boa-Amponsem et al., 2019; Burton et al., 2017; Levin, 2011). Briefly, individual zebrafish (60-75 dpf) in 1.5 L tanks filled to an ~10 cm depth of tank water were assessed during the light cycle for duration of time spent on the tank floor vs time spent exploring the rest of the tank. Swimming was tracked in real time by video using an Everfocus camcorder (Duarte, CA) and analyzed by EthoVision XT tracking software (RRID:SCR_000441, Noldus, Netherlands) that calculates distance from the tank floor and total distance traveled. Mean distance traveled from the tank floor was determined for each minute of the 5 min trial and commenced as soon as the fish was placed in the tank. A minimum of 10 fish were assessed for each treatment group.
2.8. Statistical analysis
All data were plotted and analyzed using GraphPad Prism 8 (RRID:SCR_002798, GraphPad Software, La Jolla California USA). Eye size data were analyzed as previously described (Boa-Amponsem et al., 2020; Burton et al., 2017; Zhang et al., 2015) by one-way ANOVA followed by Dunnett’s multiple comparisons test using GraphPad Prism version 8.02,). Two-way ANOVA were used to analyze gene expression and novel tank diving data. Fisher’s exact test was used to analyze midbrain-hindbrain data and pax6a in situ expression data. Details of analyses are provided in the Results and the Figure Legends. All p values and n for two-way ANOVA comparisons are shown in Supplemental Table 1. Novel tank diving test data were analyzed as described previously (Boa-Amponsem et al., 2020; Burton et al., 2017). The Type1 error rate alpha (α) was set to 0.05. Control, drug and ethanol were used as the between factors with mean distance to floor and total distance traveled per minute as the repeated measure. The Greenhouse-Geisser adjustment, which was used to control for sphericity, was applied to the novel tank diving data. To compare exposure groups, the mean was taken across all five minutes of each trial for each exposure group. The Tukey post-hoc test was used to determine differences between exposure groups.
3. RESULTS
3.1. Embryonic ethanol exposure produces eye defects in zebrafish embryos
Exposure of zebrafish embryos to ethanol results in developmental effects on eye and brain development, with small eye (micropthalmia) a typical phenotype (Kashyap et al., 2011; Loucks et al., 2007; Zhang et al., 2011). We have shown previously that acute ethanol exposure at 8-10 hpf (corresponding to the transition from late gastrulation to early neurulation) disrupts ocular development and midbrain-hindbrain boundary (MHB) formation (Zhang et al., 2014). Here, we first demonstrated that we could observe the dose-dependent effects of ethanol on inducing microphthalmia at 2 dpf, by exposing embryos at 8-10 hpf with increasing concentrations of ethanol. The percentage of embryos developing small eyes which we have previously defined as <240 μm (Burton et al., 2017), increased with increasing ethanol concentration (small eye observed in 15/26 embryos at 3%, 19/26 at 4% and 26/26 at 5% ethanol) (supplemental figure S1a and representative images S1b). There was significant main effect of ethanol; ANOVA summary F(3,122) = 87.12, p<0.0001. (****p<0.0001 for 3, 4 and 5% ethanol compared to control). Control eye size was 259.9 ± 8.3 μm (comparable to previous studies (Zhang et al., 2014)), with eye size decreasing to 213.4 ± 19.0 μm in the 5% ethanol treated embryos As we observed almost 100% penetrance of the small eye defect with an acute 5% ethanol exposure, this concentration was used for subsequent studies.
3.2. SAG treatment at specific embryonic timing significantly diminishes the severity of ethanol-mediated effects on eye size in zebrafish embryos
SAG treatment alone (1, 2.5, 5 or 10 μM) at either 6-8 hpf or 10-12 hpf did not have a significant impact on eye size at 2 dpf, with no embryos having an eye size <240 μm (supplemental figures S1c, S1d and representative images S1e). We next assessed the ability of varying doses of SAG, whether given in a 2 hr window before (6-8 hpf) or after (10-12 hpf) ethanol exposure, to mitigate the ethanol-induced small eye size phenotype. When given immediately after ethanol treatment (Post-EtOH), there was a significant main effect of treatment; ANOVA summary F(9,166) = 27.03, p<0.0001. indicating significant rescue of the small eye phenotype at all SAG doses tested (****p<0.0001) with a trend of higher dose providing more rescue (Figure 2a and representative images Figure 2b). At the highest dose of SAG, ninety percent of those ethanol exposed embryos receiving the post-ethanol 10 μM SAG treatment had normal eye size >240 μm (not significant versus control embryo eye size), and were significantly different from the ethanol alone exposed embryos (****p<0.0001). However, when given prior to ethanol exposure (Pre-EtOH), SAG was not as effective and had a more variable response, with the majority of the embryos still exhibiting the small eye phenotype (7/12 below the 240 nm threshold at 1 μM, 12/12 at 2.5 μM, 7/14 at 5 μM and 11/13 at 10 μM SAG; Figure 2a and representative images Figure 2b). Those embryos receiving the 10 μM SAG pre-ethanol scheduling (215.2 ± 20.7 μm), were not significantly (ns) different from those exposed to ethanol alone (213.6 ± 19.3 μm).
Fig. 2. SAG treatment after ethanol exposure rescues ocular size defects in 2 dpf zebrafish embryos.

(a) Zebrafish embryos were either pre-treated with SAG (1, 2.5, 5 or 10 μM) at 6-8 hpf and then exposed to 5% ethanol at 8-10 hpf (Pre-EtOH) or first exposed to 5% ethanol at 8-10 hpf and then treated with SAG (1, 2.5, 5 or 10 μM) at 10-12 hpf (Post-EtOH). Dotted line indicates threshold for normal eye size (> 240 μm). Eye diameter was measured at 2 dpf as described in Methods. n > 10 embryos per treatment. Error bars show mean ± SD. Data in (a) were evaluated by one-way ANOVA followed by Dunnett’s multiple comparisons test using GraphPad Prism version 8.02. Groups are compared to ethanol treated alone (EtOH). ANOVA summary was F(9,166) = 27.03, p<0.0001. Significant rescue is observed when SAG is given post-ethanol treatment (****p<0.0001 for all doses tested) with 90% of embryos having normal eye size at the 10 μM SAG treatment post-EtOH. In comparison, the rescue effect is less pronounced when SAG is given prior to EtOH, with 2 of the doses having no effect (**p=0.001 for 1 μM, ns (p>0.9999) for 2.5 μM, ***p=0.0002 for 5 μM and ns (p=0.2033) for 10 μM). See Supplemental Table 1 for summary of n and all multiple comparisons p values. (b) Representative images (i to x) for, controls, SAG + EtOH and EtOH + SAG exposures. The calibration bar indicates 50 μm.
We next assessed the ability of another SMO agonist purmorphamine (PUR) (Sinha et al., 2006; Wu et al., 2002; Wu et al., 2004), to reduce the small eye phenotype induced by ethanol exposure. While both bind SMO, SAG and PUR are different classes of chemicals (Briscoe, 2006; Sinha et al., 2006) (supplemental figure S2a). In the C3H10T1/2 assay, PUR had ~10-fold lower potency than SAG (supplemental figure S2b). Hence, for the eye size study, we hypothesized to use PUR at ~10-fold higher concentration than SAG, and so used treatments of PUR ranging from 10 to 100 μM. There was a significant effect of treatment, ANOVA summary F(5,102) = 53.65, p<0.0001. PUR alone had no effect on eye size and when given post-ethanol exposure at 10-12 hpf we found that 100 μM PUR was able to significantly rescue the ethanol-induced small eye defect with effect comparable to 10 μM SAG (****p<0.0001 for both EtOH + SAG and EtOH + PUR compared to EtOH alone; not significant (ns) for EtOH + SAG compared to EtOH + PUR, Supplemental Figure S2c, representative images S2d and Supplemental Table 1).
3.3. SAG reduces the incidence of ethanol-induced midbrain-hindbrain boundary disruptions in zebrafish embryos.
We have previously observed the effect of ethanol exposure on CNS morphology as assessed by MHB disruption (Zhang et al., 2014). In our current study, embryos exposed to 3%, 4%, or 5% ethanol at 8-10 hpf had MHB disruption in 15%, 47% and 89% of embryos, respectively at 1 dpf (Supplemental Figure 3a), comparable to our previous report (Zhang et al., 2014). MHB was absent in 0/45 control, 5/34 3% EtOH (Fisher’s exact test compared to control, *p=0.0123), 16/34 4% EtOH (****p<0.0001) and 16/18 5% EtOH (****p<0.0001). SAG alone at either 6-8 hpf or 10-12 hpf did not significantly disrupt MHB formation (Supplemental Figure 3b and representative images 3c). While we observed ~90% disruption of MHB with 5% EtOH exposure at 8-10 hpf (Fisher’s exact test, p<0.0001 compared to control), this effect was significantly reduced with all post-EtOH SAG treatments, in particular with the 5 and 10 μM SAG treatments (Fisher’s exact test, both p<0.0001 compared to EtOH alone). MHB disruption was reduced to 25% with 10 μM SAG treatment following EtOH exposure (Figure 3a and representative images 3b). SAG when given prior to ethanol (Pre-EtOH), was less effective on reducing ethanol-induced MHB loss, with only the 1 and 10 μM SAG + EtOH treatment having significant effects (Fisher’s exact test, p=0.022 and p <0.0001, respectively, compared to EtOH alone) (Figure 3a).
Fig. 3. SAG treatment mitigates the effects of acute ethanol exposure on MHB formation in zebrafish embryos.

Effects on MHB formation of treating embryos with SAG either Pre-EtOH (6-8 hpf) or Post-EtOH (10-12 hpf) exposure. (a) Zebrafish embryos ( n ≥ 10) were exposed to 5% ethanol at 8-10 hpf and treated with either 1, 2.5, 5 or 10 μM SAG pre- (SAG + EtOH) or post-EtOH (EtOH + SAG) exposure. Percent absence of MHB are shown; MHB absent in 0/35 control, 32/35 EtOH, 17/27 EtOH + 1 μM SAG, 21/33 EtOH + 2.5 μM SAG, 12/30 EtOH + 5 μM SAG, 3/12 EtOH + 10 μM SAG, 28/41 1 μM SAG + EtOH, 19/21 2.5 μM SAG + EtOH, 16/21 5 μM SAG + EtOH and 6/14 10 μM SAG + EtOH. Fisher’s exact test was used to compare absence of MHB between groups. We observed ~90% disruption of MHB with 5% EtOH exposure at 8-10 hpf (Fisher’s exact test, p<0.0001 compared to control), This effect was significantly reduced with all post-EtOH SAG treatments compared to EtOH alone (→), in particular with the 5 and 10 μM SAG treatments (Fisher’s exact test, both ****p<0.0001). SAG when given prior to ethanol (Pre-EtOH), was more variable and less effective on reducing ethanol-induced MHB loss, with the 2.5 and 5 μM treatments not significant, and the 1 and 10 μM SAG + EtOH treatments having a significant effect (Fisher’s exact test, *p=0.022 and ****p=0.0007 compared to EtOH alone, respectively) (Figure 3a). (b) Representative images for (i) control, (ii) EtOH (5%) alone, (iii) 6-8 hpf 5 μM SAG + EtOH and (iv) EtOH + 10-12 hpf 5 μM SAG. Arrow indicates defined MHB border. MHB was assessed at 24 hpf as described in Methods.
3.4. Effect of acute ethanol exposure on Shh pathway gene expression in zebrafish embryos
To gain an understanding of how SAG was rescuing the effects of ethanol, a series of gene expression studies was performed. First, a time course study assessed the effects of ethanol exposure on shh and smo expression over time (4 to 24 hpf), as a potential measure of ethanol’s effect on Shh secreting versus Shh responding cells. For this study, embryos were left untreated or exposed to ethanol (5% at 8-10 hpf), then collected and pooled for RNA extraction, followed by qRT-PCR to determine changes in mRNA levels. Data were evaluated by two-way ANOVA followed by Sidak’s multiple comparisons test using GraphPad Prism version 8.02. For Shha gene expression, two-way ANOVA revealed a significant interaction of treatment and time (F(5,24) = 15.65, p<0.0001). As expected, shh expression at the 4 and 6 hr time points was almost undetectable. In the untreated embryos, we observed a dramatic increase in shh expression from the 6 to 8 hr time points with expression peaking around 12 hr and remaining strongly expressed at 24 hr (Figure 4a). These expression kinetics for shh in control embryos are comparable to previously reported (Albert et al., 2003; Bergeron et al., 2008; Boschen et al., 2021; Eberhart et al., 2006; Karlstrom et al., 2003; Mich et al., 2014; Schwend et al., 2009; Schwend et al., 2010; Xu et al., 2006; Yu et al., 2006). Ethanol exposure significantly reduced shh expression from 8 hr through to 24 hr by ~3-fold (****p<0.0001 for control compared to EtOH at 8, 10, 12 and 24 hrs, Figure 4a). For smo gene expression, two-way ANOVA revealed a significant interaction of treatment and time (F(5,24) = 11.43, p<0.0001). Smo expression was also very low at the early 4 and 6 hr time points, and increased dramatically and peaked at 8 hr, decreasing slowly at subsequent time points (Figure 4b). In contrast to effects on shh, ethanol exposure appeared to have far less effect on smo expression with only modest decreases seen at the 6 hr (*p=0.0101) and 8 hr (****p<0.0001) time points. For the time period 10 to 24 hr there appeared to be no significant effect of ethanol exposure on smo expression (Figure 4b).
Fig. 4. SAG treatment following ethanol exposure rescues Sonic hedgehog-mediated gene expression in 2 dpf zebrafish larvae.
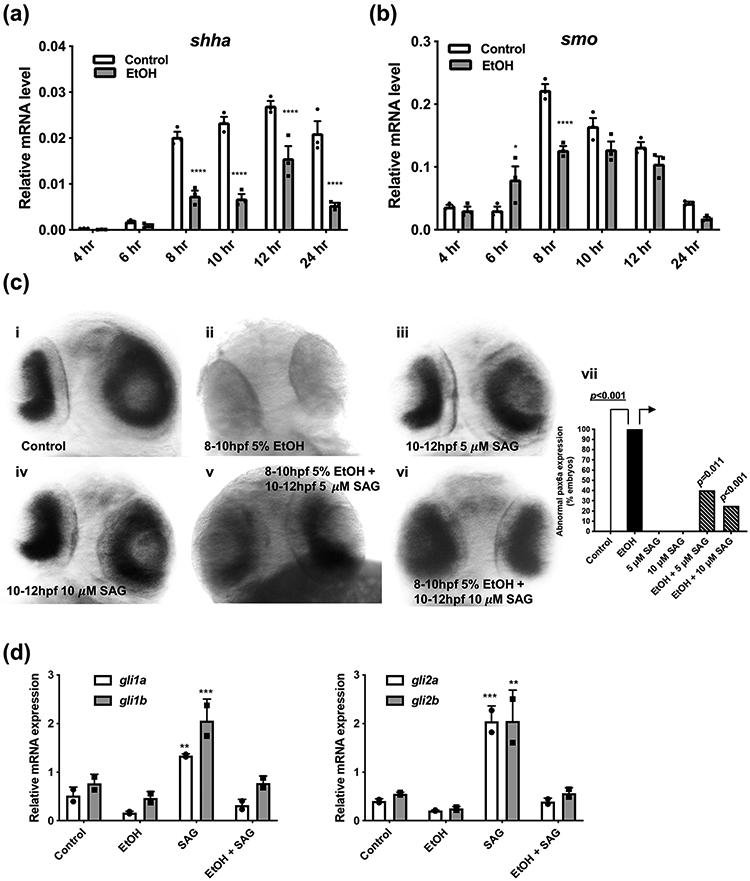
Time course for shha (a) and smo (b) mRNA expression in zebrafish embryos (pooled embryos n≥10 per time point, 3 replicates/pooled group), either control or exposed to EtOH (5%) at 8-10 hpf. RNA was harvested at the indicated time points, quantified by qRT-PCR and normalized to an internal rpl13a mRNA control. Gene expression as described in Methods. Data were evaluated by two-way ANOVA followed by Sidak’s multiple comparisons test using GraphPad Prism version 8.02. For each time point, control compared to EtOH. (a) Shha: there was a significant interaction of treatment and time (F(5,24) = 15.65, p<0.0001). Ethanol exposure significantly reduced shh expression from 8 hr through to 24 hr by ~3-fold (****p <0.0001 for 8, 10, 12 and 24 hrs for control compared to EtOH, Figure 4a). (b) Smo: there was a significant interaction of treatment and time (F(5,24) = 11.43, p<0.0001). For ethanol exposure, only at the 6 hr (*p =0.0101) and 8 hr (****p<0.0001) time points is a decrease in smo seen. For the time period 10 to 24 hr there appeared to be no significant effect of ethanol exposure on smo expression. See Supplemental Table 1 for summary of all multiple comparisons p values. (c) Pax6 in situ mRNA expression in 2 dpf embryo retina. Representative images for (i) control embryos (15/15 (100% normal pax6a expression)). (ii) embryos exposed to 5% EtOH at 8-10 hpf (0/10,100% abnormal). Embryos treated at 10-12 hpf with (iii) 5 μM SAG alone (0/9, 0% abnormal) or (iv) 10 μM SAG alone (0/8, 0% abnormal). Embryos exposed to 5% EtOH at 8-10 hpf and then treated post-EtOH at 10-12 hpf with either (v) 5 μM SAG (6/10, 40% abnormal) or (vi) 10 μM SAG (3/12, 25% abnormal). (vii) Plot of % abnormal pax6a expression in embryo retina. Fisher’s exact test, p<0.001 EtOH compared to control. The incidence of abnormal pax6a expression in the embryo retina caused by EtOH was significantly altered with post-EtOH SAG treatments compared to EtOH alone (→), (Fisher’s exact test, *p=0.011 and ***p=0.0005 for 5 μM and 10 μM SAG, respectively). (d) Quantitation of gli1a/b and gli2a/b, mRNA expression by qRT-PCR in 2 dpf zebrafish embryos exposed to 5% EtOH and/or 10 μM SAG as indicated. Gene expression as described in Methods. n≥10 pooled embryos per treatment (2 replicates/pooled group). Data were evaluated by two-way ANOVA followed by Dunnett’s multiple comparisons test using GraphPad Prism version 8.02. Groups are compared to control. Gli1: ANOVA summary for treatment was F(3,8) = 38.0, p<0.0001. SAG treatment significantly increased gli1a (**p=0.0084) and gli1b (***p=0.0005) expression. SAG treatment post-EtOH reduces gli1a/b expression to levels comparable to control. Gli2: ANOVA summary for treatment was F(3,8) = 42.4, p<0.0001. SAG treatment significantly increased gli2a (***p=0.0006) and gli1b (**p=0.0010) expression. SAG treatment post-EtOH reduces gli2a/b expression to levels comparable to control. See Supplemental Table 1 for summary of all multiple comparisons p values.
3.5. SAG treatment post-ethanol exposure rescues altered retinal pax6a expression
To assess changes in the eye phenotype, we analyzed pax6a expression, a gene expressed in the retina of immature zebrafish eyes that is regulated by Shh (Ericson et al., 1997). We and others have shown that pax6a has reduced expression in zebrafish eyes after ethanol exposure (Kashyap et al., 2011; Loucks et al., 2007; Zhang et al., 2014; Zhang et al., 2011) and that combined ethanol and Shh morpholino treatment significantly reduces pax6a (Zhang et al., 2014). In our current study, zebrafish embryos were exposed to ethanol at 8-10 hpf and pax6a expression assessed at 2 dpf using in situ hybridization. Embryos exposed to ethanol (5% at 8-10 hpf) had altered pax6a expression in the retina with 100% of embryos having abnormal pax6a expression (Figure 4c, representative image ii), as we have previously observed (Zhang et al., 2014), Fisher’s exact test, p<0.001 EtOH compared to control. SAG alone at 10-12 hpf had no observable effect on pax6a expression (Figure 4c, representative images iii and iv). Restored pax6a expression was observed when SAG was given post-ethanol at 5 or 10 μM (Figure 4c, representative images v and vi), with 75% of embryos having pax6a expression in the retina comparable to normal when given 10 μM SAG post-ethanol (Figure 4c). Fisher’s exact test, p=0.011 and p<0.001 for 5 μM and 10 μM SAG post-EtOH respectively compared to EtOH alone (Figure 4c vii).
3.6. SAG treatment post-ethanol exposure rescues decreased gli1/2 expression
Expression of the Shh pathway transcription factors gli1 and gli2 are affected by prenatal ethanol exposure in a number of in vivo models (Loucks et al., 2012; Zhang et al., 2013). In our study, zebrafish embryos were exposed to ethanol at 8-10 hpf, embryos collected at 24 hpf and gene expression was measured by qRT-PCR for the downstream mediators of shh signaling, gli1a/b and gli2a/b. Data were evaluated by two-way ANOVA followed by Dunnett’s multiple comparisons test. There was a significant effect of treatment for gli1 (F(3,8) = 38.0, p<0.0001) and gli2 (F(3,8) = 42.4, p<0.0001). Ethanol exposure alone decreased gli1a/b and gli2a/b mRNA expression. SAG treatment alone at 10-12 hpf significantly increased gli1a (**p=0.0084) and gli1b (***p=0.0005), and gli2a (***p=0.0006) and gli1b (**p=0.0010) expression by ~3-4 fold compared to control embryos (Fig. 4d). Gli1a/b expression was increased more when SAG was given alone at 10-12 hpf (2.2-fold increase for gli1a and 3.6-fold increase for gli1b relative to control) compared to given at 6-8 hpf (1.3-fold increase for gli1a and 1.8-fold increase for gli1b relative to control (supplemental figure S4). Treatment of embryos with SAG post-ethanol restored gli1a/b and gli2a/b expression levels to those comparable to control embryos (Figure 4d, Supplemental Table 1 for all p values).
3.7. SAG treatment rescues abnormal novel tank diving behavior caused by embryonic ethanol exposure
We next were interested to see whether SAG treatment could rescue the behavioral deficits observed in adolescent zebrafish that had been previously exposed to ethanol during early development. We have shown previously that adolescent zebrafish exposed to ethanol at early (Bailey et al., 2015; Boa-Amponsem et al., 2019) or late gastrulation (Burton et al., 2017) exhibit increased risk-taking behavior in the novel tank diving test, and this behavior can be rescued by Shha mRNA pre-injected at the one- to two-cell stage (Burton et al., 2017). Additionally, even low ethanol exposures (1%) at these early time points (5.25-6.25 hpf) result in adolescent zebrafish exhibiting altered novel tank diving behavior (Boa-Amponsem et al., 2019). As zebrafish exposed to 5% ethanol do not survive to juvenile stage (Zhang et al., 2014), we used the low dose 1% ethanol exposure for the behavioral study. In the behavioral study here, we used a post-ethanol SAG treatment, with zebrafish embryos being first exposed to 1% ethanol at 5.25-6.25 hpf and then treated with SAG (5 μM at 9-10 hpf). Once the fish developed to juvenile stage (2.5 months), they were assessed for changes in risk-taking (Figure 5a) by measuring the mean distance to the tank floor traveled by individual fish every minute for 5 minutes (Boa-Amponsem et al., 2019; Burton et al., 2017). In our study, adolescent zebrafish previously exposed to 1% ethanol as embryos at 5.25-;6.25 hpf, exhibited significantly altered tank diving behavior, spending on average significantly greater time away from the floor of the tank compared to control zebrafish (Tukey’s post-hoc testing, p=0.0016) (Figure 5b and representative tank diving images in Figure 6), findings comparable to our previous studies (Boa-Amponsem et al., 2019; Burton et al., 2017). A significant main effect of treatment was observed (F (3, 260) = 13.79, p<0.0001). The behavior of juvenile fish previously treated with SAG alone was not significantly different from control fish (p=0.9721, Figure 5b and representative tank diving images in Figure 6). Notably, a single acute SAG treatment (5 μM) following the 1% ethanol embryonic exposure at 5.25-6.25 hpf, rescued the ethanol-induced altered tank diving risk-taking phenotype (Figure 5b and representative tank diving images in Figure 6), with the post-ethanol SAG juvenile fish not significantly different from control (Tukey’s post-hoc testing, p=0.2241).
Fig. 5. Altered tank diving behavior in juvenile zebrafish previously exposed to acute ethanol as embryos is rescued with embryonic SAG treatment.

(a) Timing schematic for ethanol exposure (1% at 5.25-6.25 hpf) + SAG treatment (5 μM post-EtOH 9-10 hpf) and behavior assessment at 60 to 75 days post fertilization. (b) Juvenile zebrafish (60-75 days) were individually assessed for changes in novel tank diving response as determined by mean distance traveled from the tank floor over a 5 min time course. Novel tank diving test data were analyzed by two-way ANOVA statistical analysis using GraphPad Prism version 8.02. Total of n > 10 per group from two independent experiments. Each bar represents the mean distance from the tank floor for each 1 min (1-5 mins). Error bars represent SEM. To compare groups, the mean was taken across all 5 minutes for each exposure group. A significant main effect of treatment was observed (F (3, 260) = 13.79, p<0.0001). The Tukey post-hoc multiple comparisons test was used to determine differences between exposure groups (groups are compared to control). Altered tank diving response, an indication of risk-taking behavior, is only observed for juvenile fish previously exposed embryonically to 1% ethanol (significantly different from control (post hoc) across all time points analyzed, **p=0.0016). Embryonic SAG treatment alone did not significantly (ns) affect the novel tank diving behavior of the fish at the juvenile stage, p=0.9721). Treatment of embryos post-EtOH exposure with SAG (EtOH + SAG) is able to rescue the risk-taking behavior with values not significantly (ns) different compared to control, p=0.2241. See Supplemental Table 1 for summary of all n and multiple comparisons p values.
Fig. 6. Novel tank diving tracking in juvenile zebrafish exposed to acute ethanol with and without SAG treatment as embryos.

Representative novel tank diving tracks of each minute from 5 min videos of juvenile zebrafish. From left to right; (a) control, (b) 1% EtOH alone at 5.25-6.25 hpf, (c) SAG treatment alone at 9-10 hpf, (d) 1% EtOH at 5.25-6.25 hpf followed by SAG treatment at 9-10 hpf. Swimming was tracked in real time by video and analyzed by EthoVision XT tracking software (Noldus, Netherlands) that calculates distance from the tank floor and total distance traveled. A minimum of 10 fish were assessed for each treatment group.
4. DISCUSSION
There is overwhelming evidence for diminished Shh pathway signaling in the pathology of FASD (Ahlgren et al., 2002; Aoto et al., 2008; Arenzana et al., 2006; Loucks et al., 2009; Yelin et al., 2007; Zhang et al., 2013). Our current study demonstrates that in a zebrafish model of embryonic alcohol exposure, the morphological and behavioral effects induced by PAE can be ameliorated by pharmacological restoration of Shh pathway signaling immediately after the alcohol exposure. First, we demonstrated that a synthetic chemical SMO agonist (SAG), when given alone during early development, did not cause any observable morphological defects. Second and most interestingly, our findings showed that a single dose of SAG, when given to zebrafish embryos at specific timing and dose, primarily immediately after ethanol exposure, was able to rescue the morphological defects in ocular and brain development elicited by ethanol alone. Third, the long-term behavioral deficits observed in juvenile zebrafish, which are promoted by ethanol exposure at an early embryonic stage, were also rescued by SAG treatment when given to embryos post-ethanol exposure.
In the current study, we observed that ethanol (8-10 hpf) reduces shh mRNA expression in zebrafish embryos for at least 24 hrs following exposure. In contrast, we did not see a significant effect of ethanol exposure on smo mRNA expression for the same time period. A number of mechanisms for how ethanol impacts Shh signaling have been proposed (reviewed in (Eberhart et al., 2016)), including ethanol preventing C-terminal cholesterol esterification of Shh during post-translational processing (Li et al., 2007), and/or ethanol inducing cell death in Shh secreting and/or Shh responding cells. Our data would suggest that the Shh expressing cells are more susceptible to ethanol-induced cell death than the Shh responding cells. Around these early stages, shh is expressed in the notochord (Muller et al., 1999), which is forming around 9-10 hpf (Glickman et al., 2003; Kimmel et al., 1995), and in the ventral presumptive brain (Eberhart et al., 2006). At 10 hpf, smo is detected in neural plate and axial mesoderm with higher levels seen in presumptive head and tail regions (Chen et al., 2001). Our findings on potential differences in sensitivity of shh-expressing and smo-responding cells to ethanol requires further study to identify the specific cell types.
Several previous studies in zebrafish support the premise that restoration of Shh signaling can diminish the severity of PAE-induced defects, including pre-injection of single cell stage zebrafish with shh mRNA (Burton et al., 2017; Loucks et al., 2009; Schwend et al., 2009; Zhang et al., 2013; Zhang et al., 2011), supplementation with cholesterol (Li et al., 2007), folic acid or retinoic acid (Cadena et al., 2020; Muralidharan et al., 2015). In this study, we wished to assess whether a chemical small molecule Shh pathway activator would be able to replicate this rescue when given at the appropriate stage during embryonic development. To test this hypothesis we used SAG, a small molecule agonist targeting SMO (Chen et al., 2002; Frank-Kamenetsky et al., 2002). Although pharmacological rescue by small molecule Shh pathway agonists such as SAG has been demonstrated in a number of therapeutic areas linked to reduced Shh signaling (Das et al., 2013; Heine et al., 2011; Hu et al., 2017; Nguyen et al., 2018), administration has almost always been post-natal. The use of pharmacological Shh pathway modulators during embryonic development has been very limited due to the challenges in identifying the appropriate dosing and timing while avoiding Shh over-expression mediated developmental defects. For example, we have shown in mice that acute maternal treatment with SAG, when administered to dams in high doses at GD 9.25 of pregnancy, can result in pre-axial polydactyly (Fish et al., 2017). One promising recent study used SAG pre-natally in mice at E11.25 to partially rescue congenital palate defects with the study observing that the extent of phenotypic recovery was variable (Shin et al., 2019).
We have previously demonstrated that zebrafish embryos, when exposed to ethanol during the gastrulation to neurulation transition, develop morphological defects in brain and eyes (Burton et al., 2017; Zhang et al., 2014). In our study, we used a short binge ethanol exposure of zebrafish embryos at 8-10 hpf that gave close to 100% penetrance of morphological defects (microphthalmia and lack of MHB formation). In contrast, lower doses of ethanol only induce these phenotypes in a subset of embryos, as we showed here and before (Zhang et al., 2014). Further, we have shown previously that the actual tissue exposure of the zebrafish embryos is ~33% of the ethanol dose (Zhang et al., 2014), a finding comparable to other studies with zebrafish ((Loucks et al., 2012) and refs therein). In this zebrafish model, we have shown that timing and dose of SAG is critical in mitigating the effects of embryonic ethanol exposure. SAG was able to rescue both the microphthalmia defect and lack of MHB formation in a dose dependent manner when given immediately post-ethanol exposure, with almost complete rescue observed at SAG concentrations of 5 and 10 μM. Treatment of embryos with SAG pre-ethanol exposure was less effective and more variable compared to post-ethanol SAG in preventing morphological defects and this may be due to the low expression of smo we observed at this time (low at 6 hpf compared to 8 and 10 hpf). Overall, the stability of smo expression indicates its potential as a therapeutic target in the hours following ethanol exposure. To further validate our pharmacological rescue approach and confirm the effect was SMO-mediated, we also assessed the ability of another SMO agonist, purmorphamine (PUR) (Sinha et al., 2006; Wu et al., 2002; Wu et al., 2004), to reduce the small eye phenotype induced by ethanol exposure. SAG and PUR both bind SMO (Kozielewicz et al., 2020; Sinha et al., 2006), presumably in the same binding pocket (Wang et al., 2014), and they are chemically distinct from the point of view of scaffold or pharmacophore arrangement. We found that PUR was also able to rescue the ethanol-induced small eye defect when given post-ethanol exposure, strengthening our conclusion that the rescue is mediated via SMO signaling.
As we have done previously, pax6a was used as a readout of Shh pathway activity during eye development (Zhang et al., 2014; Zhang et al., 2011). Based on whole mount in situ hybridization, we observed that ethanol exposure caused an altered pattern of pax6a mRNA expression in the retina and that SAG treatment restored this altered pax6a expression to levels comparable to normal. We also observed that ethanol exposure modestly decreased the expression of the shh transcriptional markers, glia/b and gli2a/b at 24 hpf. Although not a direct comparison, it has been previously shown in zebrafish embryos that chronic exposure to ethanol (2.5% for 4 to 24 hpf) reduced gli1 expression ~2-fold at 8 hpf but not at 24 hpf (Loucks et al., 2007). In our study, SAG treatment alone at 10-12 hpf led to a significant increase in these Shh markers, with SAG treatment post-ethanol exposure restoring gli1/2 levels close to untreated levels. Our findings suggest SAG is acting through the canonical Shh pathway.
Another focus of our study was to assess if pharmacologically activating SMO post-ethanol exposure in the embryo would also rescue long-term behavioral deficits seen in juvenile fish. For this experiment, we used a lower ethanol exposure given during early gastrulation, that in juvenile zebrafish does not elicit morphological defects but does affect behavior (Burton et al., 2017; Zhang et al., 2014). We utilized the novel tank diving assay and as we previously observed (Burton et al., 2017), juvenile zebrafish not exposed to ethanol spend almost the whole 5 minutes at the bottom of the tank due to anxiety-related behavior. In contrast, those exposed to acute ethanol as embryos (1% at 5.25-6.25 hpf) had dramatically increased risk-taking behavior compared to unexposed fish, as determined by the increase in time swimming closer to the top of the tank than near the bottom. While SAG treatment itself did not affect tank exploration, when given post-ethanol it was able to ameliorate the altered risk-taking behavior of the juvenile zebrafish. This finding provides additional support for the role of Shh signaling in both brain development and long-term behavior. Importantly, this functional assessment reveals the efficacy of SAG’s protection to both low and high levels of embryonic ethanol exposure. These data support our previous study showing that shh mRNA overexpression prior to ethanol exposure could restore the juvenile swimming response in the novel tank diving test (Burton et al., 2017).
5. CONCLUSIONS
The primary goal of this study was to investigate whether birth defects and behavioral changes caused by embryonic ethanol exposure could be rescued by pharmacological intervention when given prenatally. Reduced Shh pathway signaling has been strongly implicated in FASD and therefore is an attractive molecular target for pharmacological intervention. Hence, we hypothesized that restoring Shh signaling at the correct timing with respect to prenatal ethanol exposure could counteract the morphological and behavioral effects elicited by ethanol’s teratogenesis. In our study, we chose to use a zebrafish model of embryonic ethanol exposure that allowed us to test a wide range of treatment doses and developmental timings that included an extended longitudinal study that would be challenging to undertake with rodent models. Our studies contribute to the wider body of knowledge showing that zebrafish models are valuable as models for ethanol teratogenesis (Lovely et al., 2016), and for assessing the developmental consequences of neurotoxicity (Martin et al., 2020). We have demonstrated that a number of the changes in brain formation and function associated with PAE can be rescued using a single dose of a small molecule SMO-targeted agonist given at specific developmental timing to increase Shh signaling. In addition, SAG treatment did not appear to have any long term detrimental effects on zebrafish development. Our findings provide further evidence for the central role of abrogated Shh signaling in the pathogenesis of FASD, and provides for potential therapeutic intervention of a pharmacological activator that restores Shh signaling to mitigate the symptoms of FASD.
Supplementary Material
Supplemental Fig. 1. Effects of ethanol and SAG treatment alone on eye size in zebrafish embryos. (a) Zebrafish embryos were exposed at 8-10 hpf to 3%, 4% or 5% ethanol (n=26 for each), untreated control embryos (n=48). Main effect of treatment F(3, 122)=87.12, p<0.0001. (b) Representative images for control (i) and ethanol alone (ii to iv) exposures. (c) Zebrafish embryos were treated at 6-8 hpf with 1 (n=27), 2.5 (n=20), 5 (n=18) or 10 μM (n=10) SAG, untreated control embryos (n=48). F(4, 118)=3.479, p=0.101. (d) at 10-12 hpf with 1 (n=21), 2.5 (n=20), 5 (n=25) or 10 μM (n=33) SAG, untreated control embryos (n=21). (e) Representative images for SAG alone treatments, 6-8 hpf (i to iv) and 10-12 hpf (v to viii). The calibration bar indicates 50 μm. Eye diameter was measured at 2 dpf as described in Methods. Data were evaluated by one-way ANOVA followed by Dunnett’s multiple comparisons test using GraphPad Prism version 8.02. Groups are compared to control. **** Significantly different from control, p < 0.0001. See Supplemental Table 1 for summary of all n and multiple comparisons p values.
Supplemental Fig. 2. Purmorphamine, an alternative Smo agonist, is also able to rescue ethanol induced effects on eye development. (a) Chemical structures of SAG and purmorphamine (PUR). (b) Relative hedgehog pathway activity of SAG and PUR in the C3H10T1/2 Shh responsive cell-based assay. C3H10T1/2 cells were plated overnight and then different concentrations of SAG or PUR were added and cells incubated for a further 5 days. Alkaline phosphatase (AP) activity was measured using pNPP as the substrate and plates read at 405 nm. Dose response run in triplicate. EC50 values were determined by non-linear regression in GraphPad 8.0. (c) Effects of PUR treatment on rescuing ethanol induced ocular size defects in 2 dpf zebrafish embryos. Zebrafish embryos exposed to 5% ethanol alone at 8-10 hpf (EtOH), SAG (10 μM) or PUR (100 μM) alone at 10-12 hpf, or first exposed to 5% ethanol at 8-10 hpf and then treated with PUR (100 μM) or SAG (10 μM) at 10-12 hpf. Eye diameter was measured at 2 dpf as described in Methods. n > 10 embryos per treatment. Data in (c) were evaluated by one-way ANOVA followed by Dunnett’s multiple comparisons test using GraphPad Prism version 8.02. Groups are compared to ethanol treated alone (EtOH). ANOVA summary was F(5,102) = 53.65, p<0.0001. Significant rescue is observed when SAG or PUR is given post-ethanol treatment (**** p<0.0001 for both). See Supplemental Table 1 for summary of all n and multiple comparisons p values. (d) Representative images for control (i), EtOH alone (ii), SAG alone (iii), PUR alone (iv), EtOH + SAG (v) and EtOH + PUR (vi) exposures. Eye diameter was measured at 2 dpf as described in Methods. The calibration bar indicates 50 μm.
Supplemental Fig. 3. Effects of ethanol and SAG treatment alone on MHB formation in zebrafish embryos. (a) Zebrafish embryos were exposed at 8-10 hpf to 3%, 4% or 5% ethanol and effects on MHB formation assessed as described in Methods. Percent absence of MHB present are shown. Fisher’s exact test was used to compare absence of MHB between groups (compared to control). MHB absent in 0/45 control, 5/34 3% EtOH (*p=0.0123), 16/34 4% EtOH (****p<0.0001) and 16/18 5% EtOH (****p<0.0001). In 4 independent experiments, for controls we observed 0/35, 0/36, 0/38 and 0/45 disrupted MHB, and for embryos exposed to 5% EtOH we observed 24/24, 32/35 16/18 and 23/24 disrupted MHB. (b) Effects on MHB formation of treating embryos with SAG (5 μM) alone at 6-8 hpf or 10-12 hpf. Fisher’s exact test was used to compare absence of MHB between groups (compared to control). MHB absent in 0/36 control, 23/24 5% EtOH (****p<0.0001), 1/38 6-8 hpf 5 μM SAG (ns, p>0.9999) and 0/34 10-12 hpf 5 μM SAG (ns, p>0.9999). (c) Representative images for (i) control, (ii) SAG (5 μM) and (iii) EtOH (5%) alone. No effects on MHB were observed up to dose of 10 μM SAG. Arrow indicates defined MHB border. MHB was assessed at 24 hpf as described in Methods.
Supplemental Fig. 4. Quantitation of gli1a/b mRNA expression in 2 dpf zebrafish embryos previously treated with SAG at 6-8 hpf or 10-12 hpf. Zebrafish embryos (n ≥ 10 per time point), either controls or treated with SAG (10 μM) at 6-8 hpf or 10-12 hpf. RNA was isolated, gli1a/b mRNA quantified by qRT-PCR and normalized to internal rpl13a mRNA control. Gene expression as described in Methods. n≥10 pooled embryos per treatment (2 replicates/pooled group). Data shown as fold change relative to control. Gli1a/b expression was increased more when SAG was given alone at 10-12 hpf (2.2-fold increase for gli1a and 3.6-fold increase for gli1b relative to control) compared to given alone at 6-8 hpf (1.3-fold increase for gli1a and 1.8-fold increase for gli1b relative to control).
Summary of ANOVA p-values
Significance Statement.
FASD is a worldwide burden affecting ~2-5% of the global population annually (Roozen et al., 2018). The mechanisms by which ethanol promotes the severity of birth defects associated with FASD is an area of great interest. Our studies demonstrate in a vertebrate model of embryonic alcohol exposure that chemicals targeting specific developmental pathways, when given at specific timing, can diminish the incidence or severity of alcohol-induced birth defects including reversing developmental eye and brain defects, and longer-term behavioral deficits. Ultimately, this study will aid in our understanding of alcohol’s teratogenic mechanism of action and provide ideas regarding potential interventions for FASD.
AKNOWLEDGEMENTS
We thank Shanta Mackinnon, Chengjin Zhang and Christopher Laudeman for technical assistance, and thank Kathy Sulik and Rob Lipinski for early discussions. Additional expression data and citations were retrieved from the ZFIN database (Ruzicka et al., 2019). The graphical abstract was created in part with BioRender.com.
Funding Information
This study was supported by an award from NIH/NIAAA (U54AA019765), with additional funding from NIH awards (P20CA202924, U54CA156735, U54MD012392, R15CA208651, R21AA025400), Komen Graduate Training in Disparities Research award (GTDR16377604) and support from the Golden LEAF Foundation and the BIOIMPACT Initiative of the State of North Carolina.
Footnotes
CONFLICT OF INTEREST
The authors declare no competing financial interests.
DATA AVAILABILITY STATEMENT
The data that support the findings of this study are available from the corresponding author upon reasonable request.
References
- Ahlgren SC, Thakur V, & Bronner-Fraser M (2002). Sonic hedgehog rescues cranial neural crest from cell death induced by ethanol exposure. Proceedings of the National Academy of Sciences, 99(16), 10476–10481. [DOI] [PMC free article] [PubMed] [Google Scholar]
- Albert S, Müller F, Fischer N, Biellmann D, Neumann C, Blader P, & Strähle U (2003). Cyclops-independent floor plate differentiation in zebrafish embryos. Developmental dynamics: an official publication of the American Association of Anatomists, 226(1), 59–66. [DOI] [PubMed] [Google Scholar]
- Aoto K, Shikata Y, Higashiyama D, Shiota K, & Motoyama J (2008). Fetal ethanol exposure activates protein kinase A and impairs Shh expression in prechordal mesendoderm cells in the pathogenesis of holoprosencephaly. Birth Defects Research Part A: Clinical and Molecular Teratology, 82(4), 224–231. [DOI] [PubMed] [Google Scholar]
- Arenzana F, Carvan MJ III, Aijon J, Sanchez-Gonzalez R, Arevalo R, & Porteros A (2006). Teratogenic effects of ethanol exposure on zebrafish visual system development. Neurotoxicology and teratology, 28(3), 342–348. [DOI] [PubMed] [Google Scholar]
- Arsić D, Beasley SW, & Sullivan MJ (2007). Switched-on Sonic hedgehog: A gene whose activity extends beyond fetal development–to oncogenesis. Journal of paediatrics and child health, 43(6), 421–423. [DOI] [PubMed] [Google Scholar]
- Bailey J, Oliveri A, & Levin ED (2013). Zebrafish model systems for developmental neurobehavioral toxicology. Birth Defects Research Part C: Embryo Today: Reviews, 99(1), 14–23. [DOI] [PMC free article] [PubMed] [Google Scholar]
- Bailey J, Oliveri A, Zhang C, Frazier J, Mackinnon S, Cole G, & Levin E (2015). Long-term behavioral impairment following acute embryonic ethanol exposure in zebrafish. Neurotoxicology and teratology, 48, 1–8. [DOI] [PMC free article] [PubMed] [Google Scholar]
- Bergeron SA, Milla LA, Villegas R, Shen M-C, Burgess SM, Allende ML, Karlstrom RO, & Palma V (2008). Expression profiling identifies novel Hh/Gli-regulated genes in developing zebrafish embryos. Genomics, 91(2), 165–177. [DOI] [PMC free article] [PubMed] [Google Scholar]
- Blader P, & Strähle U (1998). Ethanol impairs migration of the prechordal plate in the zebrafish embryo. Developmental biology, 201(2), 185–201. [DOI] [PubMed] [Google Scholar]
- Boa-Amponsem O, Zhang C, Burton D, Williams KP, & Cole GJ (2020). Ethanol and cannabinoids regulate zebrafish GABAergic neuron development and behavior in a sonic hedgehog and fibroblast growth factor dependent mechanism. Alcoholism: Clinical and Experimental Research, 44, (7), 1366–1377. [DOI] [PMC free article] [PubMed] [Google Scholar]
- Boa-Amponsem O, Zhang C, Mukhopadhyay S, Ardrey I, & Cole GJ (2019). Ethanol and cannabinoids interact to alter behavior in a zebrafish fetal alcohol spectrum disorder model. Birth defects research. [DOI] [PubMed] [Google Scholar]
- Boschen KE, Ptacek TS, Berginski ME, Simon JM, & Parnell SE (2021). Transcriptomic analyses of gastrulation-stage C57BL/6J and C57BL/6NHsd mouse embryos with differential susceptibility to alcohol. Disease models & mechanisms, 14(6), dmm049012. doi: 10.1242/dmm.049012 [DOI] [PMC free article] [PubMed] [Google Scholar]
- Brennan D, & Giles S (2014). Ocular involvement in fetal alcohol spectrum disorder: a review. Current pharmaceutical design, 20(34), 5377–5387. [DOI] [PubMed] [Google Scholar]
- Briscoe J (2006). Agonizing hedgehog. Nature chemical biology, 2(1), 10–11. [DOI] [PubMed] [Google Scholar]
- Burton DF, Zhang C, Boa-Amponsem O, Mackinnon S, & Cole GJ (2017). Long-term behavioral change as a result of acute ethanol exposure in zebrafish: Evidence for a role for sonic hedgehog but not retinoic acid signaling. Neurotoxicology and teratology, 61, 66–73. [DOI] [PMC free article] [PubMed] [Google Scholar]
- Cadena PG, Cadena MRS, Sarmah S, & Marrs JA (2020). Folic acid reduces the ethanol-induced morphological and behavioral defects in embryonic and larval zebrafish (Danio rerio) as a model for fetal alcohol spectrum disorder (FASD). Reproductive Toxicology, 96, 249–257. [DOI] [PMC free article] [PubMed] [Google Scholar]
- Cavodeassi F, Creuzet S, & Etchevers HC (2019). The hedgehog pathway and ocular developmental anomalies. Human genetics, 138, 917–936. [DOI] [PMC free article] [PubMed] [Google Scholar]
- Chandrasena AN, Mukherjee RA, & Turk J (2009). Fetal alcohol spectrum disorders: an overview of interventions for affected individuals. Child and Adolescent Mental Health, 14(4), 162–167. [Google Scholar]
- Chechneva O, Mayrhofer F, Daugherty D, Krishnamurty R, Bannerman P, Pleasure DE, & Deng W (2014). A Smoothened receptor agonist is neuroprotective and promotes regeneration after ischemic brain injury. Cell death & disease, 5(10), e1481. [DOI] [PMC free article] [PubMed] [Google Scholar]
- Chen JK, Taipale J, Young KE, Maiti T, & Beachy PA (2002). Small molecule modulation of Smoothened activity. Proceedings of the National Academy of Sciences, 99(22), 14071–14076. [DOI] [PMC free article] [PubMed] [Google Scholar]
- Chen S-D, Yang J-L, Hwang W-C, & Yang D-I (2018). Emerging Roles of Sonic Hedgehog in Adult Neurological Diseases: Neurogenesis and Beyond. International journal of molecular sciences, 19(8), 2423. [DOI] [PMC free article] [PubMed] [Google Scholar]
- Chen W, Burgess S, & Hopkins N (2001). Analysis of the zebrafish smoothened mutant reveals conserved and divergent functions of hedgehog activity. [DOI] [PubMed] [Google Scholar]
- Cordero D, Marcucio R, Hu D, Gaffield W, Tapadia M, & Helms JA (2004). Temporal perturbations in sonic hedgehog signaling elicit the spectrum of holoprosencephaly phenotypes. The Journal of clinical investigation, 114(4), 485–494. [DOI] [PMC free article] [PubMed] [Google Scholar]
- Das I, Park J-M, Shin JH, Jeon SK, Lorenzi H, Linden DJ, Worley PF, & Reeves RH (2013). Hedgehog agonist therapy corrects structural and cognitive deficits in a Down syndrome mouse model. Science translational medicine, 5(201), 201ra120–201ra120. [DOI] [PMC free article] [PubMed] [Google Scholar]
- Eberhart JK, & Parnell SE (2016). The genetics of fetal alcohol spectrum disorders. Alcoholism: Clinical and Experimental Research, 40(6), 1154–1165. [DOI] [PMC free article] [PubMed] [Google Scholar]
- Eberhart JK, Swartz ME, Crump JG, & Kimmel CB (2006). Early Hedgehog signaling from neural to oral epithelium organizes anterior craniofacial development. Development, 133(6), 1069–1077. [DOI] [PubMed] [Google Scholar]
- Ericson J, Rashbass P, Schedl A, Brenner-Morton S, Kawakami A, Van Heyningen V, Jessell T, & Briscoe J (1997). Pax6 controls progenitor cell identity and neuronal fate in response to graded Shh signaling. Cell, 90(1), 169–180. [DOI] [PubMed] [Google Scholar]
- Fernandes Y, Rampersad M, & Gerlai R (2015). Impairment of social behaviour persists two years after embryonic alcohol exposure in zebrafish: A model of fetal alcohol spectrum disorders. Behavioural brain research, 292, 102–108. [DOI] [PMC free article] [PubMed] [Google Scholar]
- Fish EW, Murdaugh LB, Sulik KK, Williams KP, & Parnell SE (2017a). Genetic vulnerabilities to prenatal alcohol exposure: Limb defects in sonic hedgehog and GLI2 heterozygous mice. Birth defects research, 109(11), 860–865. [DOI] [PMC free article] [PubMed] [Google Scholar]
- Fish EW, Murdaugh LB, Zhang C, Boschen KE, Boa-Amponsem O, Mendoza-Romero HN, Tarpley M, Chdid L, Mukhopadhyay S, & Cole GJ (2019). Cannabinoids exacerbate alcohol teratogenesis by a CB1-hedgehog interaction. Scientific reports, 9(1), 1–16. [DOI] [PMC free article] [PubMed] [Google Scholar]
- Fish EW, Parnell SE, Sulik KK, Baker LK, Murdaugh LB, Lamson D, & Williams KP (2017b). Preaxial polydactyly following early gestational exposure to the smoothened agonist, SAG, in C57BL/6J mice. Birth defects research, 109(1), 49–54. [DOI] [PMC free article] [PubMed] [Google Scholar]
- Flentke GR, & Smith SM (2018). The avian embryo as a model for fetal alcohol spectrum disorder. Biochemistry and Cell Biology, 96(2), 98–106. [DOI] [PMC free article] [PubMed] [Google Scholar]
- Foltran F, Gregori D, Franchin L, Verduci E, & Giovannini M (2011). Effect of alcohol consumption in prenatal life, childhood, and adolescence on child development. Nutrition reviews, 69(11), 642–659. [DOI] [PubMed] [Google Scholar]
- Frank-Kamenetsky M, Zhang XM, Bottega S, Guicherit O, Wichterle H, Dudek H, Bumcrot D, Wang FY, Jones S, & Shulok J (2002). Small-molecule modulators of Hedgehog signaling: identification and characterization of Smoothened agonists and antagonists. Journal of biology, 1(2), 10. [DOI] [PMC free article] [PubMed] [Google Scholar]
- Glickman NS, Kimmel CB, Jones MA, & Adams RJ (2003). Shaping the zebrafish notochord. Development, 130(5), 873–887. [DOI] [PubMed] [Google Scholar]
- Heine VM, Griveau A, Chapin C, Ballard PL, Chen JK, & Rowitch DH (2011). A small-molecule smoothened agonist prevents glucocorticoid-induced neonatal cerebellar injury. Science translational medicine, 3(105), 105ra104–105ra104. [DOI] [PMC free article] [PubMed] [Google Scholar]
- Heyne GW, Everson JL, Ansen-Wilson LJ, Melberg CG, Fink DM, Parins KF, Doroodchi P, Ulschmid CM, & Lipinski RJ (2016). Gli2 gene-environment interactions contribute to the etiological complexity of holoprosencephaly: evidence from a mouse model. Disease models & mechanisms, 9(11), 1307–1315. [DOI] [PMC free article] [PubMed] [Google Scholar]
- Heyne GW, Melberg CG, Doroodchi P, Parins KF, Kietzman HW, Everson JL, Ansen-Wilson LJ, & Lipinski RJ (2015). Definition of critical periods for Hedgehog pathway antagonist-induced holoprosencephaly, cleft lip, and cleft palate. PloS one, 10(3), e0120517. [DOI] [PMC free article] [PubMed] [Google Scholar]
- Hong M, & Krauss RS (2012). Cdon mutation and fetal ethanol exposure synergize to produce midline signaling defects and holoprosencephaly spectrum disorders in mice. PLoS genetics, 8(10), e1002999. [DOI] [PMC free article] [PubMed] [Google Scholar]
- Hong M, & Krauss RS (2013). Rescue of holoprosencephaly in fetal alcohol-exposed Cdon mutant mice by reduced gene dosage of Ptch1. PloS one, 8(11), e79269. [DOI] [PMC free article] [PubMed] [Google Scholar]
- House AJ, Daye LR, Tarpley M, Addo K, Lamson DS, Parker MK, Bealer WE, & Williams KP (2015). Design and characterization of a photo-activatable hedgehog probe that mimics the natural lipidated form. Archives of biochemistry and biophysics, 567, 66–74. [DOI] [PMC free article] [PubMed] [Google Scholar]
- Hu Q, Li T, Wang L, Xie Y, Liu S, Bai X, Zhang T, Bo S, Xin D, & Xue H (2017). Neuroprotective effects of a smoothened receptor agonist against early brain injury after experimental subarachnoid hemorrhage in rats. Frontiers in cellular neuroscience, 10, 306. [DOI] [PMC free article] [PubMed] [Google Scholar]
- Jin Y, Barnett A, Zhang Y, Yu X, & Luo Y (2017). Poststroke sonic hedgehog agonist treatment improves functional recovery by enhancing neurogenesis and angiogenesis. Stroke, 48(6), 1636–1645. [DOI] [PMC free article] [PubMed] [Google Scholar]
- Jones K (1986). Fetal alcohol syndrome. Pediatr Rev, 8, 122–125. [DOI] [PubMed] [Google Scholar]
- Kahn BM, Corman TS, Lovelace K, Hong M, Krauss RS, & Epstein DJ (2017). Prenatal ethanol exposure in mice phenocopies Cdon mutation by impeding Shh function in the etiology of optic nerve hypoplasia. Disease models & mechanisms, 10(1), 29–37. [DOI] [PMC free article] [PubMed] [Google Scholar]
- Karlstrom RO, Tyurina OV, Kawakami A, Nishioka N, Talbot WS, Sasaki H, & Schier AF (2003). Genetic analysis of zebrafish gli1 and gli2 reveals divergent requirements for gli genes in vertebrate development. Development, 130(8), 1549–1564. [DOI] [PubMed] [Google Scholar]
- Kashyap B, Frey RA, & Stenkamp DL (2011). Ethanol-induced microphthalmia is not mediated by changes in retinoic acid or sonic hedgehog signaling during retinal neurogenesis. Alcoholism: Clinical and Experimental Research, 35(9), 1644–1661. [DOI] [PMC free article] [PubMed] [Google Scholar]
- Kiecker C (2016). The chick embryo as a model for the effects of prenatal exposure to alcohol on craniofacial development. Developmental biology, 415(2), 314–325. [DOI] [PubMed] [Google Scholar]
- Kietzman HW, Everson JL, Sulik KK, & Lipinski RJ (2014). The teratogenic effects of prenatal ethanol exposure are exacerbated by Sonic Hedgehog or GLI2 haploinsufficiency in the mouse. PloS one, 9(2), e89448. [DOI] [PMC free article] [PubMed] [Google Scholar]
- Kimmel CB, Ballard WW, Kimmel SR, Ullmann B, & Schilling TF (1995). Stages of embryonic development of the zebrafish. Developmental Dynamics, 203(3), 253–310. [DOI] [PubMed] [Google Scholar]
- Kozielewicz P, Bowin C-F, Turku A, & Schulte G (2020). A NanoBRET-based binding assay for smoothened allows real-time analysis of ligand binding and distinction of two binding sites for BODIPY-cyclopamine. Molecular pharmacology, 97(1), 23–34. [DOI] [PubMed] [Google Scholar]
- Levin ED (2011). Zebrafish assessment of cognitive improvement and anxiolysis: filling the gap between in vitro and rodent models for drug development. Reviews in the Neurosciences, 22(1), 75–84. [DOI] [PMC free article] [PubMed] [Google Scholar]
- Levin ED, & Cerutti DT (2009). Behavioral neuroscience of zebrafish. In: Methods of Behavior Analysis in Neuroscience. Chapter 15, 2nd Ed., Baca Raton, FL: CTC Press/Taylor & Francis. [Google Scholar]
- Li Y-X, Yang H-T, Zdanowicz M, Sicklick JK, Qi Y, Camp TJ, & Diehl AM (2007). Fetal alcohol exposure impairs Hedgehog cholesterol modification and signaling. Laboratory investigation, 87(3), 231. [DOI] [PubMed] [Google Scholar]
- Lipinski RJ, Song C, Sulik KK, Everson JL, Gipp JJ, Yan D, Bushman W, & Rowland IJ (2010). Cleft lip and palate results from Hedgehog signaling antagonism in the mouse: Phenotypic characterization and clinical implications. Birth Defects Research Part A: Clinical and Molecular Teratology, 88(4), 232–240. [DOI] [PMC free article] [PubMed] [Google Scholar]
- Loucks E, & Ahlgren S (2012). Assessing teratogenic changes in a zebrafish model of fetal alcohol exposure. Journal of visualized experiments: JoVE(61), e3704. [DOI] [PMC free article] [PubMed] [Google Scholar]
- Loucks EJ, & Ahlgren SC (2009). Deciphering the role of Shh signaling in axial defects produced by ethanol exposure. Birth Defects Research Part A: Clinical and Molecular Teratology, 85(6), 556–567. [DOI] [PubMed] [Google Scholar]
- Loucks EJ, Schwend T, & Ahlgren SC (2007). Molecular changes associated with teratogen-induced cyclopia. Birth Defects Research Part A: Clinical and Molecular Teratology, 79(9), 642–651. [DOI] [PubMed] [Google Scholar]
- Lovely CB, Fernandes Y, & Eberhart JK (2016). Fishing for fetal alcohol spectrum disorders: zebrafish as a model for ethanol teratogenesis. Zebrafish, 13(5), 391–398. [DOI] [PMC free article] [PubMed] [Google Scholar]
- Martin NR, & Plavicki JS (2020). Advancing zebrafish as a model for studying developmental neurotoxicology. Journal of neuroscience research, 98(6), 981–983. [DOI] [PMC free article] [PubMed] [Google Scholar]
- Mich JK, Payumo AY, Rack PG, & Chen JK (2014). In vivo imaging of Hedgehog pathway activation with a nuclear fluorescent reporter. PloS one, 9(7), e103661. [DOI] [PMC free article] [PubMed] [Google Scholar]
- Muller F, Chang B, Albert S, Fischer N, Tora L, & Strahle U (1999). Intronic enhancers control expression of zebrafish sonic hedgehog in floor plate and notochord. Development, 126(10), 2103–2116. [DOI] [PubMed] [Google Scholar]
- Muralidharan P, Sarmah S, & Marrs JA (2015). Zebrafish retinal defects induced by ethanol exposure are rescued by retinoic acid and folic acid supplement. Alcohol, 49(2), 149–163. [DOI] [PMC free article] [PubMed] [Google Scholar]
- Nakamura T, Aikawa T, Iwamoto-Enomoto M, Iwamoto M, Higuchi Y, Maurizio P, Kinto N, Yamaguchi A, Noji S, & Kurisu K (1997). Induction of Osteogenic Differentiation by Hedgehog Proteins. Biochemical and biophysical research communications, 237(2), 465–469. [DOI] [PubMed] [Google Scholar]
- Nguyen V, Sabeur K, Maltepe E, Ameri K, Bayraktar O, & Rowitch DH (2018). Sonic Hedgehog Agonist Protects Against Complex Neonatal Cerebellar Injury. The Cerebellum, 17(2), 213–227. [DOI] [PMC free article] [PubMed] [Google Scholar]
- Patten AR, Fontaine CJ, & Christie BR (2014). A comparison of the different animal models of fetal alcohol spectrum disorders and their use in studying complex behaviors. Frontiers in pediatrics, 2, 93. [DOI] [PMC free article] [PubMed] [Google Scholar]
- Ramsay M (2010). Genetic and epigenetic insights into fetal alcohol spectrum disorders. Genome Medicine, 2(4), 27. [DOI] [PMC free article] [PubMed] [Google Scholar]
- Reznikoff CA, Brankow DW, & Heidelberger C (1973). Establishment and characterization of a cloned line of C3H mouse embryo cells sensitive to postconfluence inhibition of division. Cancer research, 33(12), 3231–3238. [PubMed] [Google Scholar]
- Roozen S, Peters G-JY, Kok G, Townend D, Nijhuis J, Koek G, & Curfs L (2018). Systematic literature review on which maternal alcohol behaviours are related to fetal alcohol spectrum disorders (FASD). BMJ open, 8(12), e022578. [DOI] [PMC free article] [PubMed] [Google Scholar]
- Roper RJ, Baxter LL, Saran NG, Klinedinst DK, Beachy PA, & Reeves RH (2006). Defective cerebellar response to mitogenic Hedgehog signaling in Down's syndrome mice. Proceedings of the National Academy of Sciences, 103(5), 1452–1456. [DOI] [PMC free article] [PubMed] [Google Scholar]
- Ruzicka L, Howe DG, Ramachandran S, Toro S, Van Slyke CE, Bradford YM, Eagle A, Fashena D, Frazer K, & Kalita P (2019). The Zebrafish Information Network: new support for non-coding genes, richer Gene Ontology annotations and the Alliance of Genome Resources. Nucleic acids research, 47(D1), D867–D873. [DOI] [PMC free article] [PubMed] [Google Scholar]
- Sandor S, & Elias S (1968). The influence of aethyl-alcohol on the development of the chick embryo. Rev. Roum. Embryol. Cytol. Ser. Embryol, 5, 1–26. [Google Scholar]
- Schwend T, & Ahlgren SC (2009). Zebrafish con/disp1 reveals multiple spatiotemporal requirements for Hedgehog-signaling in craniofacial development. BMC developmental biology, 9(1), 59. [DOI] [PMC free article] [PubMed] [Google Scholar]
- Schwend T, Loucks EJ, & Ahlgren SC (2010). Visualization of Gli activity in craniofacial tissues of hedgehog-pathway reporter transgenic zebrafish. PloS one, 5(12), e14396. [DOI] [PMC free article] [PubMed] [Google Scholar]
- Shin J-O, Song J, Choi HS, Lee J, Lee K, Ko HW, & Bok J (2019). Activation of sonic hedgehog signaling by a Smoothened agonist restores congenital defects in mouse models of endocrine-cerebro-osteodysplasia syndrome. EBioMedicine, 49, 305–317. [DOI] [PMC free article] [PubMed] [Google Scholar]
- Sinha S, & Chen JK (2006). Purmorphamine activates the Hedgehog pathway by targeting Smoothened. Nature chemical biology, 2(1), 29–30. [DOI] [PubMed] [Google Scholar]
- Smith SM (2008). The avian embryo in fetal alcohol research. In Nagy LE, Alcohol. Methods in Molecular Biology, Vol. 447 (pp. 75–84). Humana Press. [DOI] [PubMed] [Google Scholar]
- Sulik KK, & Johnston MC (1983). Sequence of developmental alterations following acute ethanol exposure in mice: craniofacial features of the fetal alcohol syndrome. American Journal of Anatomy, 166(3), 257–269. [DOI] [PubMed] [Google Scholar]
- Sulik KK, Johnston MC, & Webb MA (1981). Fetal alcohol syndrome: embryogenesis in a mouse model. Science, 214(4523), 936–938. [DOI] [PubMed] [Google Scholar]
- Tarpley M, Oladapo HO, Strepay D, Caligan TB, Chdid L, Shehata H, Roques JR, Thomas R, Laudeman CP, & Onyenwoke RU (2021). Identification of harmine and β-carboline analogs from a high-throughput screen of an approved drug collection; profiling as differential inhibitors of DYRK1A and monoamine oxidase A and for in vitro and in vivo anti-cancer studies. European Journal of Pharmaceutical Sciences, 162, 105821. [DOI] [PMC free article] [PubMed] [Google Scholar]
- Wang C, Wu H, Evron T, Vardy E, Han GW, Huang X-P, Hufeisen SJ, Mangano TJ, Urban DJ, & Katritch V (2014). Structural basis for Smoothened receptor modulation and chemoresistance to anticancer drugs. Nature communications, 5(1), 1–11. [DOI] [PMC free article] [PubMed] [Google Scholar]
- Wang X, Zhao Z, Muller J, Iyu A, Khng AJ, Guccione E, Ruan Y, & Ingham PW (2013). Targeted inactivation and identification of targets of the Gli2a transcription factor in the zebrafish. Biology open, 2(11), 1203–1213. [DOI] [PMC free article] [PubMed] [Google Scholar]
- Williams K, Rayhorn P, Chi-Rosso G, Garber EA, Strauch KL, Horan G, Reilly JO, Baker DP, Taylor FR, Koteliansky V, & Pepinsky R (1999). Functional antagonists of sonic hedgehog reveal the importance of the N terminus for activity. Journal of cell science, 112(23), 4405–4414. [DOI] [PubMed] [Google Scholar]
- Wu X, Ding S, Ding Q, Gray NS, & Schultz PG (2002). A small molecule with osteogenesis-inducing activity in multipotent mesenchymal progenitor cells. Journal of the American Chemical Society, 124(49), 14520–14521. [DOI] [PubMed] [Google Scholar]
- Wu X, Walker J, Zhang J, Ding S, & Schultz PG (2004). Purmorphamine induces osteogenesis by activation of the hedgehog signaling pathway. Chemistry & biology, 11(9), 1229–1238. [DOI] [PubMed] [Google Scholar]
- Xu J, Srinivas BP, Tay SY, Mak A, Yu X, Lee SG, Yang H, Govindarajan KR, Leong B, & Bourque G (2006). Genomewide expression profiling in the zebrafish embryo identifies target genes regulated by Hedgehog signaling during vertebrate development. Genetics, 174(2), 735–752. [DOI] [PMC free article] [PubMed] [Google Scholar]
- Yelin R, Kot H, Yelin D, & Fainsod A (2007). Early molecular effects of ethanol during vertebrate embryogenesis. Differentiation, 75(5), 393–403. [DOI] [PubMed] [Google Scholar]
- Yu RM, Lin CC, Chan P, Chow ESH, Murphy MB, Chan BP, Muüller F, Straähle U, & Cheng S (2006). Four-dimensional imaging and quantification of gene expression in early developing zebrafish (Danio rerio) embryos. Toxicological Sciences, 90(2), 529–538. [DOI] [PubMed] [Google Scholar]
- Zhang C, Anderson A, & Cole GJ (2015). Analysis of crosstalk between retinoic acid and sonic hedgehog pathways following ethanol exposure in embryonic zebrafish. Birth Defects Research Part A: Clinical and Molecular Teratology, 103(12), 1046–1057. [DOI] [PMC free article] [PubMed] [Google Scholar]
- Zhang C, Frazier JM, Chen H, Liu Y, Lee J-A, & Cole GJ (2014). Molecular and morphological changes in zebrafish following transient ethanol exposure during defined developmental stages. Neurotoxicology and teratology, 44, 70–80. [DOI] [PMC free article] [PubMed] [Google Scholar]
- Zhang C, Ojiaku P, & Cole GJ (2013). Forebrain and hindbrain development in zebrafish is sensitive to ethanol exposure involving agrin, Fgf, and sonic hedgehog function. Birth Defects Research Part A: Clinical and Molecular Teratology, 97(1), 8–27. [DOI] [PMC free article] [PubMed] [Google Scholar]
- Zhang C, Turton QM, Mackinnon S, Sulik KK, & Cole GJ (2011). Agrin function associated with ocular development is a target of ethanol exposure in embryonic zebrafish. Birth Defects Research Part A: Clinical and Molecular Teratology, 91(3), 129–141. [DOI] [PMC free article] [PubMed] [Google Scholar]
Associated Data
This section collects any data citations, data availability statements, or supplementary materials included in this article.
Supplementary Materials
Supplemental Fig. 1. Effects of ethanol and SAG treatment alone on eye size in zebrafish embryos. (a) Zebrafish embryos were exposed at 8-10 hpf to 3%, 4% or 5% ethanol (n=26 for each), untreated control embryos (n=48). Main effect of treatment F(3, 122)=87.12, p<0.0001. (b) Representative images for control (i) and ethanol alone (ii to iv) exposures. (c) Zebrafish embryos were treated at 6-8 hpf with 1 (n=27), 2.5 (n=20), 5 (n=18) or 10 μM (n=10) SAG, untreated control embryos (n=48). F(4, 118)=3.479, p=0.101. (d) at 10-12 hpf with 1 (n=21), 2.5 (n=20), 5 (n=25) or 10 μM (n=33) SAG, untreated control embryos (n=21). (e) Representative images for SAG alone treatments, 6-8 hpf (i to iv) and 10-12 hpf (v to viii). The calibration bar indicates 50 μm. Eye diameter was measured at 2 dpf as described in Methods. Data were evaluated by one-way ANOVA followed by Dunnett’s multiple comparisons test using GraphPad Prism version 8.02. Groups are compared to control. **** Significantly different from control, p < 0.0001. See Supplemental Table 1 for summary of all n and multiple comparisons p values.
Supplemental Fig. 2. Purmorphamine, an alternative Smo agonist, is also able to rescue ethanol induced effects on eye development. (a) Chemical structures of SAG and purmorphamine (PUR). (b) Relative hedgehog pathway activity of SAG and PUR in the C3H10T1/2 Shh responsive cell-based assay. C3H10T1/2 cells were plated overnight and then different concentrations of SAG or PUR were added and cells incubated for a further 5 days. Alkaline phosphatase (AP) activity was measured using pNPP as the substrate and plates read at 405 nm. Dose response run in triplicate. EC50 values were determined by non-linear regression in GraphPad 8.0. (c) Effects of PUR treatment on rescuing ethanol induced ocular size defects in 2 dpf zebrafish embryos. Zebrafish embryos exposed to 5% ethanol alone at 8-10 hpf (EtOH), SAG (10 μM) or PUR (100 μM) alone at 10-12 hpf, or first exposed to 5% ethanol at 8-10 hpf and then treated with PUR (100 μM) or SAG (10 μM) at 10-12 hpf. Eye diameter was measured at 2 dpf as described in Methods. n > 10 embryos per treatment. Data in (c) were evaluated by one-way ANOVA followed by Dunnett’s multiple comparisons test using GraphPad Prism version 8.02. Groups are compared to ethanol treated alone (EtOH). ANOVA summary was F(5,102) = 53.65, p<0.0001. Significant rescue is observed when SAG or PUR is given post-ethanol treatment (**** p<0.0001 for both). See Supplemental Table 1 for summary of all n and multiple comparisons p values. (d) Representative images for control (i), EtOH alone (ii), SAG alone (iii), PUR alone (iv), EtOH + SAG (v) and EtOH + PUR (vi) exposures. Eye diameter was measured at 2 dpf as described in Methods. The calibration bar indicates 50 μm.
Supplemental Fig. 3. Effects of ethanol and SAG treatment alone on MHB formation in zebrafish embryos. (a) Zebrafish embryos were exposed at 8-10 hpf to 3%, 4% or 5% ethanol and effects on MHB formation assessed as described in Methods. Percent absence of MHB present are shown. Fisher’s exact test was used to compare absence of MHB between groups (compared to control). MHB absent in 0/45 control, 5/34 3% EtOH (*p=0.0123), 16/34 4% EtOH (****p<0.0001) and 16/18 5% EtOH (****p<0.0001). In 4 independent experiments, for controls we observed 0/35, 0/36, 0/38 and 0/45 disrupted MHB, and for embryos exposed to 5% EtOH we observed 24/24, 32/35 16/18 and 23/24 disrupted MHB. (b) Effects on MHB formation of treating embryos with SAG (5 μM) alone at 6-8 hpf or 10-12 hpf. Fisher’s exact test was used to compare absence of MHB between groups (compared to control). MHB absent in 0/36 control, 23/24 5% EtOH (****p<0.0001), 1/38 6-8 hpf 5 μM SAG (ns, p>0.9999) and 0/34 10-12 hpf 5 μM SAG (ns, p>0.9999). (c) Representative images for (i) control, (ii) SAG (5 μM) and (iii) EtOH (5%) alone. No effects on MHB were observed up to dose of 10 μM SAG. Arrow indicates defined MHB border. MHB was assessed at 24 hpf as described in Methods.
Supplemental Fig. 4. Quantitation of gli1a/b mRNA expression in 2 dpf zebrafish embryos previously treated with SAG at 6-8 hpf or 10-12 hpf. Zebrafish embryos (n ≥ 10 per time point), either controls or treated with SAG (10 μM) at 6-8 hpf or 10-12 hpf. RNA was isolated, gli1a/b mRNA quantified by qRT-PCR and normalized to internal rpl13a mRNA control. Gene expression as described in Methods. n≥10 pooled embryos per treatment (2 replicates/pooled group). Data shown as fold change relative to control. Gli1a/b expression was increased more when SAG was given alone at 10-12 hpf (2.2-fold increase for gli1a and 3.6-fold increase for gli1b relative to control) compared to given alone at 6-8 hpf (1.3-fold increase for gli1a and 1.8-fold increase for gli1b relative to control).
Summary of ANOVA p-values
Data Availability Statement
The data that support the findings of this study are available from the corresponding author upon reasonable request.