

Summary
Background:
Obesity is a prevalent health threat and risk factor for type 2 diabetes. In this study, we evaluate the relationship between ceramides, which inhibit insulin secretion and sensitivity, and markers of glucose homeostasis and diabetes remission or recursion in Roux-en-Y gastric bypass (RYGB) patients.
Methods:
The Utah Obesity Study (UOS) is a prospective cohort study, with targeted ceramide and dihydroceramide measurements performed on banked serum samples. The UOS consists of 1156 participants in three groups: a RYGB surgery group, a non-surgery group denied insurance coverage, and severely obese population controls. Clinical examinations and ceramide assessments were performed at baseline, 2, and 12-years post-surgery.
Findings:
Surgery patients (84% female, 42.2±10.6 years of age at baseline) displayed lower levels of several serum dihydroceramides and ceramides at 2 and 12-years following RYGB. By contrast, neither the control group (77% female, 48.7±6.4 years of age at baseline) nor non-surgery group (95% female, 43.0±11.4 years of age at baseline) experienced significant reductions in any species. Using a linear mixed effect model, we found that multiple dihydroceramides and ceramides positively associated with the glycemic control measures HOMA-IR and HbA1c. In surgery group participants with prevalent diabetes, ceramides inversely predict diabetes remission independent of changes in weight.
Conclusions:
Ceramide reductions may explain the insulin-sensitization and diabetes resolution observed in most RYGB surgery patients.
Funding:
This research was funded by the National Institutes of health (NIH), The Juvenile Diabetes Research Foundation, and the American Heart Association.
eTOC blurb
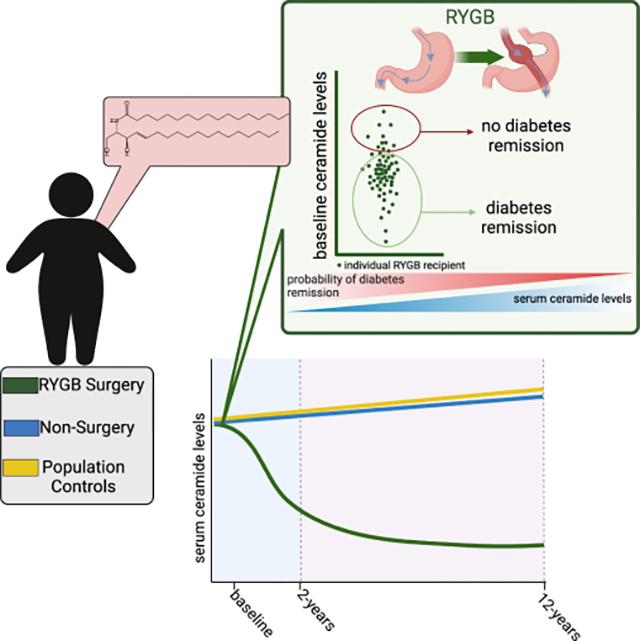
Poss et al. find that Roux-en-Y gastric bypass surgery decreases circulating ceramides for up to 12 years post-surgery. Moreover, the authors identify ceramides as markers of poor glycemic control and inverse predictors of diabetes remission.
Graphical Abstract
Introduction
The global prevalence of obesity has increased dramatically over the last fifty years(1–3), and the condition contributes to noncommunicable diseases including type 2 diabetes (T2D) and cardiovascular disease(4). As a result of these debilitating comorbidities, individuals with severe obesity face a dramatic reduction in lifespan (~20 years) (4). The harmful relationship between obesity and health are unlikely to be explained solely by adipose tissue mass. Instead, obesity likely reflects the presence of a lipotoxic state, where the ectopic deposition of deleterious lipid metabolites in non-adipose tissues drives the cellular dysfunction that underlies disease(5, 6). Studies in preclinical models suggest that ceramides are one of the more harmful and bioactive lipid species that accumulate in lipotoxicity, as they alter metabolism and survival(7, 8) and impair insulin secretion and sensitivity.(7, 8) We thus sought to evaluate the relationship between ceramides and measures of glycemic control in patients undergoing Roux-en-Y gastric bypass (RYGB) surgery—a procedure that is associated with a multitude of metabolic benefits.(9–11)
RYGB is a restrictive-malabsorptive procedure that accounts for 44% of bariatric procedures performed in the United States.(12) The procedure entails surgical division of the stomach into two sections to form a pouch out of the proximal stomach, which restricts the volume of enteral intake. Surgeons divide the proximal jejunum and create a long Roux limb, which they connect to the gastric pouch, with the bile inflow from the duodenum and proximal jejunum reconnected to the Roux limb approximately 100–150 cm distal to the site of the attachment. The procedure results in the malabsorption of ingested fat and carbohydrates(13) and has demonstrated durable weight loss, greatly reducing obesity-related morbidity and mortality.(9–11) Meta-analysis of randomized control trials indicates that patients who undergo bariatric surgery—as compared to those undergoing non-surgical weight loss interventions—lose on average 26 kilograms more body weight and have higher type 2 diabetes remission rates than non-surgical patients(9). For most patients, RYGB results in sustained weight loss and diabetes remission for over a decade.(10, 11) However, RYGB is an invasive procedure with variation in the extent and permanence of weight loss and comorbidity resolution, with a fraction of patients regaining weight and/or re-developing diabetes or other comorbidities in the years following surgery.(10, 14) The studies described herein sought to determine the long-term trajectory of ceramides in patients following RYGB, and to discern their relationships with sustained, glycemic improvements and diabetes remission.
Ceramide synthesis occurs in the endoplasmic reticulum (ER). The first reaction of the multistep pathway (Figure 1A), catalyzed by serine palmitoyltransferase (SPT), condenses fatty (typically palmitoyl-CoA) and amino (typically serine) acids to produce the sphingoid backbone that is characteristic of sphingolipids.(15) In a subsequent reaction, one of six (dihydro)ceramide synthases (CERS1–6) adds a variable acyl chain to the sphingoid scaffold(16), producing much of the variety in the sphingolipid pool. These CERS enzymes demonstrate distinct substrate selectivity and tissue expression patterns. The dihydroceramide products of the CERS reactions can be desaturated in the d4 position of the sphingoid backbone by dihydroceramide desaturase-1 (DES1) to produce the more abundant and deleterious ceramides. Ceramides and dihydroceramides can be trafficked to the Golgi apparatus where they may be converted into more abundant complex sphingolipids such as sphingomyelins (with the addition of phosphocholine), or gangliosides (with the addition of sugar moieties). Ceramides can be re-formed through sphingomyelin hydrolysis or re-acylating sphingosine generated by ceramidase-mediated ceramide breakdown. The ceramide synthesis pathway is thus a complex and dynamic metabolic pathway yielding a multitude of distinct species with unique bioactive signaling roles.
Figure 1. Ceramide synthesis pathway and Utah Obesity Study (UOS) study design schematics.
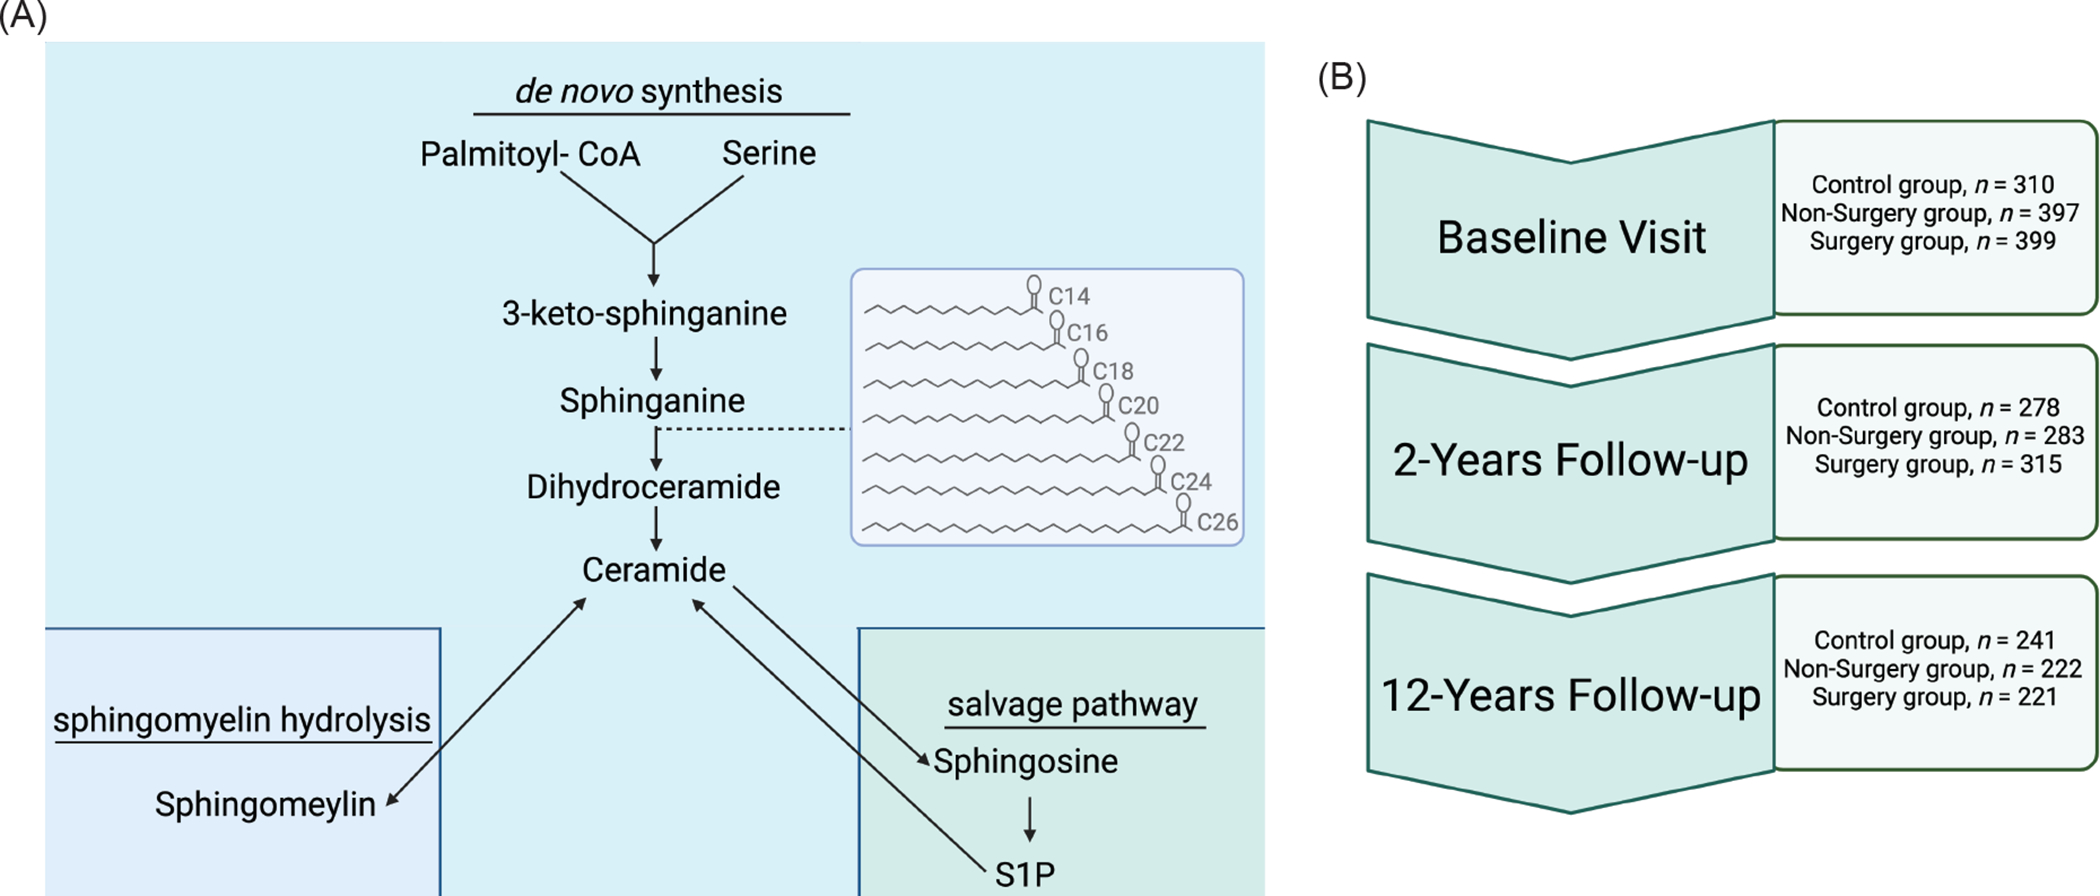
(A) Ceramides are produced through a ubiquitous de novo synthesis pathway. They are the major precursor of complex sphingolipids, and they can be re-formed through the degradation of sphingomyelins or the re-acylation of sphingosine. Much of the diversity of the sphingolipid species comes through the addition of acyl-chains to sphinganine (picture in insert box), through a reaction catalyzed by the CERS enzymes. Though the sphingolipidome is diverse, evidence is mounting that distinct acyl chain and lipid species may have discrete biological roles and tissues of origin. (B) Utah Obesity Study (UOS) sample collection occurred at baseline (pre-surgery), as well as 2-years and 12-years after the procedure. Our workflow included available biospecimen procurement, targeted LC-MS/MS sphingolipid measurement, and data analysis to characterize the response of ceramides and dihydroceramides to Roux-en-Y bariatric surgery and the relationship between ceramides and diabetes remission. Figure generated with BioRender.com
In preclinical models, genetic or pharmacological inhibition of enzymes required for ceramide biosynthesis ameliorates insulin resistance and T2D.(17, 18) In humans, circulating ceramides reflect tissue levels and are potent, cholesterol-independent, clinical markers of diabetes and cardiovascular disease.(19–23) Indeed, because of their predictive value, a small number of clinics have started employing blood-based ceramide scores as markers of adverse health outcomes.(24) A handful of small (n ≤ 20) studies have measured circulating ceramides within the first six months after bariatric surgery.(25–27) Indeed, these studies have generally suggested that a decline in ceramides follows the surgical procedure.(25–27) However, these studies are small, lack obese control groups, and occur during the extreme postoperative weight loss period. We sought to characterize the effect of RYGB on ceramides following the nadir of weight loss using the Utah Obesity Study (UOS), a prospective study that follows RYGB surgery patients (n = 399), non-surgery controls (n = 397), and population controls with severe obesity (n = 310) for 12 years post-surgery (study schematic in Figure 1B). Herein we report the findings of these studies, which revealed dramatic relationships between postsurgical ceramides, measures of insulin sensitivity and glucose control, and diabetes.
Results
The UOS leverages a powerful study design that allows for extensive assessment of clinical outcomes and blood biomarkers following the nadir of maximum weight loss, thus providing an opportunity to interrogate durable post-surgical metabolic alterations. By measuring sphingolipids at baseline, as well as 2 and 12-years post-surgery, we assessed sustained alterations in sphingolipids that were neither a result of the immediate stress response to surgery nor a transient response to the dramatic weight loss that typically occurs in the first year following gastric bypass.
Cohort Characteristics:
General cohort characteristics are presented in Table 1. UOS participants were predominantly female (77% control, 95% non-surgery, 84% surgery), which is typical in the bariatric surgery population.(28) The surgery group lost an average of 35.0% of body weight (kg) at two years, with patients showing subsequent weight gain (8.1%) during the interval between 2- to 12-years post-surgery. A total of 289 surgery group participants re-gained weight in the 2 to 12-year follow-up period.
Table 1.
Clinical Characteristics of Utah Obesity Study (UOS) Participants at Baseline, 2-Years and 12-Years Follow-up.
| Baseline | 2-Years | 12-Years | |||||||
|---|---|---|---|---|---|---|---|---|---|
| Control | Non-Surgery | Surgery | Control | Non-Surgery | Surgery | Control | Non-Surgery | Surgery | |
| Age (years) | 49.55 ± 10.83 | 42.82 ± 11.27 | 42.70 ± 10.87 | 51.76 ± 10.74 | 47.07 ± 11.16 | 46.41 ± 10.72 | 60.31 ± 10.69 | 54.07 ± 10.94 | 54.97 ± 10.41 |
| n | 310 | 397 | 399 | 278 | 283 | 315 | 221 | 222 | 241 |
| Sex | |||||||||
| Female, n (%) | 205 (78) | 280 (86) | 277 (74) | 185 (78) | 200 (86) | 213 (83) | 145 (76) | 161 (88) | 166 (83) |
| BMI (kg/m2) | 43.65 ± 6.40 | 46.21 ± 7.70 | 47.31 ± 7.71 | 43.68 ± 7.36 | 43.96 ± 8.61 | 30.52 ± 6.49 | 42.81 ± 9.28 | 41.77 ± 9.38 | 34.92 ± 8.33 |
| Smoking Status | |||||||||
| Yes, n (%) | 36 (12) | 102 (26) | 109 (28) | 25 (9) | 49 (18) | 65 (21) | 35 (17) | 60 (29) | 65 (28) |
| Anti-hypertensive medication | |||||||||
| Yes, n (%) | 120 (33) | 123 (31) | 138 (35) | 123 (45) | 103 (39) | 45 (15) | 96 (50) | 73 (44) | 44 (23) |
| Systolic Blood Pressure | 128.75 ± 18.80 | 125.19 ± 17.68 | 126.30 ± 19.17 | 127.60 ± 19.30 | 125.13 ± 18.76 | 115.91 ± 18.24 | 125.80 ± 18.74 | 121.22 ± 19.61 | 119.95 ± 18.08 |
| Diastolic Blood Pressure | 72.21 ± 10.48 | 71.92 ± 10.82 | 71.76 ± 11.25 | 71.76 ± 11.21 | 72.71 ± 11.02 | 70.03 ± 9.84 | 69.68 ± 9.30 | 70.75 ± 10.86 | 70.55 ± 10.33 |
| Lipid Lowering Medication | |||||||||
| Yes, n (%) | 40 (15) | 46 (14) | 53 (16) | 55 (23) | 39 (18) | 18 (7) | 65 (38) | 44 (35) | 19 (13) |
| Total Cholesterol (mg/dL) | 188.62 ± 35.64 | 185.15 ± 37.61 | 188.18 ± 33.57 | 189.75 ± 38.10 | 182.03 ± 39.79 | 166.24 ± 32.62 | 176.93 ± 37.14 | 181.47 ± 37.99 | 177.26 ± 31.55 |
| LDL-C (mg/dL) | 106.20 ± 30.45 | 102.21 ± 29.97 | 104.32 ± 28.97 | 113.36 ± 33.95 | 103.95 ± 31.50 | 88.44 ± 28.77 | 102.42 ± 34.57 | 104.02 ± 33.24 | 97.20 ± 28.70 |
| HDL-C (mg/dL) | 47.23 ± 10.92 | 44.60 ± 10.73 | 46.63 ± 11.52 | 44.67 ± 11.47 | 43.32 ± 11.55 | 56.91 ± 13.72 | 47.82 ± 12.56 | 52.44 ± 16.92 | 61.29 ± 18.39 |
| VLDL-C (mg/dL) | 33.12 ± 17.71 | 35.37 ± 22.99 | 34.17 ± 19.90 | 29.56 ± 15.01 | 31.69 ± 26.95 | 19.04 ± 9.76 | 16.34 ± 22.75 | 14.51 ± 15.02 | 8.46 ± 6.50 |
| Triglycerides (mg/dL) | 176.12 ± 86.48 | 193.83 ± 123.43 | 186.19 ± 97.29 | 158.98 ± 77.35 | 179.24 ± 196.75 | 104.37 ± 53.06 | 143.58 ± 81.21 | 138.81 ± 77.31 | 102.92 ± 43.48 |
| Diabetes Characteristics | |||||||||
| Diabetes Status | |||||||||
| Yes, n (%) | 90 (29) | 108 (27) | 86 (22) | 89 (32) | 71 (25) | 18 (6) | 79 (41) | 55 (30) | 24 (12) |
| HbA1c | 5.93 ± 1.09 | 5.99 ± 1.27 | 5.79 ± 1.04 | 6.11 ± 1.02 | 5.95 ± 0.92 | 5.59 ± 0.75 | 6.39 ± 1.59 | 5.98 ± 1.34 | 5.68 ± 0.85 |
| HOMA-IR | 3.65 ± 3.78 | 4.82 ± 4.27 | 5.01 ± 4.80 | 5.04 ± 4.05 | 4.89 ± 5.31 | 1.26 ± 1.33 | 6.15 ± 11.43 | 3.98 ± 7.30 | 2.07 ± 2.27 |
| HOMA-B | 152.81 ± 190.72 | 203.35 ± 209.54 | 232.99 ± 249.98 | 199.40 ± 143.21 | 249.64 ± 241.82 | 162 ± 329.96 | 214.66 ± 502.00 | 169.11 ± 126.18 | 153.09 ± 206.40 |
| Insulin | 13.79 ± 13.06 | 17.88 ± 14.45 | 19.52 ± 16.63 | 18.53 ± 11.41 | 19.02 ± 14.59 | 6.03 ± 6.15 | 20.74 ± 32.38 | 13.86 ± 18.67 | 9.05 ± 8.77 |
| Glucose | 106.65 ± 31.60 | 107.83 ± 41.19 | 101.91 ± 31.28 | 106.09 ± 35.54 | 98.77 ± 31.08 | 83.31 ± 22.10 | 107.69 ± 45.05 | 99.28 ± 38.03 | 89.68 ± 23.08 |
| Glucose-lowering medication | 61 (20) | 78 (20) | 65 (16) | 73 (28) | 60 (23) | 14 (5) | 68 (35) | 49 (27) | 24 (22) |
| Diabetes age of onset | 47.19 ± 10.79 | 39.87 ± 11.15 | 40.24 ± 12.09 | 49.52 ± 13.87 | 48.86 ± 6.34 | 35.75 ± 9.32 | 45.96 ± 10.89 | 39.55 ± 18.21 | |
| Weight at Diabetes Diagnosis | 251.40 ± 47.19 | 266.00 ± 60.40 | 265.59 ± 66.76 | 281.47 ± 73.35 | 288.50 ± 40.20 | 318.00 ± 145.69 | 266 ± 57.03 | 287.50 ± 67.17 | 291.14 ± 86.48 |
| Body Habitus | |||||||||
| Weight (kg) | 123.35 ± 22.94 | 129.73 ± 24.98 | 133.96 ± 26.89 | 123.63 ± 25.30 | 122.84 ± 27.20 | 86.81 ± 21.66 | 118.75 ± 32.45 | 113.41 ± 27.29 | 96.93 ± 26.04 |
| Waist Circumference (cm) | 130.55 ± 15.88 | 134.36 ± 17.15 | 135.89 ± 17.96 | 131.77 ± 16.98 | 129.63 ± 19.42 | 101.77 ± 18.84 | 131.55 ± 20.99 | 127.11 ± 22.10 | 113.88 ± 22.96 |
Clinical characteristics of participants in the UOS (Control, baseline n = 310, 2-years n = 278, 12-years n = 221; Non-Surgery, baseline n = 397, 2-years n = 283, 12-years n = 221; Surgery, baseline n = 399, 2-years n = 315, 12-years n = 241). Continuous variables presented as mean ± standard deviation and categorical variables presented as n (%). BMI, body mass index; LDL-C, low density lipoprotein cholesterol; HDL-C, high density lipoprotein cholesterol; VLDL-C, very low-density lipoprotein cholesterol; ALT, alanine aminotransferase; AST, aspartate aminotransferase; HbA1c, glycated hemoglobin; HOMA-IR, homeostatic model of insulin resistance; HOMA-B, homeostatic model of β-cell function.
Effect of RYGB on Dihydroceramides and Ceramides.
We measured six ceramide species, including the Cer(d18:1/16:0) and Cer(d18:1/18:0) species that have been identified in rodents as likely causal drivers of metabolic dysfunction and insulin resistance.(29, 30) We also quantified six dihydroceramides, which are immediate precursors of ceramides in the de novo synthesis pathway and are often good markers of flux through the enzymatic cascade, as well as being implicated as predictive biomarkers of diabetes.(23) Means and interquartile ranges for the 12 lipids are provided in Table S1. Using multilevel modeling, we demonstrate that surgery decreased levels of several sphingolipid species, either during the (i) baseline to 2-years or (ii) 2-years to 12-years post RYGB intervals. Sphingolipids that were most responsive to surgery included Cer(d18:0/18:0), Cer(d18:0/22:0), Cer(d18:1/18:0), and Cer(d18:1/22:0). For other ceramides, surgery blunted an increase in lipid levels over time; for example, surgery blocked the increase in the potentially pathogenic Cer(d18:1/16:0) species observed in the control and non-surgery groups at the 2- and 12-year time points, as compared to baseline measurements. Surgery similarly blunted increases in Cer(d18:1/20:0), Cer(d18:1/24:0), and Cer(d18:1/24:1). The changes in individual ceramide and dihydroceramides are depicted as a percent change from baseline to 2-years and baseline to 12-years for the control (yellow), non-surgery (blue), and surgery (green) groups (Figure 2). Significance was derived from the multilevel model using log10 transformed lipid concentrations with the raw concentrations visualized in Figure S1. Though not all differences reached significance, many other species followed a similar pattern, with surgery tending to decrease their levels in comparison to the control and non-surgery groups. Interestingly, some species, such as Cer(d18:1/22:0) exhibited a larger magnitude of change from baseline to 12-years than from baseline to 2-years, while others showed the larger changes at the earlier time interval. The reason for these differential patterns is unclear. Table S2 contains estimates and 95% confidence intervals, raw p-values, and Benjamini-Hochberg adjusted p-values for change in ceramide concentration for each study group at each time interval from the multilevel models. To further characterize the relationship between ceramides and weight loss, we performed cross-sectional logistic regression—sequentially adjusting for covariates as noted above—to monitor the association of each lipid species with significant weight loss (defined as a 20% weight decrease from baseline to 2-years, which is previously reported average durable weight loss following RYGB(31)) (Table S3).
Figure 2. Percent change in dihydroceramide and ceramide concentrations from baseline to 2-years and baseline to 12-years in the Utah Obesity Study.
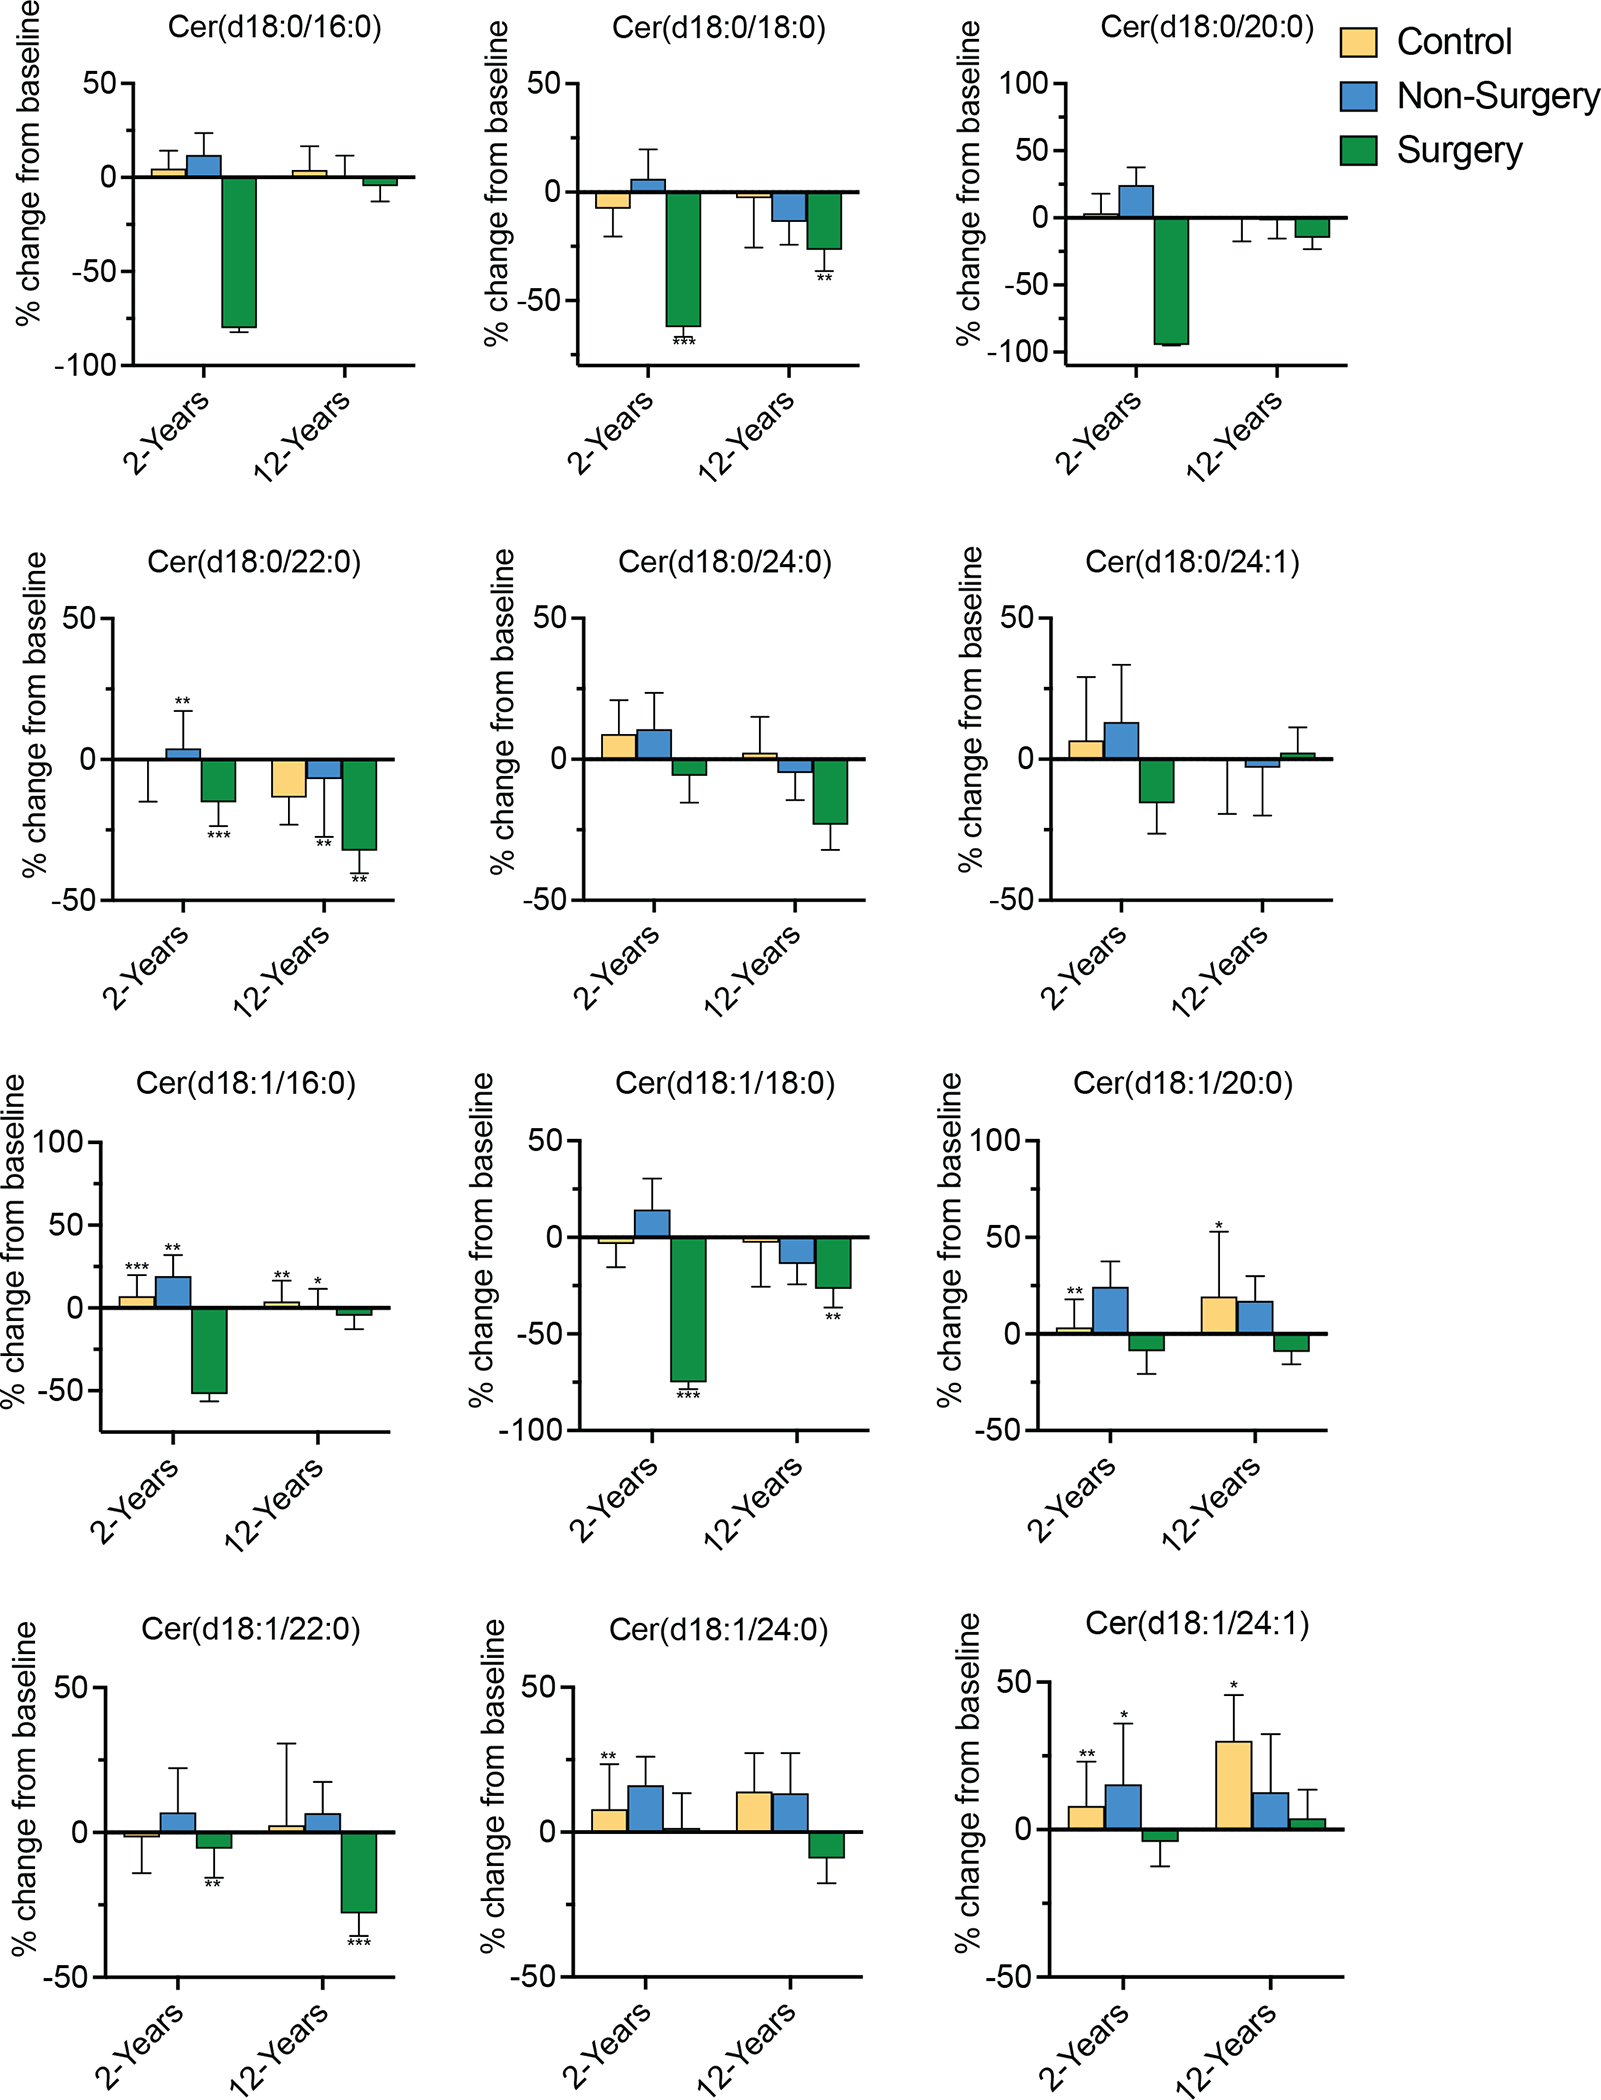
Figure depicts the percent change in six ceramide and six dihydroceramide species over two time intervals (baseline to 2-years; baseline to 12-years) for each of the study groups: control (yellow), non-surgery (blue) and surgery (green). Covariates adjusted for include age, sex, baseline BMI, race, ethnicity, marital status, income, education, smoking status, blood pressure, triglycerides, HDL-C, VLDL-C, LDL-C, anti-hypertensive medication, lipid-lowering medication. Asterisks denote FDR adjusted significance from the multivariable adjusted multilevel model. *denotes p<0.05; **p<0.01; ***p<0.001.
Ceramides associate with measures of poor glycemic control.
We probed the temporal relationships between individual dihydroceramides or ceramides vs. measures of glycemic control [i.e. hemoglobin A1c (HbA1c) and homeostatic model of insulin resistance (HOMA-IR)] using linear mixed effect models. We employed a linear mixed effect model, leveraging the unique longitudinal study design of the UOS and pooling all study visits. This approach allowed us to evaluate the trajectory of HOMA-IR or HbA1c over time in association with the temporal trajectory of individual lipid species. We note that we adjust for study group and BMI at each visit in order to account for post-surgical changes in body habitus. All six dihydroceramides [Cer(d18:0/16:0), Cer(d18:0/18:0), Cer(d18:0/20:0), Cer(d18:0/22:0), Cer(d18:0/24:0), Cer(d18:1/24:1)] and ceramides Cer(d18:1/22:0) and Cer(d18:1/24:0) were positively associated with HbA1c (Figure 3). Similarly, many dihydroceramides [Cer(d18:0/16:0), Cer(d18:0/20:0), Cer(d18:0/22:0), Cer(d18:0/24:0)] and ceramides [Cer(d18:1/22:0) and Cer(d18:1/24:0)] showed positive relationships with HOMA-IR (Figure 4). These data support the hypothesis that ceramides induce insulin resistance, as suggested by preclinical studies in mice and cells.(17, 18, 32) Table S4 contains estimates, 95% confidence intervals BH-corrected p-values for these analyses. In contrast, serum dihydroceramides and ceramides did not associate with the homeostasis model of beta cell function (HOMA-B) (Table S4). The positive significant association with HOMA-IR coupled with the null association with HOMA-B suggests that circulating ceramides in this study associate with insulin resistance, but not insulin secretion.
Figure 3. Marginal effects plots depicting relationships between dihydroceramides/ceramides and glycated hemoglobin.

Log10 transformed serum dihydroceramide and ceramide concentrations positively associate with glycated hemoglobin (HbA1c) levels. Each plot shows the magnitude of increase in HbA1c (y-axis) associated with a given increase in a specific ceramide species (x-axis), with the shaded area representing the 95% confidence interval. For this analysis all three study groups were pooled together, but the model adjusted for study group and BMI at each timepoint in addition to age, sex, baseline BMI, race, ethnicity, marital status, income, education, smoking status, blood pressure, triglycerides, HDL-C, VLDL-C, LDL-C, anti-hypertensive medication, lipid-lowering medication.
Figure 4. Marginal effects plots for dihydroceramide and ceramide concentrations and the homeostatic model of insulin resistance in the Utah Obesity Study.
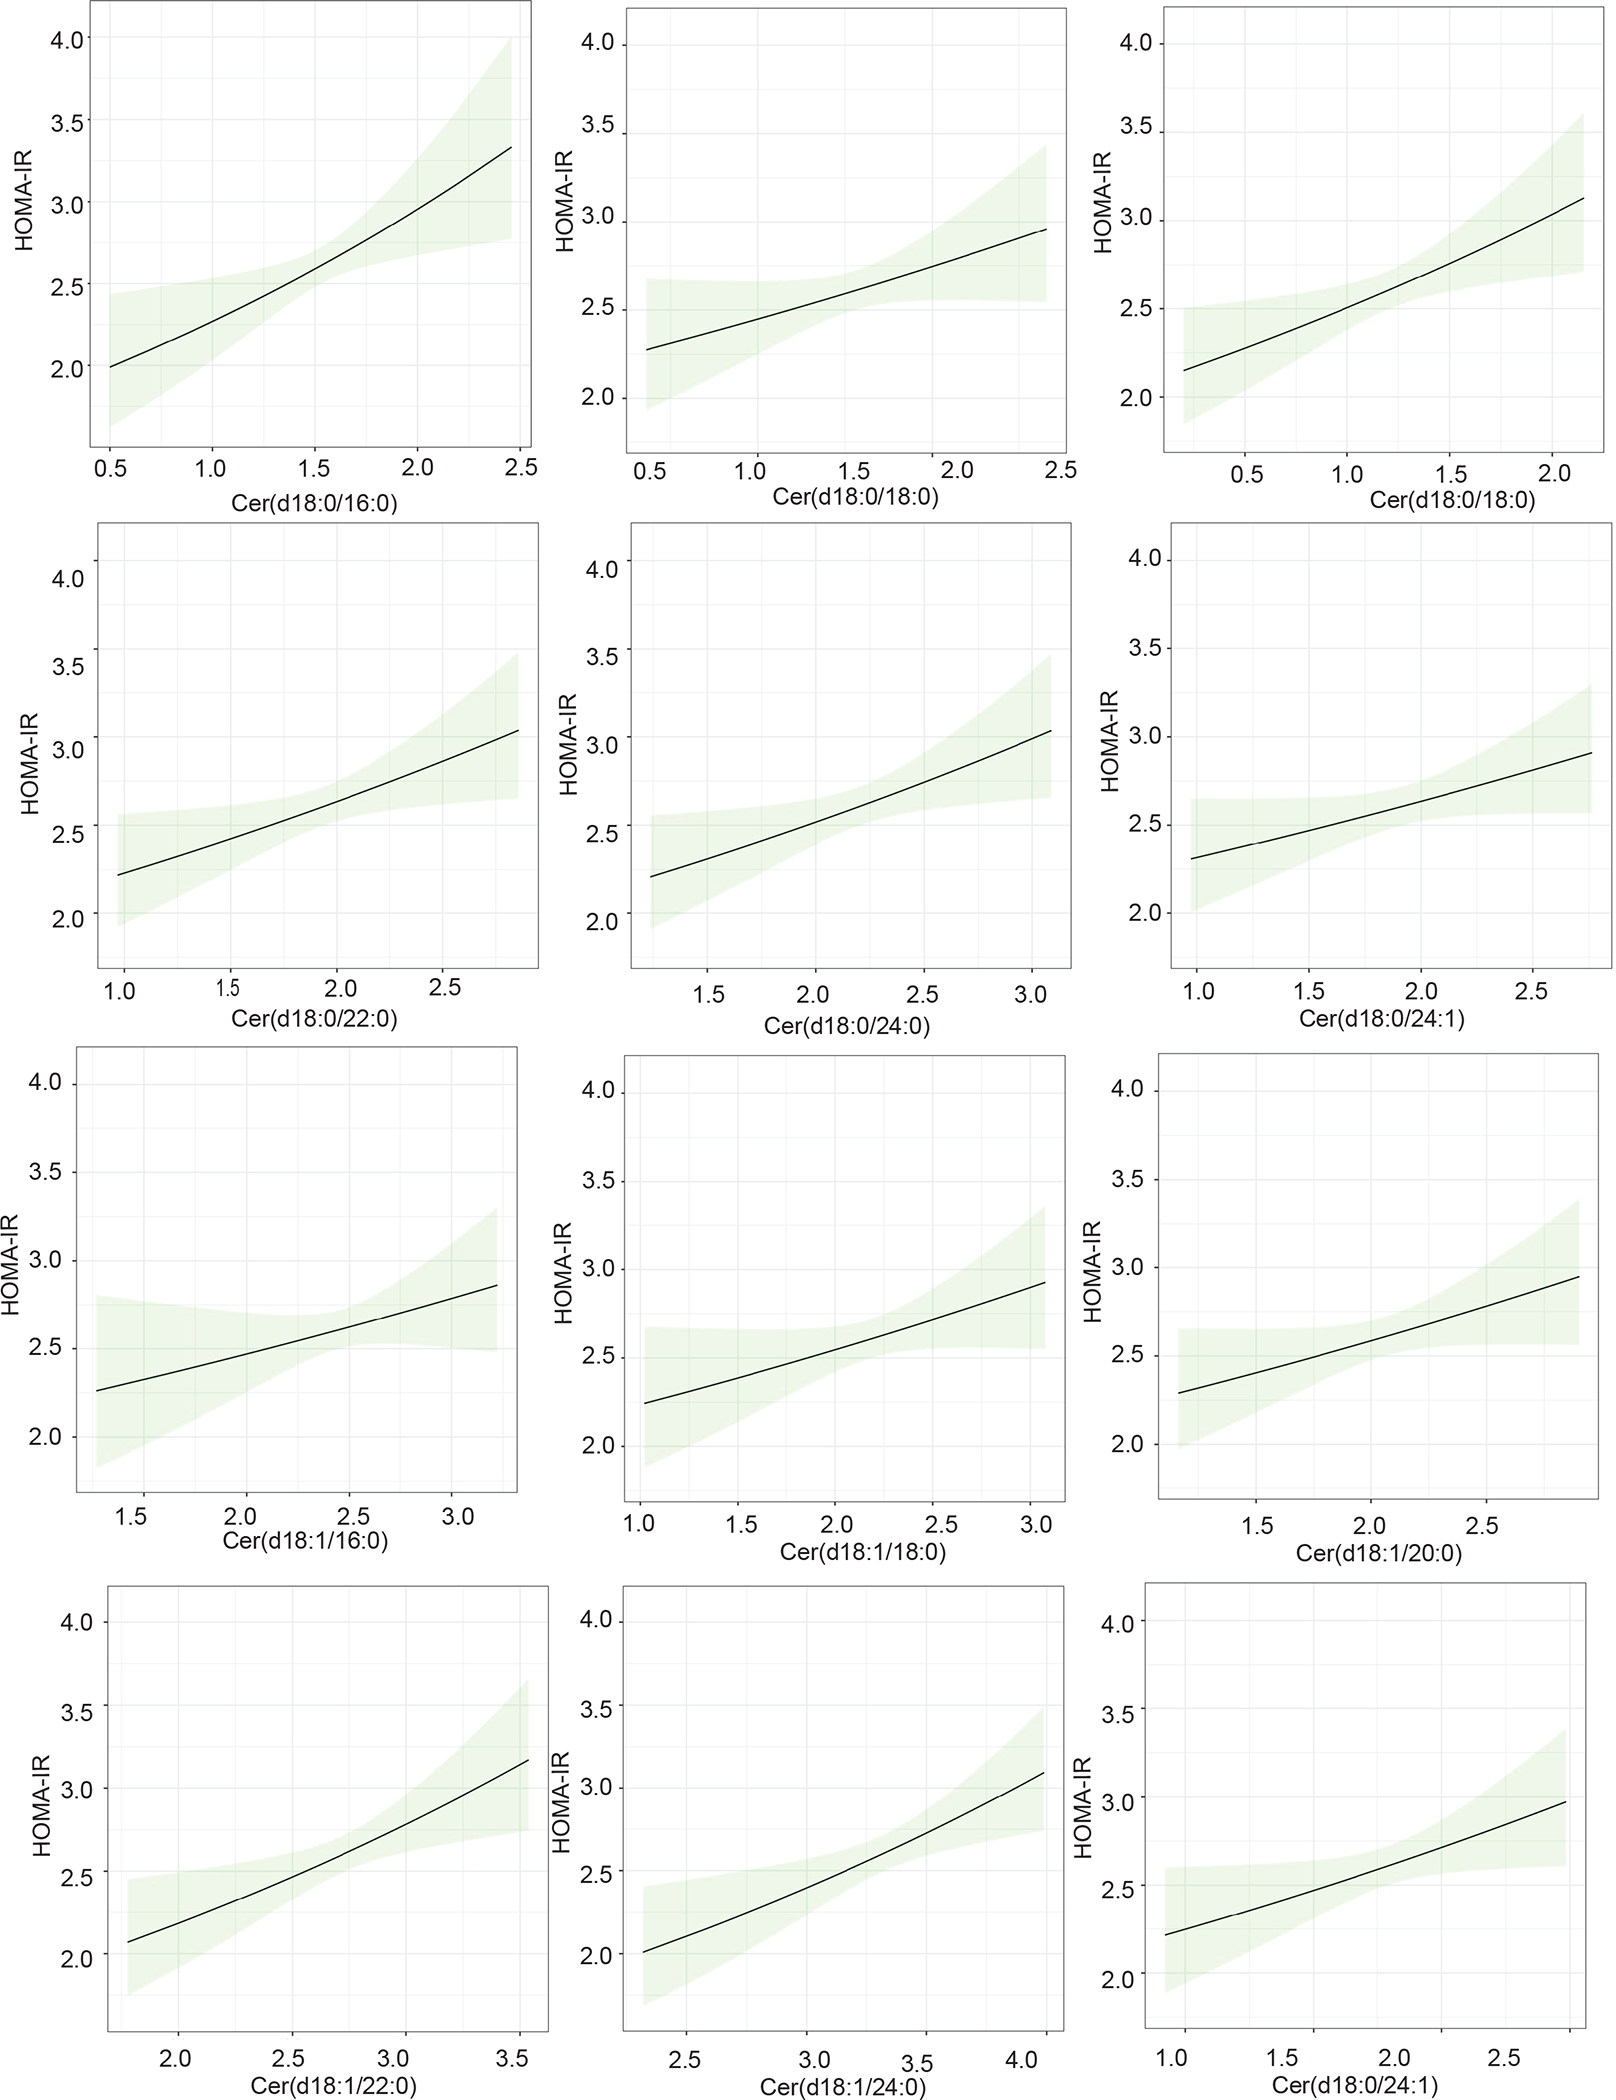
Log10 transformed serum dihydroceramide and ceramide concentrations positively associate with homeostatic model of insulin resistance (HOMA-IR) values. Each plot shows the magnitude of increase in HOMA-IR (y-axis) associated with a given increase in a specific ceramide species (x-axis), with the shaded area representing the 95% confidence interval. For this analysis all three study groups were pooled together, but the model adjusted for study group and BMI at each timepoint in addition to age, sex, baseline BMI, race, ethnicity, marital status, income, education, smoking status, blood pressure, triglycerides, HDL-C, VLDL-C, LDL-C, anti-hypertensive medication, lipid-lowering medication.
Low baseline ceramides predict 2-year diabetes remission and demarcate patients that experience durable diabetes remission.
Since bariatric surgery is one of the few clinical interventions that can lead to diabetes remission, the UOS provides a unique opportunity to evaluate relationships between ceramides and disease resolution. Indeed, 73% of the diabetic patients (16.5% of the total surgery group, n = 66), experienced either a transient or sustained resolution of diabetes (Figure 5A). Of the 67 participants with serum ceramide data available at baseline and 2-years, 18 had persistent diabetes and 49 achieved diabetes remission (i.e., 73% remission rate). Transient remission was defined as the disappearance of diabetes at 2-years but subsequent re-diagnosis at 12-years (n = 9), while sustained remission refers to the resolution of diabetes at the 2- and 12-year time points (n=40). By comparison, 27% of patients (18 patients) failed to achieve any resolution of diabetes.
Figure 5. Assessment of dihydroceramides and ceramides in relation to diabetes remission in surgery group participants.
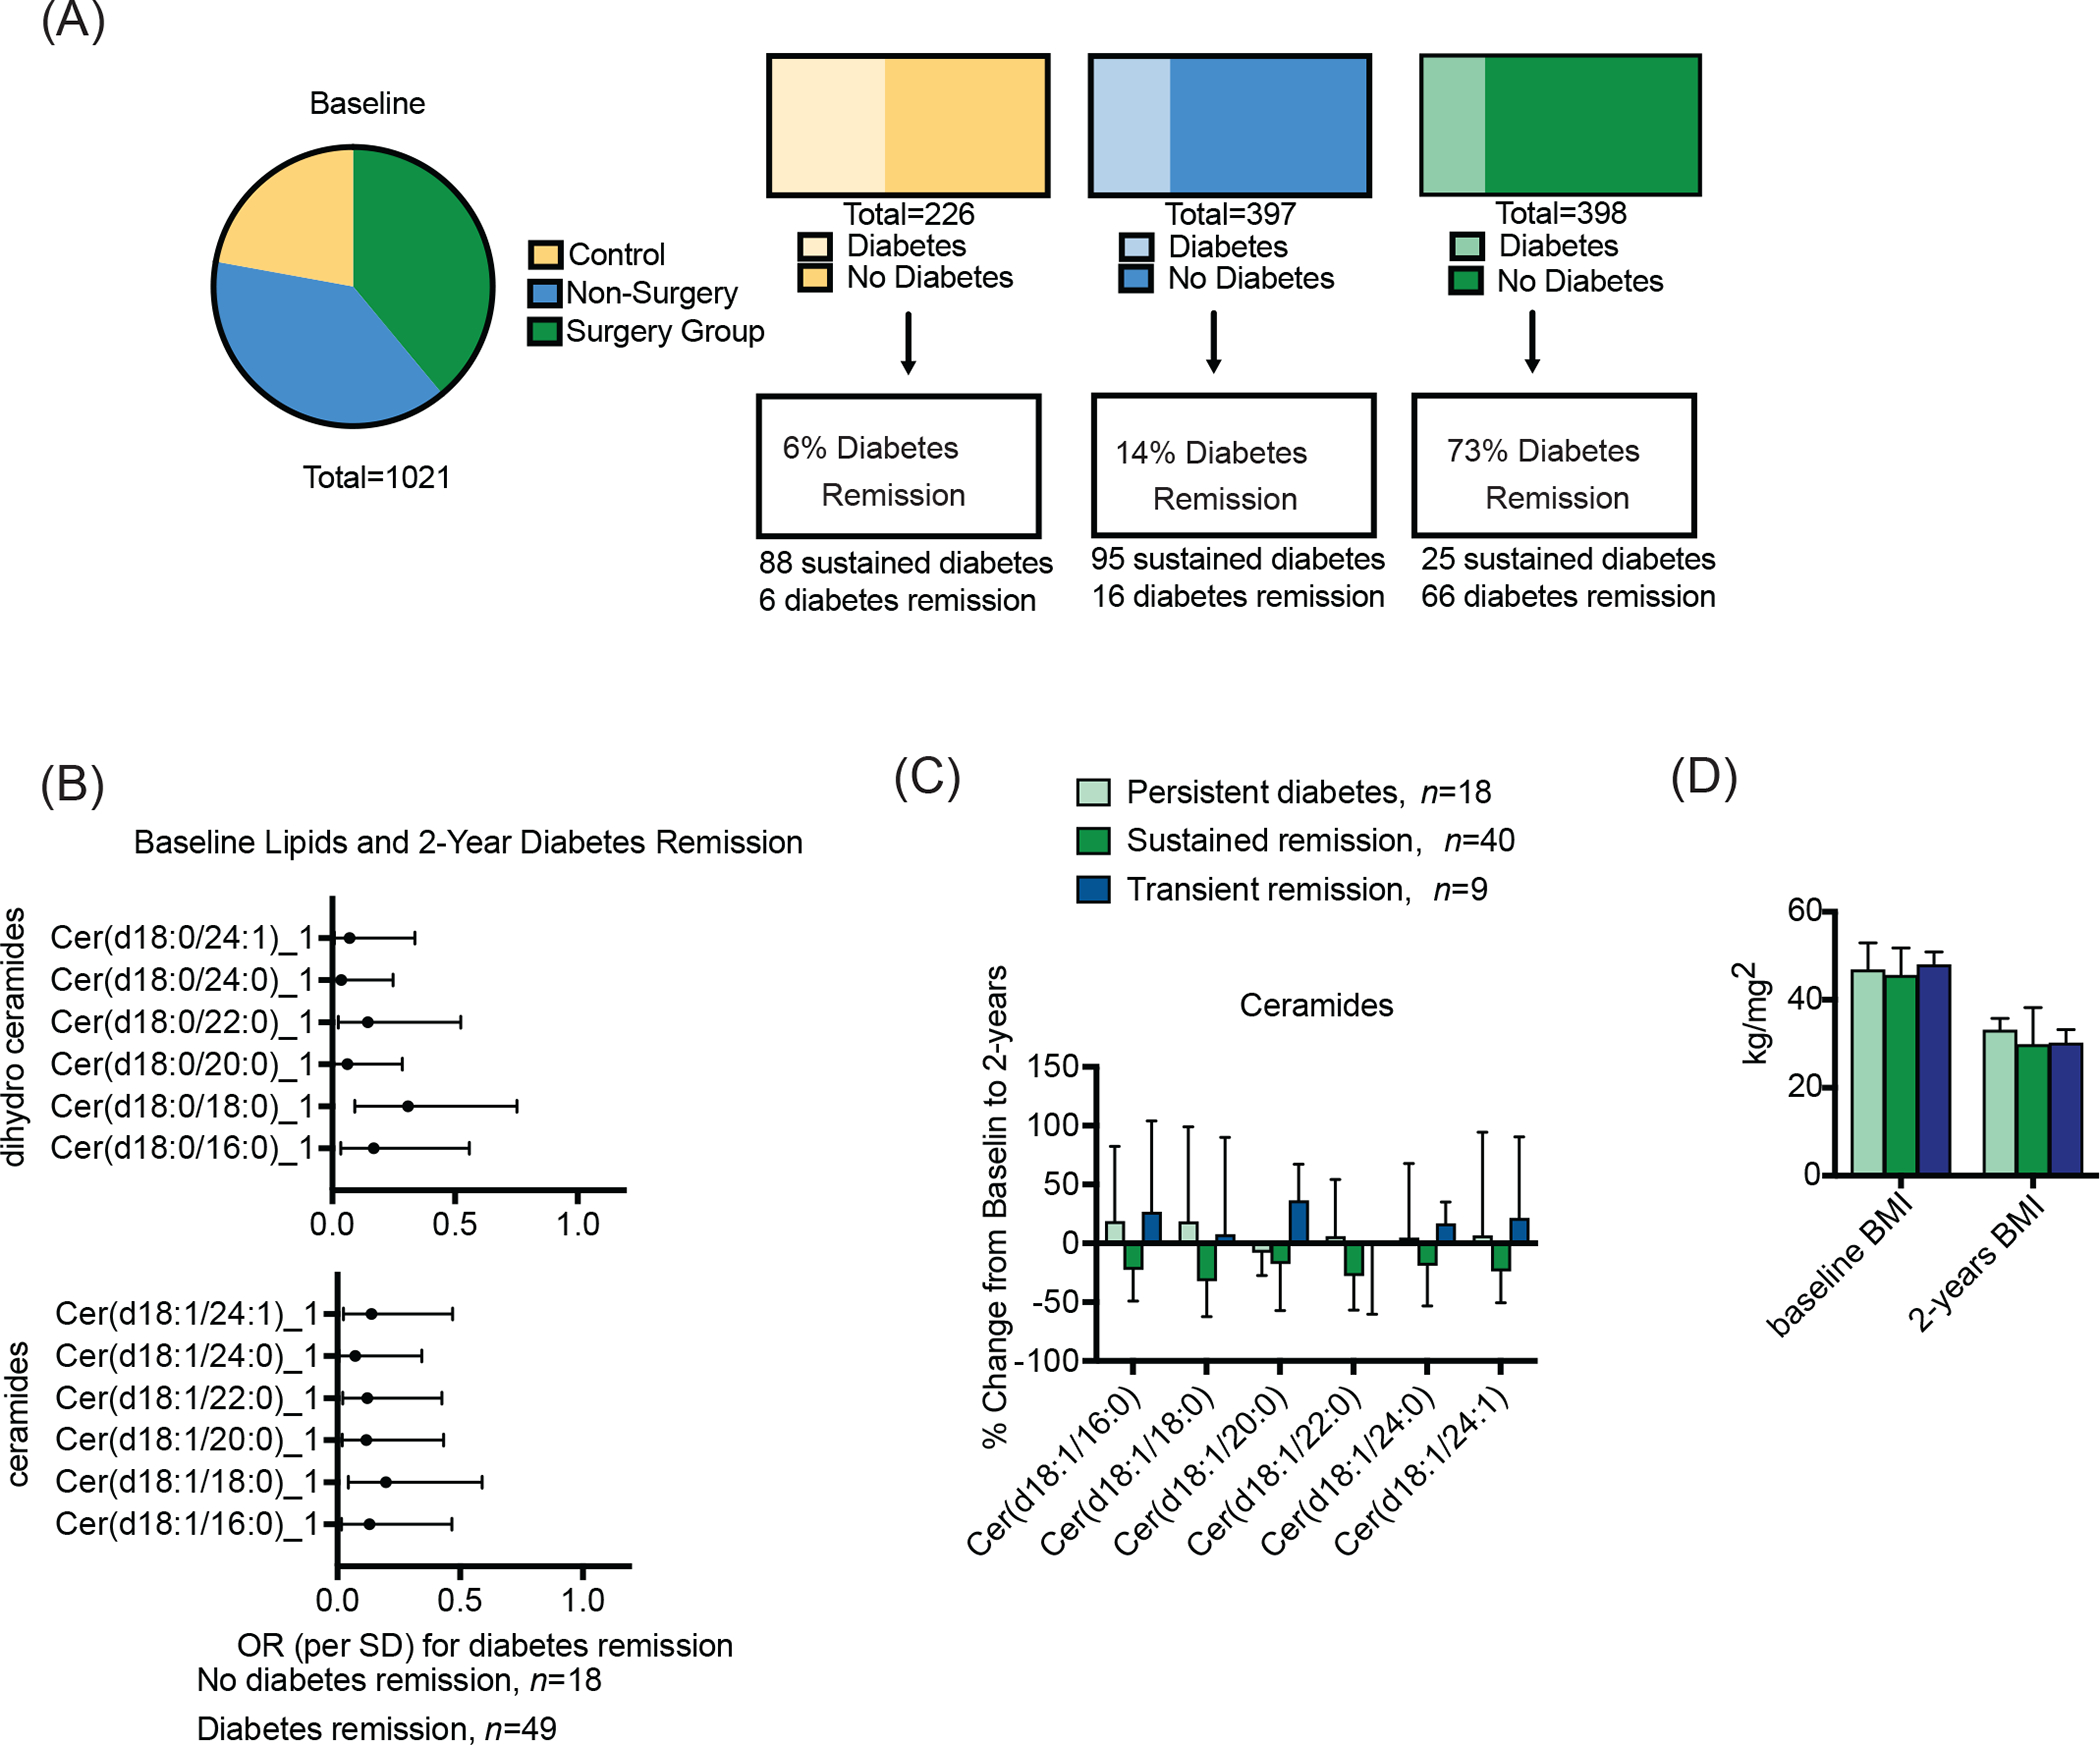
Ceramides and dihydroceramides are assessed in relation to Roux-en-Y gastric bypass induced diabetes remission. (A) Characteristics of each study group, including the proportion of subjects that had diabetes at baseline and the proportion that that achieved diabetes remission at the 2-year follow-up visit. (B) Forest plot of odds ratios for 2-year diabetes remission indicating a significant inverse relationship between 2-year diabetes remission and baseline ceramides and dihydroceramides. (C) Baseline and 2-year ceramides in subjects with diabetes at baseline. We stratified ceramides, reporting the change from baseline at 2-years in people that experienced persistent diabetes throughout the study (i.e. remained diabetic at 2 and 12 year visits; light green), those that experienced sustained diabetes remission (i.e. had resolution of diabetes at the 2 and 12 year visits; dark green), and those that experienced transient diabetes remission (i.e. displayed resolution of diabetes and 2-years, but were re-diagnosed with diabetes by the 12-year visit; navy). (D) Body mass index (BMI) at baseline and 2-years for surgery patients with prevalent diabetes at baseline. Please note the n listed for each analysis next to the graphs. Some study participants did not have biospecimens available for ceramide profiling, hence the difference between figure A and the subsequent figures.
Baseline dihydroceramides and ceramides predict 2-year diabetes remission (Figure 5B). A table with odds ratios, 95% confidence intervals and p-values for the association of baseline and 2-year ceramides with diabetes remission can be found in Table S5. Associations were significant when adjusting for diabetes remission related factors (duration of diabetes, baseline HbA1c, diabetes medication). We also tested whether inclusion of ceramides in a diabetes remission clinical predictive model improved prediction as assessed by receiver operator characteristic-area under the curve (ROC-AUC) C-statistic. We incorporated ceramides and dihydroceramides in a stepwise fashion into a baseline clinical model that includes HbA1c, diabetes duration, and diabetes medication. We retained sphingolipids that improved model fit according to the C-statistic. While no single ceramide species improved the clinical model, the inclusion of all ceramide species had a substantial effect (Figure S4). We repeated the analysis cross-sectionally by including 2-year ceramides, which also improved the clinical model (Figure S3).
We observed a decrease in all ceramide species from baseline to 2-years in participants that experienced diabetes remission (Figure S4). The relationship was less robust for dihydroceramides (data not shown). We conducted a sensitivity analysis to further evaluate relationships between ceramides and the durability of diabetes remission, finding that the sphingolipids were inversely associated with sustained diabetes remission (Figure 5C). These data suggest that ceramides levels may decline in surgical individuals that are to achieve prolonged (i.e. 12-year) resolution of diabetes, but remain elevated in those that were going to re-develop the disease (Figure 5C). However, these sensitivity analysis results did not reach significance, perhaps due to the small number of individuals in each of these unique subgroups. Nonetheless, these provocative data suggest that even before re-diagnosis, transient remission patients may already exhibit a ceramide pattern similar to the persistent diabetes group, suggesting that ceramides contribute to diabetes etiology. This pattern in post-surgical ceramide levels was independent of weight, and BMI was unrelated to diabetes status in the surgical patients (P=.949) (Figure 5D). Thus, monitoring ceramides post-surgery has predictive potential to reveal ultimate outcomes on diabetes remission and in remission durability.
Ceramides do not associate with weight regain.
In order to explore the relationship between ceramides and post-RYGB weight regain in the 2 to 12-year period, we performed a linear regression with individual lipid species as the exposure and % weight re-gain as the outcome. We observed no significant associations at the FDR<0.05 level between ceramides at 2-years or 12-years with post-RYGB weight re-gain (Table S6). For the control and non-surgery groups, the average percent body weight change was 0.6% and 3.5% from baseline to 2-years, respectively. The subsequent weight gain for these groups during the 2 to 12-year interval was 2.9% and 6.5%, respectively.
Ceramides do not associate with serum cholesterol or triglycerides.
In this cohort, RYGB decreases levels of circulating lipids—including LDL, VLDL, and triglycerides—while increasing levels of HDL-cholesterol(10). We evaluated correlations between these lipids with ceramides and dihydroceramides at baseline and 2-years (Table S7; Figure S5A, B). We also correlated percent change in lipid concentration from baseline to 2-years with ceramides and dihydroceramides (Table S7, Figure S5C). These data align with previous publications indicating that sphingolipid species and lipoprotein levels are conditionally independent of one another.(22)
Discussion
We applied a highly quantitative targeted lipidomics method to measure serum sphingolipids in patients undergoing RYGB in order to understand the relationship between serum ceramides and durable glycemic control. The work demonstrated that bariatric surgery reduced levels of several dihydroceramides and ceramides, which positively associated with HOMA-IR and HbA1c. Remarkably, ceramides measured at the baseline visit predicted which patients would fail to achieve diabetes remission. Moreover, ceramides measured two years after surgery appeared to differentiate those that would achieve sustained diabetes remission at the 12-year visit from those that would ultimately fail to sustain normoglycemia. These data indicate that lipotoxic ceramides associate with diabetes development. Moreover, they support the hypotheses generated from studies in preclinical models that ceramides may play causal roles in insulin resistance and diabetes progression.
The results are consistent with several studies in much smaller cohorts (n ≤ 20) that demonstrated acute reductions in serum ceramides in the months that follow bariatric surgery (i.e. up to six months).(25–27) One study reported a singificant decrease in very long chain (VLC) (C22–24) ceramides 1- and 30-days post laparopscopic sleeve gastrectromy.(25) That study similarly reported a positive association between VLC ceramide species and HOMA-IR.(25) In two studies of RYGB recipients with 6-months follow-up, one reported a post-operateive decrease in Cer(d18:1/14:0), Cer(d18:1/16:0), Cer(d18:1/20:0), and Cer(d18:1/24:0) while the other reported decreases in Cer(d18:1/18:0), Cer(d18:1/20:0), Cer(d18:1/24:0), and Cer(d18:1/24:1).(26, 27) Neither of these studies reported Cer(d18:1/22:0) concentrations, which we identify as one of the most dynamic and most dramatically lowered species in the UOS surgery group. These prior studies captured ceramides during the extreme post-operative weight loss period, while the UOS measurements occur following the nadir of weight loss and includes both severely obese non-surgey (i.e., met the criteria for surgery but did not receive it) and severely obese population (i.e., did not pursue bariatric surgery) control groups. Since the UOS is both larger and longer, it provides opportunities to monitor the long-term trajectory of serum ceramides following RYGB, while also permitting an analysis of relationships with disease outcomes. For example, the study population permits us to evaluate ceramides in subjects experiencing wide swings in glucose homeostasis, including some that experience sustained diabetes remission. The data obtained from this robust study population indicate that ceramides associate with glucose homeostasis and support measurements of serum ceramides as markers of long-term metabolic outcomes following surgical weight loss. Importantly, the analysis demonstrates the magnitude of the ceramide-diabetes relationship in a severely obese population, which is the most critical population to target for risk stratification. Furthermore, the findings are consistent with cross-sectional studies showing that ceramides associate with markers of insulin resistance and hyperglycemia and that ceramides are biomarkers of incident type 2 diabetes.(20, 23)
Several studies have shown that diabetes remission is not explained by weight loss alone or degree of weight loss.(11, 33) Indeed, several patients in the UOS achieved sustained reductions in body weight, but failed to achieve prolonged resolution of diabetes. The data presented herein implicate ceramides as a potential contributor to this elusive lipotoxic mechanism. For example, Figure 5 demonstrates that ceramides, but not weight, demarcated patients that failed to achieve prolonged diabetes remission.
RYGB most dramatically decreased levels of ceramides and dihydroceramides containing the C18 or C22 acyl side chains, suggesting a diminution of biosynthetic flux in the tissues that produce these species (Figure 1A). The CERS1 and 4 enzymes—which are primarily expressed in brain and skeletal muscle—add the eighteen carbon (C18) chains to the sphingoid scaffold. Indeed, Cer(d18:1/18:0) is the most abundant ceramide in skeletal muscle, and the lipid has been implicated in insulin resistance and mitochondrial dysfunction.(30) Moreover, the dihydroceramide Cer(d18:1/18:0) has been shown to predict diabetes incidence up to 9 years before disease manifestation.(23) These data are consistent with our findings, as these species were diminished by RYGB and correlated with HOMA-IR. CERS2 and CERS3, which are primarily expressed in kidney, liver and skin, produce the dihydroceramides and ceramides containing twenty-two carbon (C22) acyl chains. Ceramides containing this side chain are also associated with insulin resistance and diabetes incidence in human prospective studies.(23)
One of the most important clinical outcomes of RYGB is the remarkably high rate of diabetes remission.(11) Thus, the UOS presents a unique opportunity to gauge the relationship between ceramides and the disappearance or reappearance of diabetes. In our analyses, all ceramide species at baseline significantly associated with 2-year diabetes remission and also associated with a failure to achieve sustained normoglycemia 12-years after surgery. Moreover, the addition of all ceramide species to a ROC-AUC clinical predictive model containing baseline HbA1c, duration of diabetes, and diabetes medication use, resulted in an improvement of the C-statistic. Ceramides containing the 16:0 acyl-chain are produced by the CERS6 enzyme that is highly expressed in adipose tissue(29). In rodents, deletion of CERS6 reduces Cer(d18:1/16:0) and dramatically improves insulin sensitivity in glucose tolerance.(29) Mechanistically, this appears to occur in part because of the ability of this lipid to induce mitochondrial fission, which decreases their ability to effectively and efficiently oxidize glucose and other substrates.(34) Though our sample size for the diabetes remission analyses was relatively small, our data support the involvement of this lipid in glucose control in humans, suggesting that its accumulation can contribute to diabetes in post-surgical patients, regardless of whether they achieved weight loss.
In conclusion, this study presents exciting findings on the role of ceramides in glucose homeostasis by leveraging a unique and powerful study design in combination with state-of-the-art lipidomics technology. RYGB decreases several ceramide species, particularly in patients that achieved diabetes remission or improved glycemic control. Remarkably, such changes remained significant 12-years after surgery, long after the nadir of weight loss. Moreover, they reinforced the bi-directionality of the ceramide-glucose intolerance relationship, with ceramides positively associated with increased HOMA-IR and HbA1c and inversely associated with sustained diabetes remission. Indeed, the determination that 2-year ceramide measurements predicted outcomes at 12-years supports the use of post-surgical ceramide measurements as a means for gauging patient health. Ultimately, the data reveal a mechanism for RYGB in diabetes remission and suggest that other ceramide-lowering therapeutic strategies may prove efficacious for preventing or treating diabetes.
Limitations of Study:
The long-term follow-up (12-years) after RYGB surgery in the UOS presents an exciting and unique opportunity to look at markers of long-term clinical outcomes. In particular, the UOS has a well-constructed cohort structure that includes two non-surgical control groups, which allow us to account for lifestyle changes pursued by non-surgery patients. The data are robust and suggest potent roles for ceramides as causal factors in insulin resistance and disease. Nonetheless, the analysis has a number of noteworthy weakneses. First, we lack a replication cohort, as other prolonged follow-up analyses of bariatric surgery patients are lacking. Second, the UOS is racially and ethnically homogenous, limiting the generalizability of our findings. Nonetheless, we highlight findings in the Strong Heart Study, comprising large numbers of American Indians; the authors of that study reported similar relationships between ceramides, HOMA-IR, and HbA1c.(20) Third, the UOS lacks a lean control group for comparison. The unavailability of lean counterparts limits some analyses, as virtually all participants meet the criteria for metabolic syndrome at baseline (data not shown). Additionally, we conducted all analyses in an intent-to-treat paradigm, and we did not exclude non-surgery and control participants that pursued weight loss surgeries of interventions outside of the study. Indeed, we know that a small number of patients in the non-surgical group did seek surgery at some later point, desipte being denied initially. We did not exclude those patients, and our findings are thus a conservative estimate of the effects of RGBY surgery. Lastly, the UOS lacks an acute post-operative timepoint (e.g. weeks to months) to track early changes in the lipidome, though previous smaller studies have explored this and reported corrobative findings.(15–17).
STAR methods
RESOURCE AVAILABILITY
Lead contact
Further information and requests should be directed to and will be promptly responded to by the lead contact, Scott Summers, 15N 2030E, Salt Lake City, Utah 84112, USA. Email: scott.a.summers@health.utah.edu
Materials availability
Raw sphingolipid data is deposited at Dataverse and is publicly available (https://doi.org/10.7910/DVN/6UX5UK). Any additional information required to that may be required to reanalyze the data reported in the paper is available from the lead contact upon request.
Data and code availability
All original code has been deposited at Dataverse and is publicly available (https://doi.org/10.7910/DVN/6UX5UK). Any additional information that may be required to reanalyze the data reported in the paper is available from the lead contact upon request.
Experimental model and subject details
The Utah Obesity Study (UOS) is an observational, prospective study initiated in July 2000. Of 1156 patients enrolled, 835 patients with severe obesity visited a single bariatric surgical center (Rocky Mountain Associated Physicians, Salt Lake City), seeking Roux-en-Y gastric bypass (RYGB). Of these, 418 proceeded with surgery (surgery group) and 417 did not, primarily due to denials from insurance companies (non-surgery group). An additional population control group consisting of 321 people with severe obesity was recruited from the Utah area. We measured serum sphingolipids on available biospecimens from 399, 397, and 310 participants in the surgery, non-surgery, and control groups, respectively (Supplemental Figure 2). Participants in the control group were between 18 and 72 years of age, had no history of alcohol or narcotics abuse, and had never undergone bariatric surgery. Study subjects had no history of gastric or duodenal ulcers, myocardial infarction (in the past 6 months), or active cancer (in the past 5 years). The sex distribution of all study groups is skewed towards females (control group = 78% female, non-surgery group = 86% female, surgery group = 74% female). Clinical examinations were performed at baseline, 2-years’, 6 years’ and 12-years’ follow-up. Clinical data were reported previously (10, 14, 35, 36).
At each study examination, data on medical history and lifestyle behaviors were recorded in addition to measurement of clinical parameters. Information on sex, age, and race was self-reported. Gender data was not collected, but ethnicity, education, and income were self-reported. Following the baseline examination, participants in the surgery group underwent RYGB. Participants in the non-surgery and control groups underwent no weight or lifestyle interventions as part of the study, although they were not precluded from pursuing them outside of the study.
The UOS was approved by the Institutional Review Board at the University of Utah and all information was obtained with informed consent from study participants.
Study endpoints.
The primary endpoints are ceramide and dihydroceramide concentrations, which are described in the Supplemental Methods. Additional endpoints include prevalence and remission of T2D. Patients were considered to have T2D if they met one or more of the following conditions: fasting blood glucose ≥ 126 mg per deciliter, glycated hemoglobin (hbA1c) ≥ 6.5%, or current use of anti-diabetic medication. Remission is defined as the postsurgical reversal of these criteria.
Blood sample collection, processing, and storage.
We quantified sphingolipids in all available serum biospecimens, which were collected at baseline, 2-years, and 12-years. The Institutional Review Boards (IRB) at the University of Utah and Intermountain Healthcare approved the study protocol and each patient provided written informed consent. Serum samples were stored at −80°C until liquid chromatography tandem mass spectrometry (LC-MS/MS) lipidomics measurement in March 2020.
Method details
Lipid extraction.
The method for conducting high-throughput lipid extraction from serum samples was derived from a previously described method (37). The internal standard (IS) stock solution containing sphingomyelin (d18:1/17:0) (2502 pmol/sample), dihydroceramine (d18:0/18:1) (5 pmol/sample), d7-ceramide (d18:1-d7/16:0) (6 pmol/sample), d7-ceramide (d18:1-d7/18:0) (2 pmol/sample), d7-ceramide (d18:1-d7/24:0) (152 pmol/sample), d7-ceramide (d18:1-d7/24:1) (20 pmol/sample), glucosylceramide (d18:1/17:0) (50 pmol/sample), and d7-phosphocholine (PC) (15:0–18:1-d7) (500 pmol/sample) was prepared in methanol. Serum samples were thawed at 4°C for 12 hours before proceeding with lipid extraction. Samples were extracted in a 96-well format with 3 columns of controls: a 600-μL isopropanol double blank (DB), a process blank (PB) with 50 μL PBS, and a pooled control human serum sample (quality control [QC]) (MilliporeSigma). Serum (50 μL) was transferred into the remaining 72 wells of the 96-deep-well plate (USA Scientific). The IS mix (550 μL) and protein precipitation (PPT) solvent (ethyl acetate/isopropanol, 2:8, v/v) were added to each sample (with the exception of the DB) for a final volume of 600 μL per well. The plate was sealed using a silicone cap mat (Analytical Sales and Products). Samples were placed on a shaker at room temperature for 10 minutes followed by a 10-minute centrifugation at 3000 ×g. The supernatant was then transferred onto a 96-well plate (USA Scientific) and sealed with heat-sealing foil (Beckman Coulter), and plates were stored at 4°C preceding liquid chromatography tandem mass spectrometry (LC-MS/MS) analysis.
Lipid standards and other chemical reagents.
Sphingomyelin (d18:1/17:0), dihydro-cer (d18:0/18:1), d7-ceramide (d18:1-d7/16:0), d7-ceramide (d18:1-d7/18:0), d7-ceramide (d18:1-d7/24:0), d7-ceramide (d18:1-d7/24:1), glucosylceramide (d18:1/17:0), and d7-PC (15:0–18:1-d7) were obtained from Avanti Polar Lipids. An Acquity CSH C18, 1.7-μm VanGuard Pre-Column and an Acquity CSH C18, 2.1 × 50 mm 1.7-μm column were obtained from Waters Corporation. 2-propanol, acetonitrile, and formic acid (all LC-MS grade) were obtained from Honeywell, Burdick & Jackson. HPLC-grade ethyl acetate was obtained from MilliporeSigma. Ammonium acetate was acquired from MPBio
LC-MS/MS analysis.
Lipid extracts were separated on an Acquity CSH C18 1.7 μm 2.1 × 50 mm column with a 1.7 μM VanGuard Pre-Column (Waters Corporation) maintained at 60°C and connected to an Agilent HiP 1290 Sampler and an Agilent 1290 Infinity Pump, equipped with an Agilent 1290 Flex Cube and an Agilent 6490 triple quadrupole (QqQ) mass spectrometer. Sphingolipids were detected using dynamic multiple reaction monitoring (dMRM) in positive ion mode. The source gas temperature was set to 210°C, with a gas (N2) flow of 11 L/min and a nebulizer pressure of 30 psi. The sheath gas temperature was 400°C, the sheath gas (N2) flow was 12 L/min, the capillary voltage was 4000 V, and the nozzle voltage was 500 V. The injection volume was 3 μL, and the samples were analyzed in a randomized order, with the pooled QC sample injected 8 times throughout the sample queue. With 8 controls per plate, there were 80 QC injections in totality. Mobile phase A consisted of ACN/H2O (60:40 v/v), and mobile phase B consisted of IPA/ACN/H2O (90:9:1 v/v), both of which contained 10 mM ammonium formate and 0.1% formic acid. The chromatography gradient started at 15% mobile phase B, increased to 30% B over 1 minute, increased to 70% B from 1.0–1.1 minutes, was held at 70% B until 4.5 minutes, and increased to 99% B from 4.5–4.51 minutes, at which point it was held until 5 minutes, and then returned to the starting conditions at 5.1 minutes. Post-time was 1.5 minutes, and the flow rate was 0.5 mL/min throughout. Collision energies and cell accelerator voltages were optimized using sphingolipid standards with dMRM transitions as [M+H]+→[m/z = 266.3 or 284.4] for dihydroceramides; [M-H2O+H]+→[m/z = 264.2] for ceramides; and [M-H2O+H]+→[m/z = 271.3] for isotope-labeled ceramides. Sphingomyelins were monitored with dMRM transitions as [M+H]+→[m/z = 184.4]. Sphingolipids without available standards were identified on the basis of high-resolution LC-MS, quasi-molecular ions, and characteristic product ions. Results from the LC-MS experiments were collected using an Agilent Mass Hunter Workstation and analyzed with Agilent Mass Hunter Quant B.07.00 software. Sphingolipids were quantitated on the basis of peak area ratios to the internal standards.
Lipid species.
A total of 38 lipids were quantified including dihydroceramides (dihydrocer(d18:0)); ceramides (cer(d18:1)); glucosylceramides (glucosyl-cer(d18:1)); dihydrosphingomyelins (dihydro-SM(d18:0)); sphingomyelins (SM(d18:1)); sphinganine; sphingosine; phosphatidylcholines (PC). For sphingolipid species, except for sphinganine and sphingosine, acyl chain lengths of 16, 18, 20, 22, and 24 and a carbon length of 24:1 were reported. For phosphatidylcholines, 6 species at the sum composition level were reported (34:2, 36:0, 36:1, 36:2, 36:3, and 36:4). The average coefficient of variation (CV) ± standard deviation for all sphingolipid species reported is 37.3 ± 13.1. Calculated for only ceramide and dihydroceramide species, the average percent CV is 29.8 ±7.9. Both of the CVs are in line with previous reports of sphingolipid data (38). Lipid data was batch corrected using the Locally Weighted Scatter-plot Smoother (LOESS) algorithm (39)
Quantification and statistical analysis
Participant characteristics were summarized as the mean ± standard deviation for continuous variables or n (percentage) for categorical variables. Lipid species were summarized as mean and interquartile range using the original scale and were log10 transformed for analysis, owing to non-normal distributions.
For all analyses, we ran sequential models, including unadjusted, minimally adjusted (study group, age, sex, baseline BMI), and multivariable adjusted (study group, age, sex, baseline BMI, race, ethnicity, marital status, income, education level, smoking status, blood pressure, triglycerides, HDL-C, VLDL-C, LDL-C, anti-hypertensive medication, lipid-lowering medication). First, we conducted multilevel modeling to measure the changes in ceramide concentration over time (baseline to 2-years, and 2-years to 12-years) within and study groups. We modeled the relationship between sphingolipid concentrations and group over time, and provided precise beta estimates and 95% CIs of these associations (40). A multilevel model accounts for the nested nature of the data in regards to both study group and non-linear timepoints. We specified the model with random intercepts for groups and employed fixed effects for time. Next, we also implemented a multilevel model to determine the relationship between ceramide concentrations and diabetes markers (glycated hemoglobin (HbA1c), and homeostatic model assessment of insulin resistance (HOMA-IR). This analysis included an adjustment for group, as it pooled all three study groups together, and included BMI at each time point as a covariate, thereby accounting for fluctuations in weight over time. Finally, we evaluated diabetes remission in the RYGB group. This analysis included surgery group participants with prevalent diabetes at baseline and ceramide data at baseline and 2-years (n = 67). We visualized the proportion of each study group with prevalent diabetes at baseline and the proportion of these patients that experienced remissifon at 2-years’ follow-up. We performed a multivariable adjusted logistic regression for the association of ceramides with 2-year diabetes remission, then visualized the fold-change of lipid concentrations from baseline to 2-years for (1) diabetes remission (n = 49) versus no remission (n =18); (2) sustained diabetes remission at study termination (12-years) (n = 40) versus transient diabetes remission (remission at 2-years but re-diagnosis before study termination, n = 9), and persistent diabetes (no diabetes remission over study duration, n = 18). For all diabetes remission analyses, the following covariates were added to the multivariable adjusted model: baseline use of diabetes medications, duration of diabetes, and baseline HbA1c.
All analyses were performed in R 3.5.1(41). Figures were generated in R 3.5.1, GraphPad Prism, or BioRender. Associations were considered statistically significant at a false discovery rate (FDR) below 0.05 to account for multiple statistical tests(42).
Supplementary Material
Key Resources Table.
| Reagent or Resource | Source | Identifier |
|---|---|---|
| Biological samples | ||
| Human serum | Study participants (Rocky Mountain Bariatric Clinic, University of Utah) | N/A |
| Chemicals, peptides, and recombinant proteins | ||
| Sphingomyelin (d18:1/17:0) | Avanti | Cat #860585 |
| dihydro-cer (d18:0/18:1) | Avanti | Cat #860624 |
| d7-ceramide (d18:1-d7/16:0) | Avanti | Cat #860676 |
| d7-ceramide (d18:1-d7/18:0) | Avanti | Cat #860677 |
| d7-ceramide (d18:1-d7/24:0) | Avanti | Cat #860678 |
| d7-ceramide (d18:1-d7/24:1) | Avanti | Cat #860679 |
| glucosylceramide (d18:1/17:0) | Avanti | Cat #860569 |
| d7-PC (15:0–18:1-d7) | Avanti | Cat #791637 |
| Deposited data | ||
| Deidentified raw data file | This paper | https://doi.org/10.7910/DVN/6UX5UK |
| Software and algorithms | ||
| R Project for Statistical Computing | https://www.r-project.org/ | N/A |
| Original Code | This paper | https://doi.org/10.7910/DVN/6UX5UK |
| Graphpad Prism 7.0 | www.graphpad.com | sales@graphpad.com |
| BioRender | www.biorender.com | N/A |
| Other | ||
| Lipid extraction | Havulinna et al., 2019. | DOI: 10.1161/ATVBAHA.116.307497 |
| LC-MS/MS analysis | Poss et al., 2020. | DOI: 10.1172/JCI131838 |
Highlights.
Serum ceramides decrease 2 and 12-years following Roux-en-Y gastric bypass surgery
Ceramides positively associate with HbA1c and HOMA-IR
Baseline ceramides inversely predict diabetes remission 2-years after surgery
Context and Significance.
Roux-en-Y gastric bypass surgery induces rapid and sustained weight loss and improved metabolic health, including the unique phenomenon of type 2 diabetes remission. However, the precise mechanisms linking Roux-en-Y gastric bypass to improved metabolic parameters is poorly understood. Ceramides are a deleterious lipid subtype that accumulate in states of metabolic distress. We found that they decrease dramatically following Roux-en-Y gastric bypass. This decrease in ceramides is sustained for up to 12-years after the procedure. Moreover, ceramides measured at the time of surgery inversely predict whether patients will achieve diabetes remission. These data suggest that ceramides could be an important clinical tool for gauging metabolic responses to surgery in this patient population.
Acknowledgements
We wish to acknowledge the support from the Metabolomics Core at the Health Sciences Center of the University of Utah. All data are available in the main text or the supplementary materials.
Funding:
Mass spectrometry equipment for the Metabolomics core was obtained through NCRR shared instrumentation grants 1S10OD016232-01, 1S10OD018210-01A1 and 1S10OD021505-01. The authors received research support from the National Institutes of Health (DK115824, DK116888, and DK116450 to SAS), the Juvenile Diabetes Research Foundation (JDRF 3-SRA-2019-768-A-B to SAS and JDRF 3-SRA-2019-768-A-B to WLH), the American Diabetes Association (to SAS), the American Heart Association (to SAS), and the Margolis Foundation (to SAS). A.M.P. received support from the National Institutes of Health through the Institutional National Research Service Award T325T32Dk091317-07 and the Ruth L. Kirschstein National Research Service Award F31DK127603-01A, both from the National Institute of Diabetes and Digestive and Kidney Diseases. The content of this manuscript is solely the responsibility of the authors and does not necessarily represent the official views of the National Institutes of Health (NIH).
Footnotes
Declaration of Interests
SAS is a cofounder of, consultant to, and shareholder in Centaurus Therapeutics. AMP, BK, JAM, BH, JEC, YL, TST, PK, AI, SCH, TDA, MCP, WLH have no conflicts of interest to declare.
Publisher's Disclaimer: This is a PDF file of an unedited manuscript that has been accepted for publication. As a service to our customers we are providing this early version of the manuscript. The manuscript will undergo copyediting, typesetting, and review of the resulting proof before it is published in its final form. Please note that during the production process errors may be discovered which could affect the content, and all legal disclaimers that apply to the journal pertain.
REFERENCES
- 1.Worldwide trends in body-mass index, underweight, overweight, and obesity from 1975 to 2016: a pooled analysis of 2416 population-based measurement studies in 128·9 million children, adolescents, and adults. Lancet. 2017;390(10113):2627–42. Epub 2017/10/17. doi: 10.1016/s0140-6736(17)32129-3. [DOI] [PMC free article] [PubMed] [Google Scholar]
- 2.Trends in adult body-mass index in 200 countries from 1975 to 2014: a pooled analysis of 1698 population-based measurement studies with 19·2 million participants. Lancet. 2016;387(10026):1377–96. Epub 2016/04/27. doi: 10.1016/s0140-6736(16)30054-x. [DOI] [PMC free article] [PubMed] [Google Scholar]
- 3.Blüher M Obesity: global epidemiology and pathogenesis. Nature reviews Endocrinology. 2019;15(5):288–98. Epub 2019/03/01. doi: 10.1038/s41574-019-0176-8. [DOI] [PubMed] [Google Scholar]
- 4.Fontaine KR, Redden DT, Wang C, Westfall AO, Allison DB. Years of life lost due to obesity. Jama. 2003;289(2):187–93. Epub 2003/01/09. doi: 10.1001/jama.289.2.187. [DOI] [PubMed] [Google Scholar]
- 5.Schaffer JE. Lipotoxicity: when tissues overeat. Curr Opin Lipidol. 2003;14(3):281–7. Epub 2003/07/04. doi: 10.1097/00041433-200306000-00008. [DOI] [PubMed] [Google Scholar]
- 6.Unger RH, Clark GO, Scherer PE, Orci L. Lipid homeostasis, lipotoxicity and the metabolic syndrome. Biochim Biophys Acta. 2010;1801(3):209–14. Epub 2009/12/02. doi: 10.1016/j.bbalip.2009.10.006. [DOI] [PubMed] [Google Scholar]
- 7.Chaurasia B, Summers SA. Ceramides - Lipotoxic Inducers of Metabolic Disorders. Trends in endocrinology and metabolism: TEM. 2015;26(10):538–50. Epub 2015/09/29. doi: 10.1016/j.tem.2015.07.006. [DOI] [PubMed] [Google Scholar]
- 8.Meikle PJ, Summers SA. Sphingolipids and phospholipids in insulin resistance and related metabolic disorders. Nat Rev Endocrinol. 2017;13(2):79–91. Epub 2016/11/04. doi: 10.1038/nrendo.2016.169. [DOI] [PubMed] [Google Scholar]
- 9.Gloy VL, Briel M, Bhatt DL, Kashyap SR, Schauer PR, Mingrone G, Bucher HC, Nordmann AJ. Bariatric surgery versus non-surgical treatment for obesity: a systematic review and meta-analysis of randomised controlled trials. Bmj. 2013;347:f5934. Epub 2013/10/24. doi: 10.1136/bmj.f5934. www.icmje.org/coi_disclosure.pdf (available on request from the corresponding author) and declare: VLG, AJN, MB, and HCB are supported by an unrestricted grant from Santéuisse and the Gottfried and Julia Bangerter-Rhyner-Foundation. DLB is on the advisory boards of Elsevier PracticeUpdate Cardiology, Medscape Cardiology, and Regado Biosciences; is on the boards of directors of Boston VA Research Institute and Society of Cardiovascular Patient Care; is chair of American Heart Association Get With The Guidelines Steering Committee; has received honoraria from American College of Cardiology (editor, Clinical Trials, Cardiosource), Belvoir Publications (editor in chief, Harvard Heart Letter), Duke Clinical Research Institute (clinical trial steering committees), Population Health Research Institute (clinical trial steering committee), Slack Publications (chief medical editor, Cardiology Today’s Intervention), WebMD (CME steering committees); is senior associate editor, Journal of Invasive Cardiology; is on data monitoring committees of Duke Clinical Research Institute, Mayo Clinic, and Population Health Research Institute; has received research grants from Amarin, AstraZeneca, Bristol-Myers Squibb, Eisai, Ethicon, Medtronic, Sanofi Aventis, the Medicines Company; and has undertaken unfunded research for FlowCo, PLx Pharma, Takeda. PRS has received payment for board membership from Ethicon Endo-Surgery, Surgiquest, Barosense, RemedyMD, and Stryker; consulting fees from Ethicon Endo-Surgery, Stryker, Gore, and Carefusion; payment for expert testimony from Physicians Review of Surgery; lecture fees from Ethi con Endo-Surgery, Allergan, Cinemed, and Quadrant Healthcom; holds a patent for a medical device to enhance weight loss in codevelopment with the Cleveland Clinic; receives royalties from Springer; has an equity interest in Intuitive Surgical, Barosense, Surgiquest, and RemedyMD; and receives institutional grant support (to the Cleveland Clinic) from Ethicon Endo-Surgery and Bard Davol. [DOI] [PMC free article] [PubMed] [Google Scholar]
- 10.Adams TD, Davidson LE, Litwin SE, Kim J, Kolotkin RL, Nanjee MN, Gutierrez JM, Frogley SJ, Ibele AR, Brinton EA, Hopkins PN, McKinlay R, Simper SC, Hunt SC. Weight and Metabolic Outcomes 12 Years after Gastric Bypass. The New England journal of medicine. 2017;377(12):1143–55. Epub 2017/09/21. doi: 10.1056/NEJMoa1700459. [DOI] [PMC free article] [PubMed] [Google Scholar]
- 11.Nalepa P, Piechnik A, Kiersztan A. [Influence of bariatric surgery on remission of type 2 diabetes]. Postepy Hig Med Dosw (Online). 2011;65:804–18. Epub 2011/12/17. doi: 10.5604/17322693.968212. [DOI] [PubMed] [Google Scholar]
- 12.Mitchell BG, Gupta N. Roux-en-Y Gastric Bypass. StatPearls. Treasure Island (FL): StatPearls Publishing Copyright © 2021, StatPearls Publishing LLC.; 2021. [Google Scholar]
- 13.Nurczyk K, Herbella FA, Patti MG. Roux-en-Y Gastric Bypass for Obesity. How We Do It. J Laparoendosc Adv Surg Tech A. 2020;30(6):623–6. Epub 2020/04/21. doi: 10.1089/lap.2020.0156. [DOI] [PubMed] [Google Scholar]
- 14.Adams TD, Davidson LE, Litwin SE, Kolotkin RL, LaMonte MJ, Pendleton RC, Strong MB, Vinik R, Wanner NA, Hopkins PN, Gress RE, Walker JM, Cloward TV, Nuttall RT, Hammoud A, Greenwood JL, Crosby RD, McKinlay R, Simper SC, Smith SC, Hunt SC. Health benefits of gastric bypass surgery after 6 years. JAMA. 2012;308(11):1122–31. Epub 2012/09/20. doi: 10.1001/2012.jama.11164. [DOI] [PMC free article] [PubMed] [Google Scholar]
- 15.Merrill AH Jr. De novo sphingolipid biosynthesis: a necessary, but dangerous, pathway. J Biol Chem. 2002;277(29):25843–6. doi: 10.1074/jbc.R200009200. [DOI] [PubMed] [Google Scholar]
- 16.Cingolani F, Futerman AH, Casas J. Ceramide synthases in biomedical research. Chem Phys Lipids. 2016;197:25–32. Epub 2015/08/08. doi: 10.1016/j.chemphyslip.2015.07.026. [DOI] [PubMed] [Google Scholar]
- 17.Chaurasia B, Tippetts TS, Monibas RM, Liu J, Li Y, Wang L, Wilkerson JL, Sweeney CR, Pereira RF, Sumida DH, Maschek JA, Cox JE, Kaddai V, Lancaster GI, Siddique MM, Poss A, Pearson M, Satapati S, Zhou H, McLaren DG, Previs SF, Chen Y, Qian Y, Petrov A, Wu M, Shen X, Yao J, Nunes CN, Howard AD, Wang L, Erion MD, Rutter J, Holland WL, Kelley DE, Summers SA. Targeting a ceramide double bond improves insulin resistance and hepatic steatosis. Science. 2019:eaav3722. doi: 10.1126/science.aav3722. [DOI] [PMC free article] [PubMed] [Google Scholar]
- 18.Holland WL, Brozinick JT, Wang LP, Hawkins ED, Sargent KM, Liu Y, Narra K, Hoehn KL, Knotts TA, Siesky A, Nelson DH, Karathanasis SK, Fontenot GK, Birnbaum MJ, Summers SA. Inhibition of ceramide synthesis ameliorates glucocorticoid-, saturated-fat-, and obesity-induced insulin resistance. Cell Metab. 2007;5(3):167–79. doi: 10.1016/j.cmet.2007.01.002. [DOI] [PubMed] [Google Scholar]
- 19.Lemaitre RN, Yu C, Hoofnagle A, Hari N, Jensen PN, Fretts AM, Umans JG, Howard BV, Sitlani CM, Siscovick DS, King IB, Sotoodehnia N, McKnight B. Circulating Sphingolipids, Insulin, HOMA-IR, and HOMA-B: The Strong Heart Family Study. Diabetes. 2018;67(8):1663–72. Epub 2018/03/29. doi: 10.2337/db17-1449. [DOI] [PMC free article] [PubMed] [Google Scholar]
- 20.Fretts AM, Jensen PN, Hoofnagle A, McKnight B, Howard BV, Umans J, Yu C, Sitlani C, Siscovick DS, King IB, Sotoodehnia N, Lemaitre RN. Plasma Ceramide Species Are Associated with Diabetes Risk in Participants of the Strong Heart Study. J Nutr. 2020;150(5):1214–22. Epub 2019/10/31. doi: 10.1093/jn/nxz259. [DOI] [PMC free article] [PubMed] [Google Scholar]
- 21.Fretts AM, Jensen PN, Hoofnagle AN, McKnight B, Howard BV, Umans J, Sitlani CM, Siscovick DS, King IB, Djousse L, Sotoodehnia N, Lemaitre RN. Plasma Ceramides containing Saturated Fatty Acids are Associated with Risk of Type 2 Diabetes. Journal of lipid research. 2021:100119. Epub 2021/09/24. doi: 10.1016/j.jlr.2021.100119. [DOI] [PMC free article] [PubMed] [Google Scholar]
- 22.Poss AM, Maschek JA, Cox JE, Hauner BJ, Hopkins PN, Hunt SC, Holland WL, Summers SA, Playdon MC. Machine Learning Reveals Serum Sphingolipids as Cholesterol-Independent Biomarkers of Coronary Artery Disease. J Clin Invest. 2019. Epub 2019/11/20. doi: 10.1172/jci131838. [DOI] [PMC free article] [PubMed] [Google Scholar]
- 23.Wigger L, Cruciani-Guglielmacci C, Nicolas A, Denom J, Fernandez N, Fumeron F, Marques-Vidal P, Ktorza A, Kramer W, Schulte A, Le Stunff H, Liechti R, Xenarios I, Vollenweider P, Waeber G, Uphues I, Roussel R, Magnan C, Ibberson M, Thorens B. Plasma Dihydroceramides Are Diabetes Susceptibility Biomarker Candidates in Mice and Humans. Cell Rep. 2017;18(9):2269–79. Epub 2017/03/02. doi: 10.1016/j.celrep.2017.02.019. [DOI] [PubMed] [Google Scholar]
- 24.Summers SA. Could Ceramides Become the New Cholesterol? Cell Metab. 2018;27(2):276–80. Epub 2018/01/09. doi: 10.1016/j.cmet.2017.12.003. [DOI] [PubMed] [Google Scholar]
- 25.Özer H, Aslan İ, Oruç MT, Çöpelci Y, Afşar E, Kaya S, Aslan M. Early postoperative changes of sphingomyelins and ceramides after laparoscopic sleeve gastrectomy. Lipids Health Dis. 2018;17(1):269. Epub 2018/11/27. doi: 10.1186/s12944-018-0917-z. [DOI] [PMC free article] [PubMed] [Google Scholar]
- 26.Huang H, Kasumov T, Gatmaitan P, Heneghan HM, Kashyap SR, Schauer PR, Brethauer SA, Kirwan JP. Gastric bypass surgery reduces plasma ceramide subspecies and improves insulin sensitivity in severely obese patients. Obesity (Silver Spring). 2011;19(11):2235–40. Epub 2011/05/07. doi: 10.1038/oby.2011.107. [DOI] [PMC free article] [PubMed] [Google Scholar]
- 27.Heneghan HM, Huang H, Kashyap SR, Gornik HL, McCullough AJ, Schauer PR, Brethauer SA, Kirwan JP, Kasumov T. Reduced cardiovascular risk after bariatric surgery is linked to plasma ceramides, apolipoprotein-B100, and ApoB100/A1 ratio. Surg Obes Relat Dis. 2013;9(1):100–7. Epub 2012/01/24. doi: 10.1016/j.soard.2011.11.018. [DOI] [PMC free article] [PubMed] [Google Scholar]
- 28.Aly S, Hachey K, Pernar LIM. Gender disparities in weight loss surgery. Mini-invasive Surgery. 2020;4:21. doi: 10.20517/2574-1225.2019.57. [DOI] [Google Scholar]
- 29.Turpin SM, Nicholls HT, Willmes DM, Mourier A, Brodesser S, Wunderlich CM, Mauer J, Xu E, Hammerschmidt P, Bronneke HS, Trifunovic A, LoSasso G, Wunderlich FT, Kornfeld JW, Bluher M, Kronke M, Bruning JC. Obesity-induced CerS6-dependent C16:0 ceramide production promotes weight gain and glucose intolerance. Cell Metab. 2014;20(4):678–86. doi: 10.1016/j.cmet.2014.08.002. [DOI] [PubMed] [Google Scholar]
- 30.Turpin-Nolan SM, Hammerschmidt P, Chen W, Jais A, Timper K, Awazawa M, Brodesser S, Bruning JC. CerS1-Derived C18:0 Ceramide in Skeletal Muscle Promotes Obesity-Induced Insulin Resistance. Cell Rep. 2019;26(1):1–10 e7. Epub 2019/01/04. doi: 10.1016/j.celrep.2018.12.031. [DOI] [PubMed] [Google Scholar]
- 31.Maciejewski ML, Arterburn DE, Van Scoyoc L, Smith VA, Yancy WS Jr., Weidenbacher HJ, Livingston EH, Olsen MK. Bariatric Surgery and Long-term Durability of Weight Loss. JAMA Surg. 2016;151(11):1046–55. Epub 2016/09/01. doi: 10.1001/jamasurg.2016.2317. [DOI] [PMC free article] [PubMed] [Google Scholar]
- 32.Summers SA, Garza LA, Zhou H, Birnbaum MJ. Regulation of insulin-stimulated glucose transporter GLUT4 translocation and Akt kinase activity by ceramide. Mol Cell Biol. 1998;18(9):5457–64. [DOI] [PMC free article] [PubMed] [Google Scholar]
- 33.Panunzi S, Carlsson L, De Gaetano A, Peltonen M, Rice T, Sjöström L, Mingrone G, Dixon JB. Determinants of Diabetes Remission and Glycemic Control After Bariatric Surgery. Diabetes Care. 2016;39(1):166–74. Epub 2015/12/03. doi: 10.2337/dc15-0575. [DOI] [PubMed] [Google Scholar]
- 34.Hammerschmidt P, Ostkotte D, Nolte H, Gerl MJ, Jais A, Brunner HL, Sprenger HG, Awazawa M, Nicholls HT, Turpin-Nolan SM, Langer T, Kruger M, Brugger B, Bruning JC. CerS6-Derived Sphingolipids Interact with Mff and Promote Mitochondrial Fragmentation in Obesity. Cell. 2019;177(6):1536–52 e23. Epub 2019/06/01. doi: 10.1016/j.cell.2019.05.008. [DOI] [PubMed] [Google Scholar]
- 35.Adams TD, Avelar E, Cloward T, Crosby RD, Farney RJ, Gress R, Halverson RC, Hopkins PN, Kolotkin RL, Lamonte MJ, Litwin S, Nuttall RT, Pendleton R, Rosamond W, Simper SC, Smith SC, Strong M, Walker JM, Wiebke G, Yanowitz FG, Hunt SC. Design and rationale of the Utah obesity study. A study to assess morbidity following gastric bypass surgery. Contemporary clinical trials. 2005;26(5):534–51. Epub 2005/07/28. doi: 10.1016/j.cct.2005.05.003. [DOI] [PubMed] [Google Scholar]
- 36.Adams TD, Pendleton RC, Strong MB, Kolotkin RL, Walker JM, Litwin SE, Berjaoui WK, LaMonte MJ, Cloward TV, Avelar E, Owan TE, Nuttall RT, Gress RE, Crosby RD, Hopkins PN, Brinton EA, Rosamond WD, Wiebke GA, Yanowitz FG, Farney RJ, Halverson RC, Simper SC, Smith SC, Hunt SC. Health outcomes of gastric bypass patients compared to nonsurgical, nonintervened severely obese. Obesity (Silver Spring). 2010;18(1):121–30. Epub 2009/06/06. doi: 10.1038/oby.2009.178. [DOI] [PMC free article] [PubMed] [Google Scholar]
- 37.Havulinna AS, Sysi-Aho M, Hilvo M, Kauhanen D, Hurme R, Ekroos K, Salomaa V, Laaksonen R. Circulating Ceramides Predict Cardiovascular Outcomes in the Population-Based FINRISK 2002 Cohort. Arteriosclerosis, thrombosis, and vascular biology. 2016;36(12):2424–30. Epub 2016/10/22. doi: 10.1161/atvbaha.116.307497. [DOI] [PubMed] [Google Scholar]
- 38.Sullards MC, Liu Y, Chen Y, Merrill AH Jr. Analysis of mammalian sphingolipids by liquid chromatography tandem mass spectrometry (LC-MS/MS) and tissue imaging mass spectrometry (TIMS). Biochim Biophys Acta. 2011;1811(11):838–53. Epub 2011/07/14. doi: 10.1016/j.bbalip.2011.06.027. [DOI] [PMC free article] [PubMed] [Google Scholar]
- 39.Rusilowicz M, Dickinson M, Charlton A, O’Keefe S, Wilson J. A batch correction method for liquid chromatography-mass spectrometry data that does not depend on quality control samples. Metabolomics. 2016;12(3):56. Epub 2016/04/14. doi: 10.1007/s11306-016-0972-2. [DOI] [PMC free article] [PubMed] [Google Scholar]
- 40.Bates D, Mächler M, Bolker B, Walker S. Fitting Linear Mixed-Effects Models Using lme4. Journal of Statistical Software. 2015;67(1):1–48. doi: 10.18637/jss.v067.i01. [DOI] [Google Scholar]
- 41.R Development Core Team. R: A language and environemnt for statistical computing R version 3.5.1—“Feather Spray” ed: R Foundation for Statistical Computing; 2018. [Google Scholar]
- 42.Benjamini Y, Hochberg Y. Controlling the false discovery rate: a practical and powerful approach to multiple testing. Journal of the Royal statistical society: series B (Methodological). 1995;57(1):289–300. [Google Scholar]
Associated Data
This section collects any data citations, data availability statements, or supplementary materials included in this article.
Supplementary Materials
Data Availability Statement
All original code has been deposited at Dataverse and is publicly available (https://doi.org/10.7910/DVN/6UX5UK). Any additional information that may be required to reanalyze the data reported in the paper is available from the lead contact upon request.