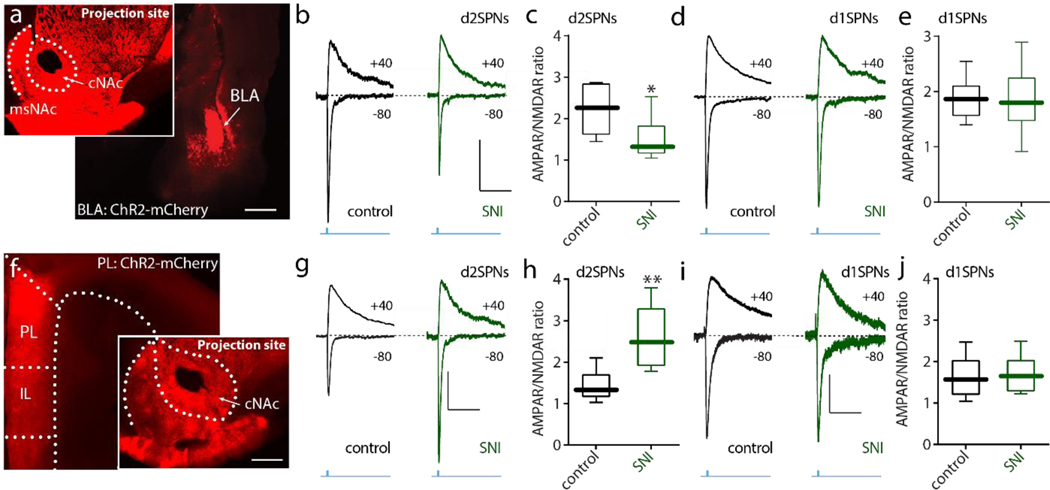
Figure 1. The strength of BLA synapses on cNAc d2SPNs was reduced whereas the strength of PL synapses on cNAc d2SPNs was increased in SNI animals.
a, Sample slices displaying the expression of ChR2-mCherry (red) in BLA (larger image) and cNAc (smaller image) after virus injection in the BLA. Scale bars represent 0.5 mm. b-e, Optical stimulation-evoked d2SPN AMPA/NMDA receptor responses (A/N ratio) were inhibited in SNI (n = 7–8 neurons from 5 mice per group; U = 9, p = 0.0289), but no change was detected in d1SPNs (j, n = 6 neurons from 5 mice per group with U = 17, p = 0.8983). b and d AMPA and NMDA receptor-mediated currents elicited in the cNAc SPNs with optical stimulation of BLA inputs (calibration: 50 pA, 100 ms). f, Sample images displaying the expression of ChR2-mCherry (red) in prelimbic (PL)-PFC and cNAc after virus injection in BLA (scale bar: 0.5 mm). g-j, Optically evoked d2SPNs AMPA/NMDA receptor responses were enhanced in SNI, but no change was detected in d1SPNs (n = 6 neurons from 5 mice per group, Mann–Whitney U test with U = 2, p = 0.0087 for c and U = 16, p = 0.8182 for e). g and i showed the representative AMPA and NMDA receptor-mediated currents elicited in the cNAc SPNs with optical stimulation of PL inputs (calibration: 50 pA, 100 ms). Data are presented as whisker box plots displaying median, lower and upper quartiles, and whiskers representing minimum and maximum of the data.

