Abstract
Although germline mutation rates and spectra can vary within and between species, common genetic modifiers of the mutation rate have not been identified in nature1. Here we searched for loci that influence germline mutagenesis using a uniquely powerful resource: a panel of recombinant inbred mouse lines known as the BXD, descended from the laboratory strains C57BL/6J (B haplotype) and DBA/2J (D haplotype). Each BXD lineage has been maintained by brother–sister mating in the near absence of natural selection, accumulating de novo mutations for up to 50 years on a known genetic background that is a unique linear mosaic of B and D haplotypes2. We show that mice inheriting D haplotypes at a quantitative trait locus on chromosome 4 accumulate C>A germline mutations at a 50% higher rate than those inheriting B haplotypes, primarily owing to the activity of a C>A-dominated mutational signature known as SBS18. The B and D quantitative trait locus haplotypes encode different alleles of Mutyh, a DNA repair gene that underlies the heritable cancer predisposition syndrome that causes colorectal tumors with a high SBS18 mutation load3,4. Both B and D Mutyh alleles are present in wild populations of Mus musculus domesticus, providing evidence that common genetic variation modulates germline mutagenesis in a model mammalian species.
Although all living organisms maintain low mutation rates through conserved DNA repair and proofreading pathways, the fidelity of genetic inheritance varies by orders of magnitude across the tree of life1. Evolutionary biologists have long debated why mutation rates vary so markedly, citing trade-offs including the necessity of beneficial mutations for adaptation5, the cost of DNA replication fidelity6, and the inefficiency of selection against weak mutation-rate modifiers1.
In humans, germline mutation rates vary among families7–9 and are particularly elevated in individuals affected by at least one rare heritable cancer predisposition syndrome10. Human populations also exhibit variation in the mutation spectrum11,12, a summary of the relative abundances of specific base substitution types (C>A, C>T, A>G and so on). Genetic mutation-rate modifiers (also called ‘mutator alleles’) have been invoked as possible contributors to these patterns; however, the relative importance of genetic and environmental mutators remains poorly understood9,13.
Previous attempts to study the genetic architecture of germline mutation rates have been hindered in part by the dependence of mutation rates on parental age7,14,15. Here we avoid this and other confounders by analysing a large family of recombinant inbred mouse lines (RILs), whose environments and generation times have been controlled by breeders for decades. Beginning in 1971, crosses of two inbred laboratory mouse lines—C57BL/6J and DBA/2J—were used to generate several cohorts of BXD recombinant inbred progeny2. These progeny have accumulated de novo mutations during many generations of sibling inbreeding, much like the members of mutation accumulation (MA) lines commonly used to measure mutation rates in microorganisms and invertebrates16.
Accumulation of germline mutations
The BXD family was generated during six breeding epochs initiated between 1971 and 20142 (Extended Data Fig. 1); each epoch contains between 7 and 49 RILs. We sequenced the genome of a whole spleen from each BXD RIL, excluded lines confounded by significant heterozygosity (including all of epoch 6), and retained 94 lines that had each been inbred for at least 20 generations (Extended Data Fig. 2, Extended Data Table 1, Supplementary Information). We identified 63,914 single nucleotide variants (SNVs) that were homozygous for a non-reference allele in one RIL and homozygous for the reference allele in the C57BL/6J and DBA/2J parents, as well as all other BXDs. Each such autosomal ‘singleton’ probably arose as a de novo germline mutation during inbreeding of the RIL in which it appears. Across BXD lines, singleton counts are positively correlated with the number of generations of inbreeding (Poisson regression P < 2.2 × 10⁻¹⁶; Fig. 1a). As reported in other inbred mice17, the high density of singletons in conserved genomic regions suggests that the effects of purifying selection have been minimal during BXD inbreeding (Kolmogorov–Smirnov test, P < 2.2 × 10⁻¹⁶) (Extended Data Fig. 3, Supplementary Information).
Fig. 1 |. Accumulation of homozygous singletons over many generations of laboratory inbreeding.
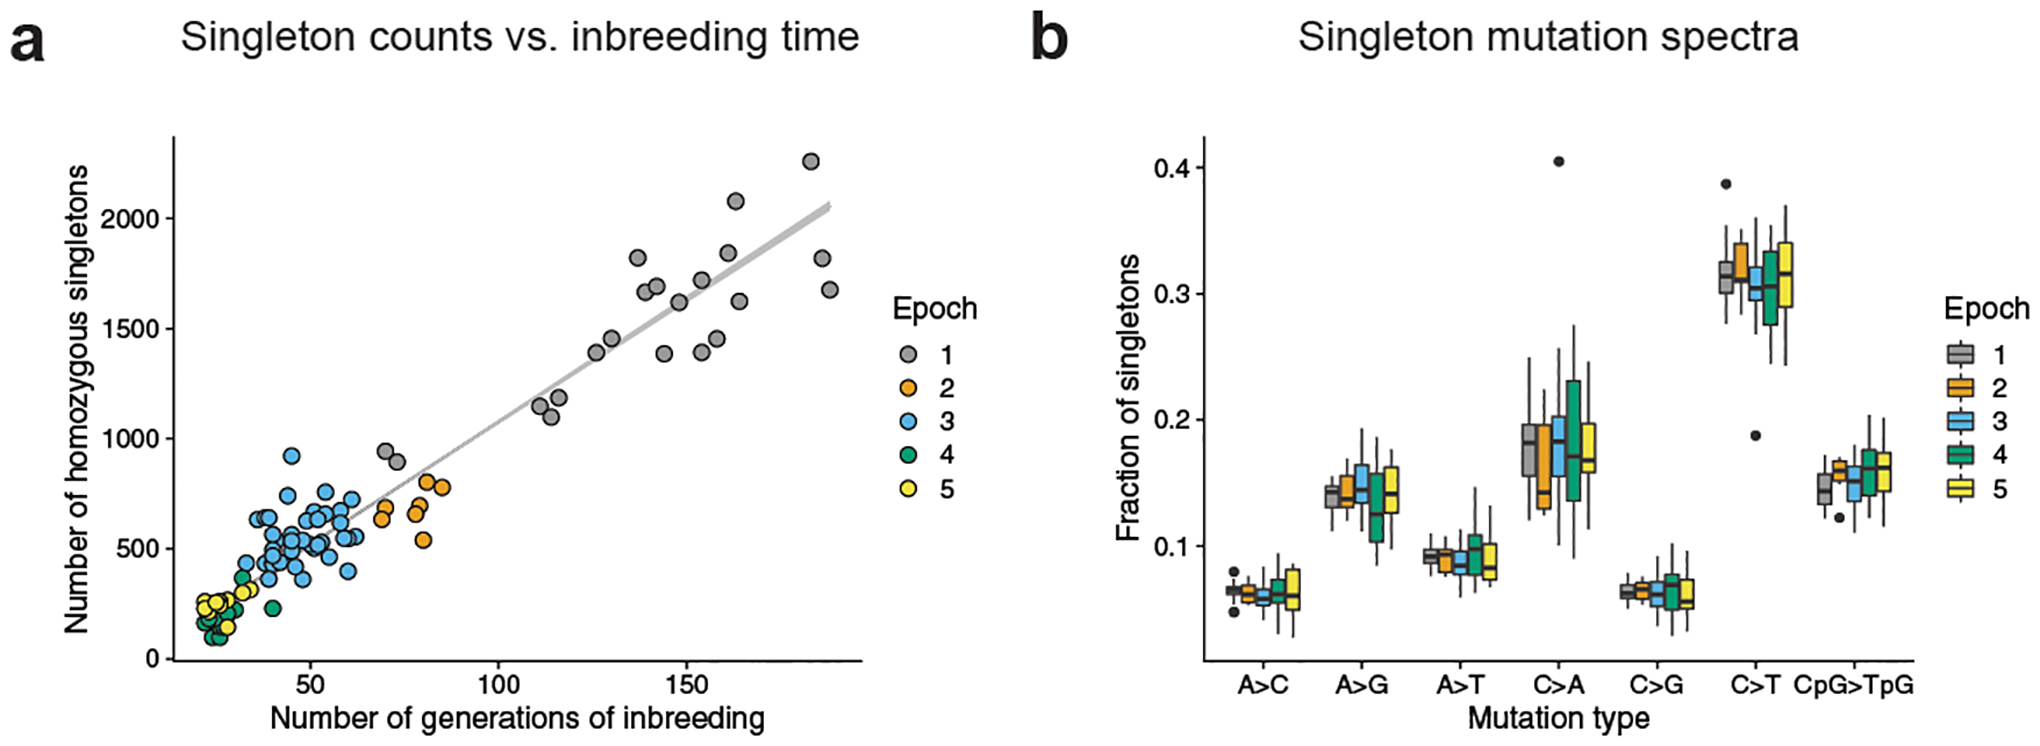
a, Counts of autosomal homozygous singletons (n = 63,914 unique mutations) in 94 BXDs correlate with the number of generations of inbreeding. Lower-numbered epochs are older and have been inbred for more generations. Line is from a Poisson regression (identity link) with 95% confidence bands. b, Fractions of singletons (n = 63,914 unique mutations) from each epoch that belong to each of seven mutation types across BXDs (n = 94 biologically independent mice), including the six possible transitions and transversions as well as CpG>TpG. Strand complements are collapsed (for example, C>T and G>A are considered to be the same mutation type). In box plots, the centre line is the median of each distribution, with bottom and top hinges corresponding to the 25th and 75th percentiles (that is, first and third quartiles), and whiskers extending to no further than 1.5 times the interquartile range from either hinge; data points outside of the range defined by the whiskers are displayed as individual points. The strain with an extremely high fraction of C>A singletons is BXD68.
A QTL for the C>A mutation rate
Mutation spectra inferred from BXD singletons are similar to spectra previously inferred from de novo germline mutations in mice18, but we observed variation within epochs (Fig. 1b, Supplementary Information). We hypothesized that some of this variation might be caused by mutator loci, in which B and D alleles have different functional effects on DNA repair or replication fidelity. To test this hypothesis, we performed quantitative trait locus (QTL) mapping using R/qtl219 for the overall mutation rate in each line, and for the rates and fractions of the seven mutation types shown in Fig. 1b (Supplementary Table 1). We excluded BXD68 from our QTL scans owing to its exceptional C>A singleton rate and fraction (Fig. 1b).
We did not find any genome-wide significant QTL for the overall mutation rate (Extended Data Fig. 4a), but a scan for loci associated with the fraction of C>A singleton mutations revealed a highly significant peak on chromosome 4 (Fig. 2a; maximum logarithm of odds score (LOD) of 17.9 at 116.9 Mbp; Bayes 95% confidence interval = 114.8 –118.3 Mbp). BXD lines with D haplotypes at this locus (hereafter called D lines) (n = 56) have substantially more C>A mutations than lines with B haplotypes (hereafter called B lines) (n = 38) (Fig. 2b; P < 2.2 × 10⁻¹⁶), an effect that explains 59.2% of the variance in BXD C>A singleton fractions. We observed the same LOD peak via a QTL scan for the C>A mutation rate (Fig. 2a; maximum LOD of 6.9 at 116.9 Mbp; Bayes 95% confidence interval = 114.8 –118.8 Mbp). On average, the D lines have accumulated C>A mutations at a rate of 1.22 × 10⁻⁹ per base pair per generation (95% confidence interval: 1.08–1.37 × 10⁻⁹), more than 1.5-fold higher than the rate of 7.32 × 10⁻¹⁰ (95% confidence interval: 6.66–8.11 × 10⁻¹⁰) observed in the B lines. This C>A rate difference gives the D lines a 1.11-fold higher overall mutation rate than the B lines, but is not large enough to produce a globally significant association between the C>A QTL and the overall mutation rate. No other mutagenesis-related QTL scans identified genome-wide significant peaks (Extended Data Fig. 4b). In a principal component analysis, variation in C>A fractions largely drives PC1, which separates the B lines from the D lines (Fig. 2c). Since a higher C>A fraction distinguished the DBA/2J and C57BL/6NJ mutation spectra in a previous report17, the observed QTL on chromosome 4 appears to fit the profile of a mutator locus responsible for a major difference between the parental strains’ mutation spectra.
Fig. 2 |. A QTL on chromosome 4 for the germline C>A mutation rate.
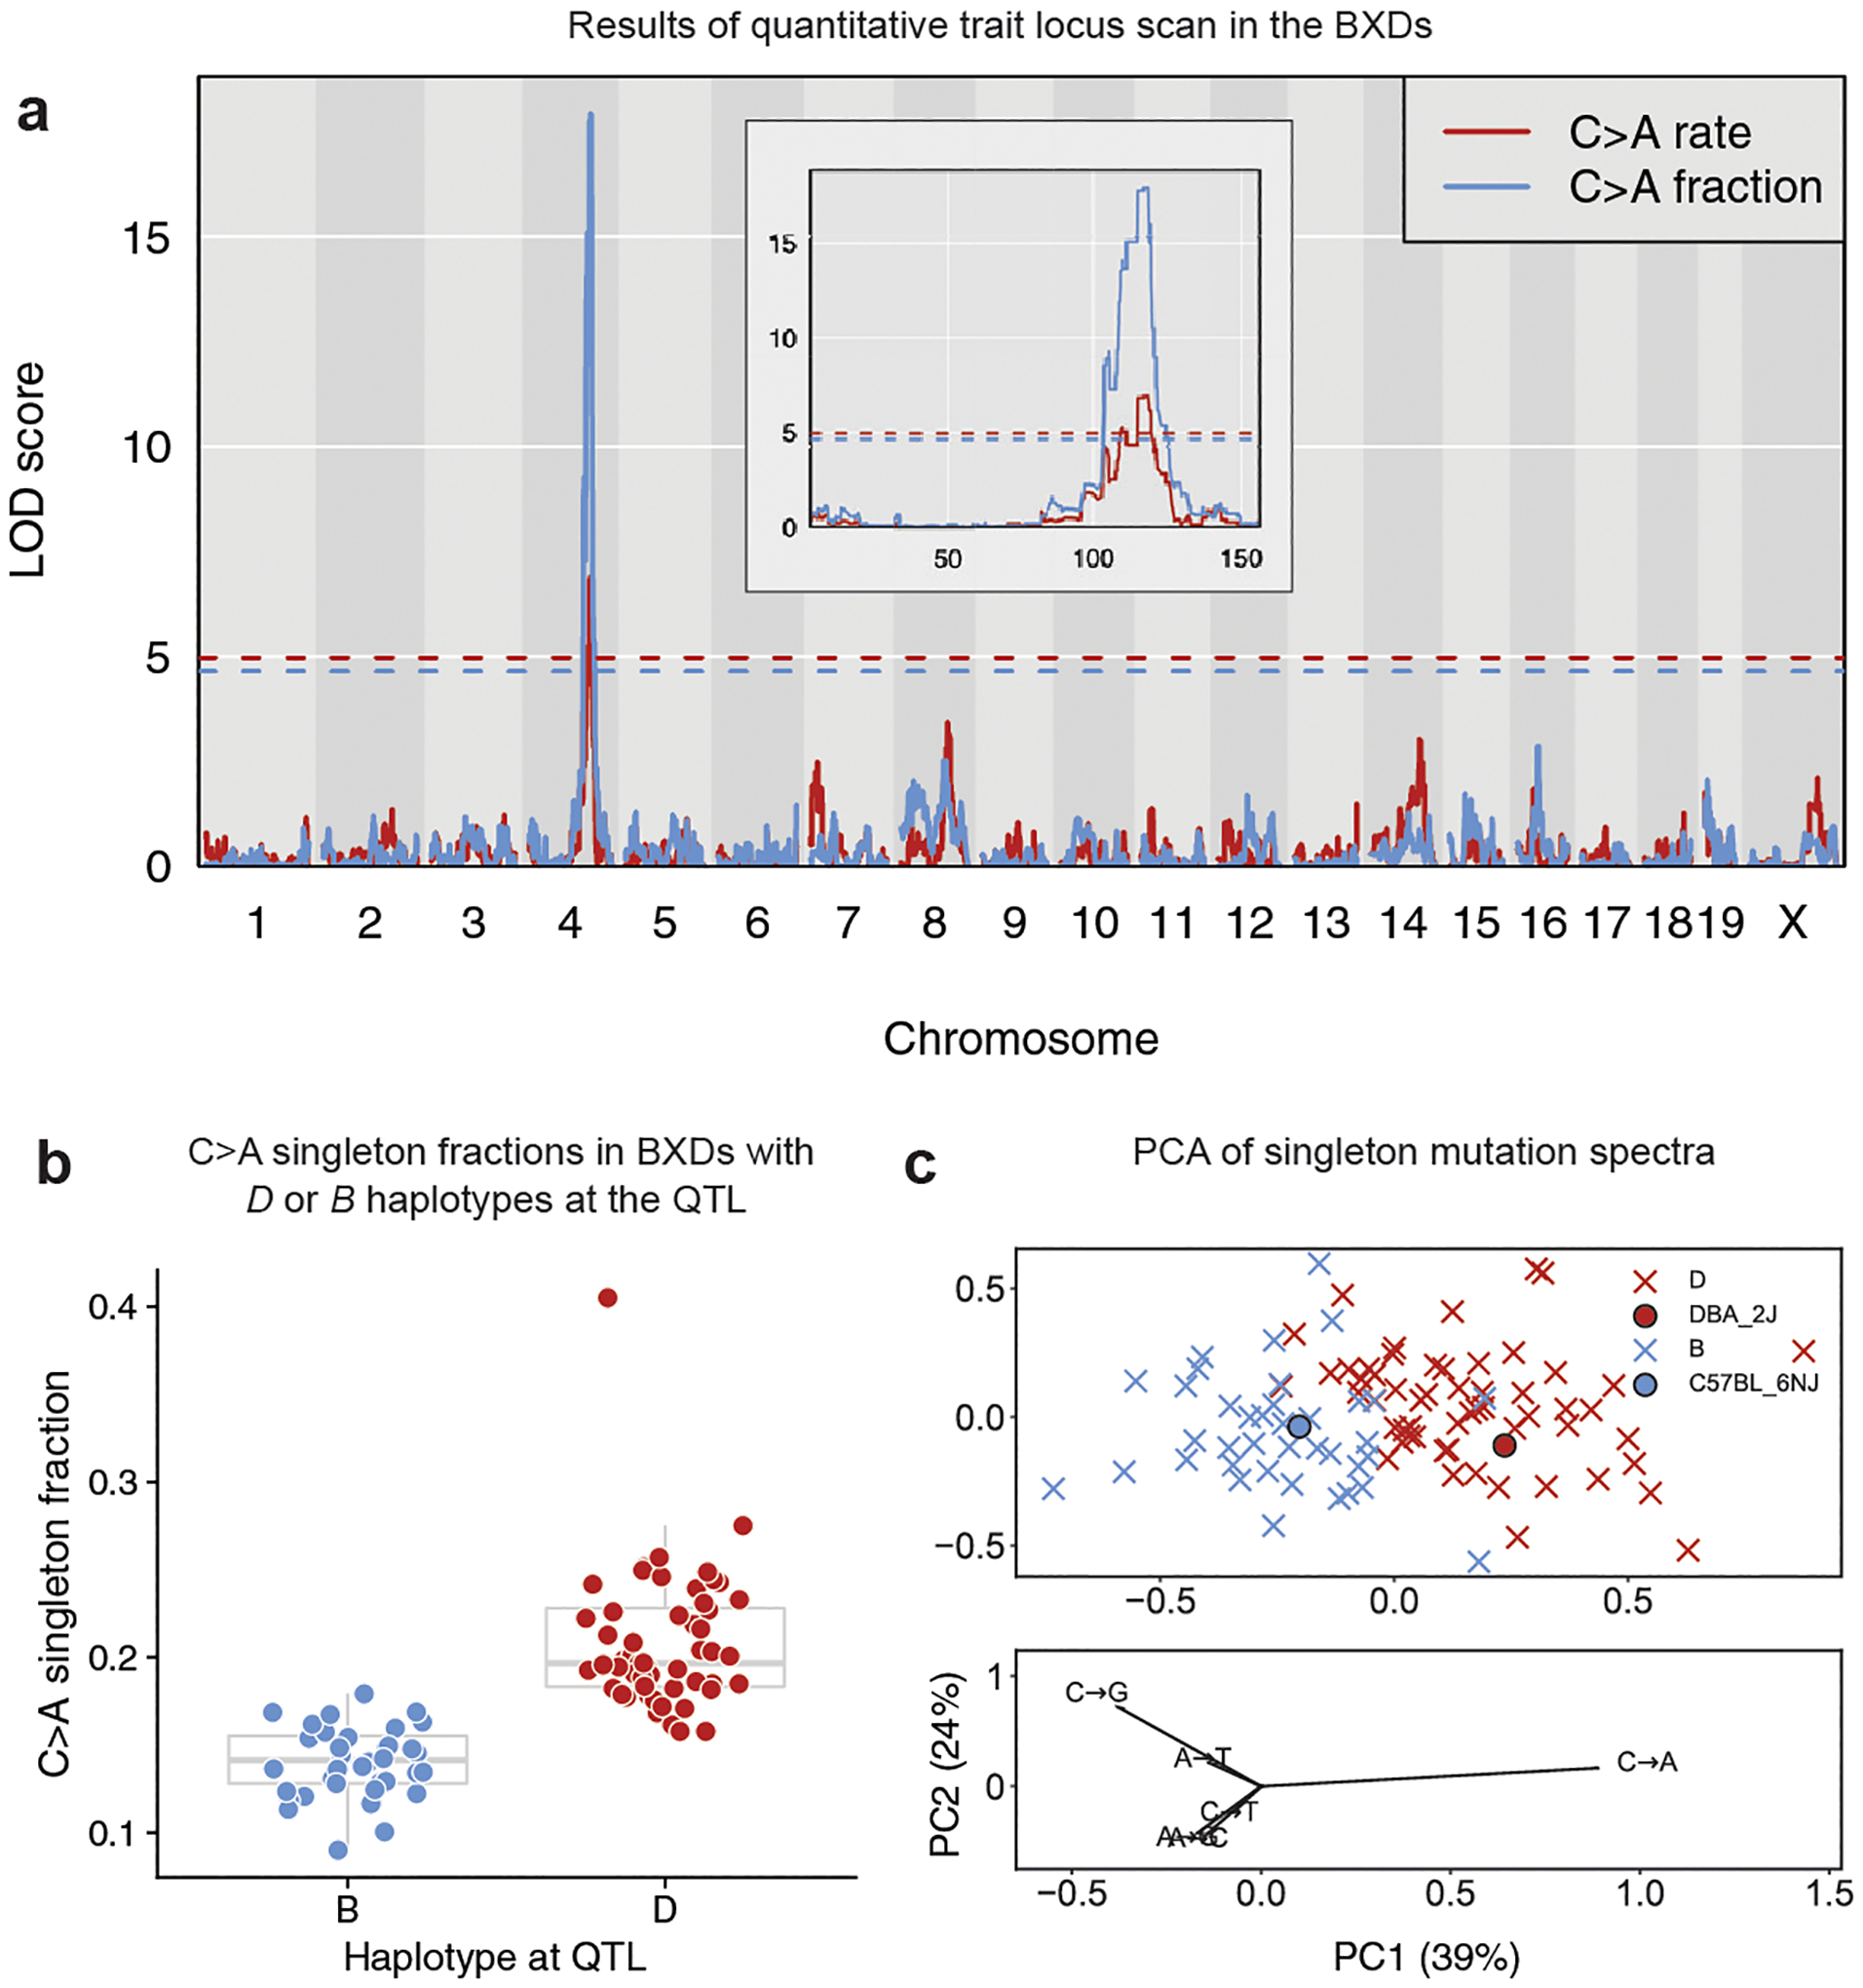
a, LOD scores for the centred log-ratio transformed fraction (blue) and estimated rate (red) of C>A mutations. Blue and red dashed lines indicate genome-wide significance thresholds (using 1,000 permutations and a Bonferroni-corrected α = 0.05/15) for the fraction and rate scans, respectively. C>A fraction and rate phenotypes are included in the GeneNetwork database as BXD_24430 and BXD_24437, respectively. The inset shows a zoomed view showing LOD scores on chromosome 4 only. b, Fraction of C>A singletons in BXD lines homozygous for the D (n = 56 biologically independent mice) or B (n = 38 biologically independent mice) haplotype at the QTL on chromosome 4. In box plots, the centre line is the median of each distribution, with bottom and top hinges corresponding to the 25th and 75th percentiles (that is, first and third quartiles), and whiskers extending to no further than 1.5 times the interquartile range from either hinge. C>A fraction outlier BXD68 was not included in the QTL scan. c, Principal component analysis of the six-dimensional mutation spectra of BXD singletons (n = 63,914 mutations). BXDs are denoted as crosses coloured by parental ancestry at the QTL on chromosome 4 (D (red) or B (blue)). Strain-private mutation spectra for DBA/2J and C57BL/6NJ17 are denoted with circles. Loadings are plotted for each mutation type below. Fractions of each mutation type were centred log ratio transformed prior to principal component analysis.
Candidate causal variants within the QTL
Using SnpEff20, a tool that predicts the effect of genetic variation on protein function, we identified 61 moderate-impact and 5 high-impact sequence differences between B and D haplotypes in the QTL, affecting 21 out of 76 protein-coding genes at the locus (Supplementary Information). Only one of these 21 genes is annotated by the Gene Ontology resource21,22 as being relevant to ‘DNA repair’ or the ‘cellular response to DNA damage’: the mouse homologue of the mutY DNA glycosylase gene Mutyh. MUTYH excises adenines that are mispaired with 8-oxoguanine lesions caused by reactive oxygen species. Left unrepaired, this mispairing can cause C>A mutations23. We observed a total of 5 moderate-impact differences between the B and D alleles of Mutyh (Extended Data Table 2).
Mutyh deficiency contributes to a mutator phenotype in the germlines of the TOY-KO mice, a triple-knockout strain lacking Mutyh as well as Mth1 and Ogg1, the other primary genes required for 8-oxoguanine repair24. TOY-KO mice have a de novo germline mutation rate nearly 40-fold above normal24 and a de novo mutation spectrum with very high cosine similarity (0.94) to SBS18, a mutational signature dominated by CA>AA and CT>AT mutations4,25 that has been identified in colorectal and pancreatic tumours from human patients with pathogenic germline MUTYH mutations3,4,26.
We used SigProfilerExtractor27 to find the combination of human cancer mutational signatures that would best explain the BXD singleton mutation spectra. SigProfilerExtractor assigned 13.9% of BXD singletons to the MUTYH-associated SBS18 signature (Supplementary Table 2) and decomposed the remaining singletons into three additional signatures: SBS1 (14.2% of mutations), SBS5 (55.6%) and SBS30 (16.4%). SBS1, SBS5 and SBS30 were each identified in the majority of BXDs (94 out of 94, 91 out of 94, and 78 out of 94 BXDs, respectively), with no statistically significant imbalances between B and D lines (all Chi-square P values were greater than 0.99). By contrast, SBS18 was identified in just 52 out of 94 lines, including 50 out of 56 D haplotype lines and only 2 out of 38 B haplotype lines (Chi-square P = 4.9 × 10⁻¹⁵). SBS18 activity is thus a highly accurate classifier of BXD haplotype status at the QTL on chromosome 4. As expected, D lines are enriched for the same 3-mer C>A mutation types that are most abundant in TOY-KO germline mutations (Fig. 3).
Fig. 3 |. Context-dependent C>A mutation enrichment in lines with the D haplotype at the C>A QTL.
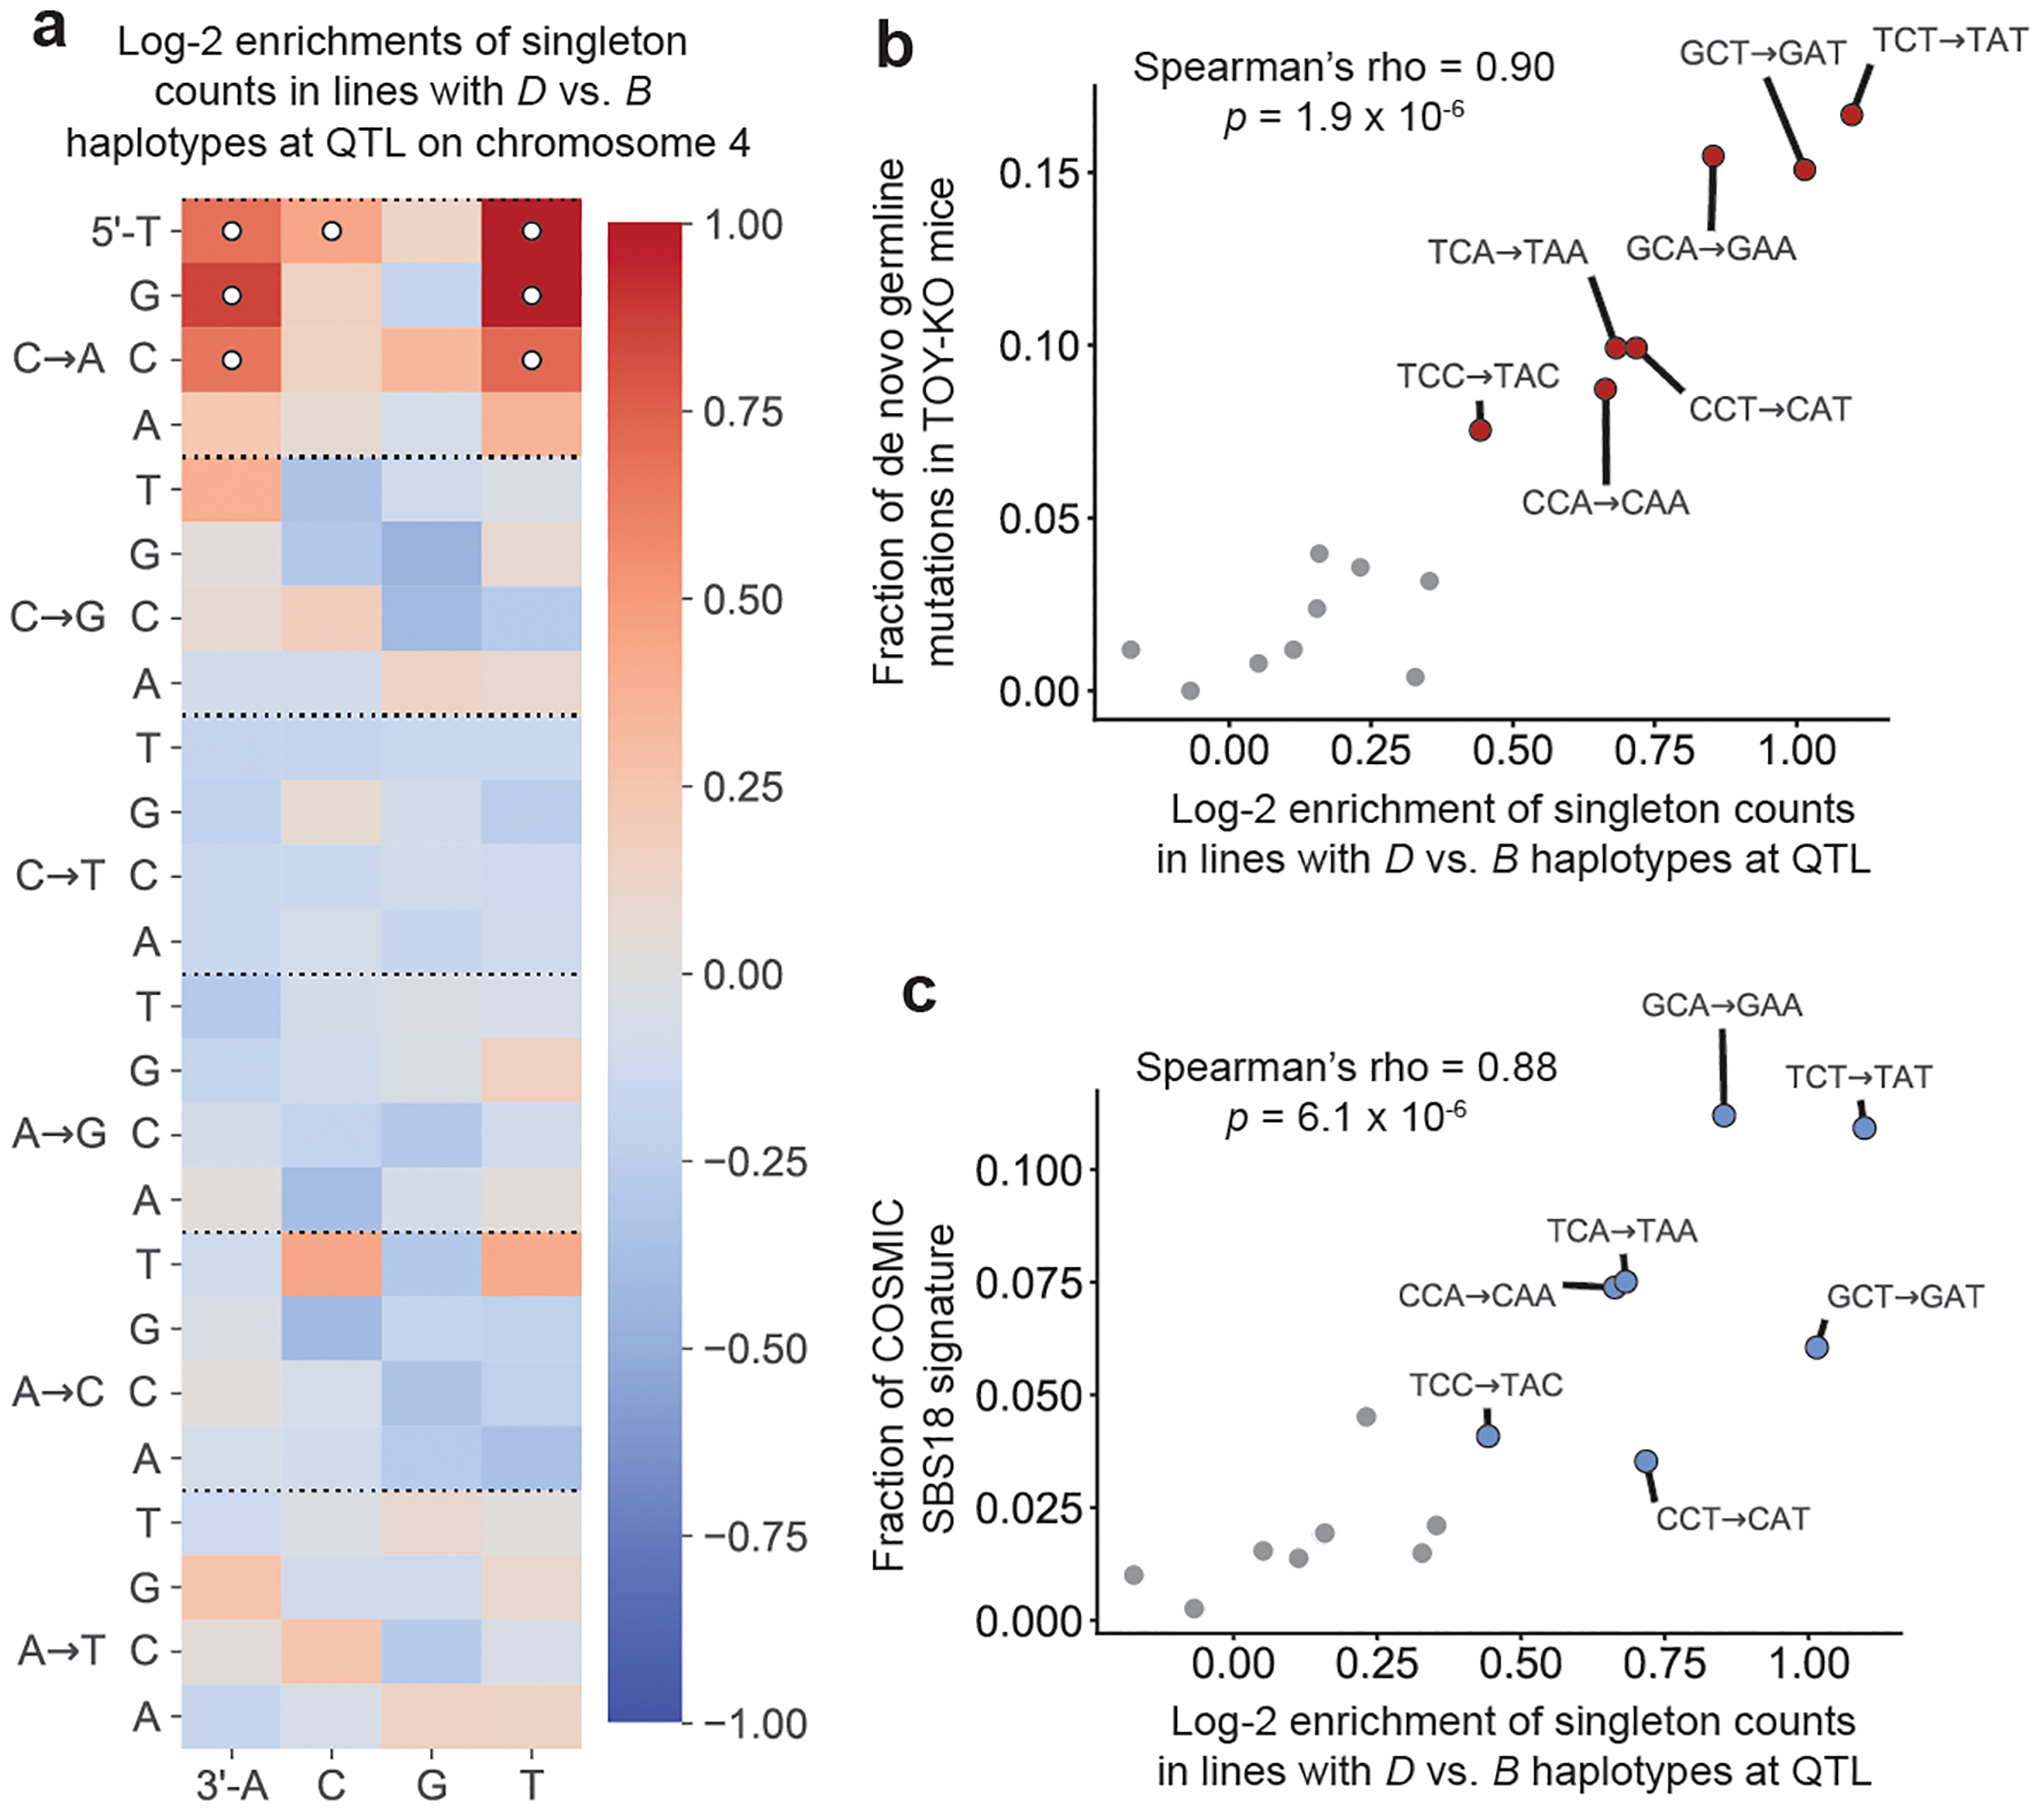
a, log2 ratios of mutation fractions in lines with D haplotypes (n = 56 biologically independent mice) compared with lines with B haplotypes (n = 38 biologically independent mice) at the QTL on chromosome 4. Mutation types with Chi-square test of independence P < 0.05/96 (Bonferroni-corrected) are marked with white circles. b, The log2 enrichments of C>A mutations in each 3-mer context in D versus B lines from a are plotted against the relative abundances of C>A mutations in each context in a previously reported set of de novo mutations from Mutyh−/−Ogg1−/−Mth1−/− mice24 (n = 252 mutations). Correlation was quantified using the Spearman’s rank correlation coefficient (rho = 0.90, P = 1.9 × 10⁻⁶). 3-mer mutation types with significant enrichments labelled in a are coloured in red and outlined in black. c, The log2 enrichments of C>A mutations in each 3-mer context in D versus B lines from a are plotted against the relative abundances of C>A mutations in each context in the SBS18 COSMIC mutation signature. Correlation was quantified using the Spearman’s rank correlation coefficient (rho = 0.88, P = 6.1 × 10⁻⁶). 3-mer mutation types with significant enrichments labelled in a are coloured blue and outlined in black.
Alternative explanations for the QTL
Although Mutyh is the only DNA-repair-associated gene that harbours coding differences between the B and D QTL haplotypes, three additional genes within the QTL interval are linked to the Gene Ontology terms ‘DNA repair’ or the ‘cellular response to DNA damage’ (Plk3, Rad54L and Dmap1). A fourth gene, Prdx1, is associated with ‘cellular response to oxidative stress’. In principle, regulation of these genes could influence the BXD mutation spectrum, but to our knowledge, none are implicated in C>A mutagenesis, making them a priori less likely than Mutyh to cause the observed mutator phenotype.
To explore the possible significance of variants affecting gene regulation, we used GeneNetwork28 to test for associations between the SNP marker with the highest LOD score at the QTL (rs52263933) and gene expression in a number of cell types (Supplementary Information). We identified three genes (Atpaf1, Rps8 and Mutyh), whose expression was most significantly associated with rs52263933 genotypes. This result suggests that we cannot rule out a contribution of expression quantitative trait loci (eQTLs) to the C>A germline mutator phenotype, but our power to interpret these eQTLs is limited by the large size of the QTL region (approximately 4 Mbp) and the lack of BXD expression data from germline tissues such as testis and ovary.
Finally, we queried the database of structural variants identified by the Mouse Genomes Project consortium29 but found no fixed structural differences between B and D haplotypes that might explain the C>A mutator phenotype (Supplementary Information).
A C>A hypermutator phenotype in BXD68
One outlier D line, BXD68, was excluded from QTL scans because its C>A singleton fraction was 5.6 standard deviations above the mean (Fig. 2b). SigProfilerExtractor assigned nearly 55% of the mutations in BXD68 to SBS18, suggesting a shared aetiology between its hypermutator phenotype and the mutator phenotype common to all D strains. We hypothesized that BXD68 might harbour a private mutator allele within the chromosome 4 QTL and found two BXD68-specific singletons within this interval: an intronic variant in Kdm4a and, notably, a missense mutation in Mutyh (p.Arg153Gln) (Extended Data Table 2). One DNA repair gene outside the QTL, Rev3l, harbours a nonsynonymous singleton in BXD68; however, Rev3l is located on chromosome 10 and is associated with a mutational signature that is dominated by mutations at GC dinucleotides30 and does not resemble any mutator phenotype that is active in the BXD lines.
The BXD68 singleton affects an amino acid that is conserved between humans and mice (p.Arg179, relative to the human Ensembl transcript ENST00000372098.3). Two missense mutations that affect the human p.Arg179 amino acid (rs747993448 and rs143353451) are both listed in the ClinVar database as being pathogenic or probably pathogenic31, and the mouse p.Arg153Gln amino acid change is predicted to be deleterious by both PROVEAN32 and SIFT33. On the basis of this evidence, we hypothesize that p.Arg153Gln arose as a de novo germline mutation in BXD68 and impairs the 8-oxoguanine DNA damage response even more severely than the mutator allele(s) that occurs on its background D haplotype.
The BXD Mutyh alleles are derived from the wild
Using publicly available whole mouse genomes, we observed both the B and D Mutyh variants segregating in wild populations of M. musculus domesticus, the subspecies from which laboratory mice derive most of their genetic ancestry34 (Fig. 4a), This suggests that the C>A QTL may be shaping the accumulation of genetic variation in nature (although no wild mice are known to possess the BXD68-private p.Arg153Gln variant). Unexpectedly, the outgroup species Mus spretus appears to be fixed for the D allele at four of the five coding Mutyh sites at which it differs from the B allele (Fig. 4a). A multiple sequence alignment of additional vertebrates (Fig. 4b) supports the hypothesis that the D allele is ancestral relative to the low-mutation-rate reference B allele.
Fig. 4 |. Nonsynonymous differences between B and D Mutyh alleles segregate in both wild and inbred mouse strains and appear to be ancestral in DBA/2J.
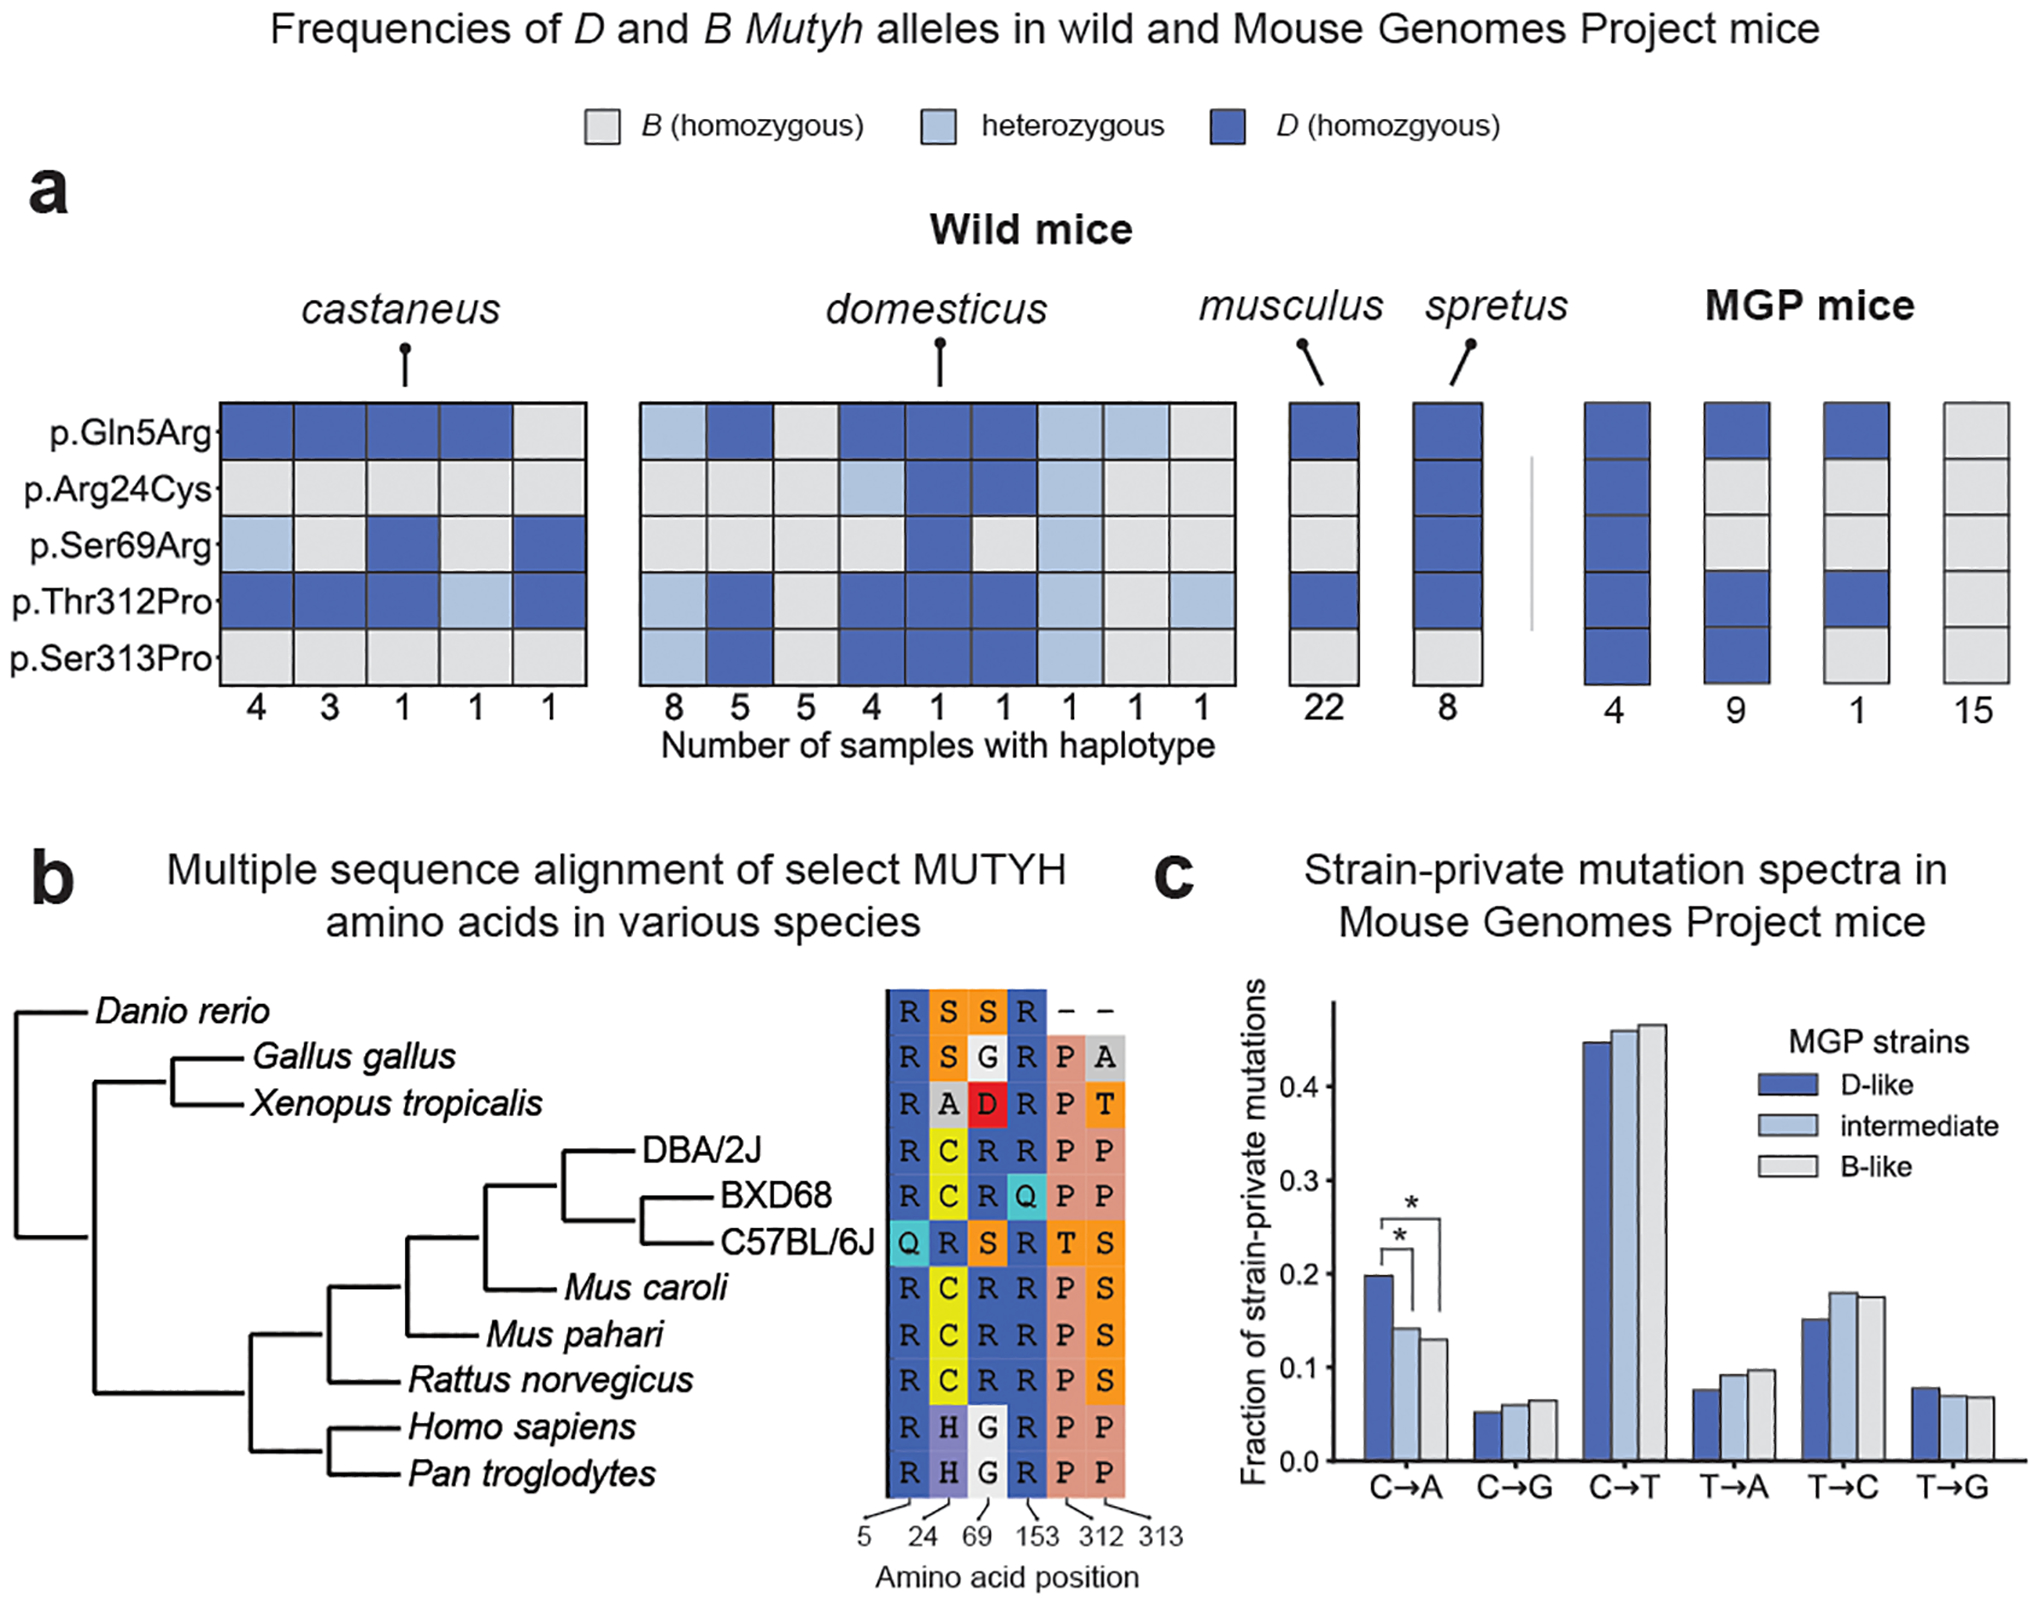
a, Presence of D or B Mutyh alleles in 67 wild mice35 and in 29 Sanger Mouse Genomes Project (MGP) strains that have associated strain-private singleton data17. Unique combinations of Mutyh alleles are represented using columns of coloured boxes. Wild mice are grouped by species or subspecies, and the number of mice with each unique combination of Mutyh alleles is listed below each column. MGP mice are grouped by Mutyh genotype, and each genotype is labelled with the number of lines where this allele combination is found. b, Multiple sequence alignment of MUTYH amino acids is subsetted to only show the six amino acids affected by moderate- or high-impact mutations in the BXD. Positions of amino acids in the mouse MUTYH peptide sequence (ENSMUST00000102699.7) are shown below each column. c, Mutation spectra of MGP strains17 with D-like, intermediate, and B-like Mutyh genotypes. D-like strains have significantly higher C>A fractions than B-like (P = 1.4 × 10⁻¹⁰) and intermediate strains (P = 3.3 × 10⁻⁷; C>A fractions of intermediate and B-like strains are not significantly different (P = 0.12; Chi-square test).
Among 29 laboratory mouse strains sequenced by the Sanger Mouse Genomes Project29 (MGP), four (including DBA/2J) match the D strains at all five sites, whereas 15 (including C57BL/6NJ) match B strains at all five sites (Supplementary Table 3). Nine ‘intermediate’ strains harbour D alleles at amino acids 5, 312 and 313, and B alleles at amino acids 24 and 69 (Fig. 4a, Supplementary Table 3). As expected, the D-like strains have the highest fractions of germline C>A mutations, particularly the CA>AA and CT>AT dinucleotide types that dominate SBS18 (Fig. 4c, Extended Data Fig. 5). However, we found no significant mutation spectrum differences between the intermediate and B-like strains (Fig. 4c). These observations tentatively point to p.Arg24Cys and p.Ser69Arg as the variants most likely to underlie the QTL mutator phenotype.
In theory, B and D alleles should shape natural mouse genetic variation by causing more C>A variants to accumulate in wild populations with more D alleles. Although we found some evidence for increased C>A mutagenesis in wild mouse subspecies35 with the highest D allele frequencies (Extended Data Figs. 6–8, Supplementary Information), other forces such as biased gene conversion and additional mutators might contribute to this pattern. Additional sampling of wild mice will be needed to better assess the historical activity of the BXD mutator.
No evidence for selection on Mutyh
Since new mutations are more often deleterious than beneficial, natural selection is generally expected to favour lower mutation rates1. However, we found no evidence for deviations from neutral evolution near the QTL in wild mice (Supplementary Information). This finding is somewhat surprising in light of the mutator’s effect size; using population genetic theory and a previous estimate of the average fitness effect of de novo coding mutations in mice36, we estimated that the B allele should avoid enough excess deleterious mutations to be favoured with a selection coefficient (s) of about 3 × 10⁻⁴ to 6 × 10⁻⁴ (Supplementary Information). This should have been advantageous enough to drive the B allele to fixation in a mouse population of effective size N = 5 × 10⁴ (refs.37, 38), assuming its antimutator phenotype is not completely dominant or recessive. However, a number of factors may have impeded such a sweep, including mouse population substructure, the activities of other genetic mutation-rate modifiers, and antagonistic pleiotropy. Additionally, if the mutagenic effect of the D allele is recessive (like the disease phenotypes associated with deleterious human MUTYH missense mutations), the ancestral mutator may hide out neutrally in heterozygotes, impeding fixation of the derived B allele.
Discussion
Our discovery of a genetic modifier of the mouse C>A mutation rate provides new support for the long-standing theoretical prediction that multicellular eukaryotes have a limited ability to optimize their germline DNA replication fidelity1. Our work shows that common mutator alleles, previously identified only in microorganisms such as Saccharomyces cerevisiae39,40, also shape vertebrate genetic diversity.
We argue that the BXD mutator phenotype is probably caused by natural variation in Mutyh, the only DNA repair gene in the QTL interval that contains nonsynonymous coding differences between the parental strains. Although we cannot completely rule out the contributions of nearby genes or regulatory variants, Mutyh exhibits the strongest prior link to the C>A dominated SBS18 mutation signature of any protein-coding gene in the QTL interval (Supplementary Information). In human patients with colorectal cancer, SBS18 activity has been found to be 100% predictive of inherited pathogenic biallelic MUTYH missense variants26, and individuals with biallelic germline MUTYH mutations exhibit elevated rates of somatic mutation in normal cells, primarily attributable to SBS18 and a related signature called SBS3641. Mutyh is also the only gene in the QTL interval (and one of only two DNA repair genes genome-wide) that harbours non-synonymous coding variation in BXD68, an outlier line with an exceptionally high C>A mutation rate and SBS18 burden. Other than Mutyh, none of the other genes within the C>A QTL has a documented association with SBS18, and none would parsimoniously explain the C>A hypermutator phenotype of BXD68 (Supplementary Information).
Our findings add weight to the conjecture that natural mutator alleles underlie some of the species-specific and population-specific signatures previously observed in humans and other great apes12,42, and demonstrate that mutators are mappable in model organisms using QTL analysis. Differences in mutation spectra observed across other mouse populations17 suggest that the BXD mutator is just one of several active mutator alleles in mice, any of which might have been detected if the ‘right’ parents had been selected to initiate a cross like the BXD. We anticipate that mutator allele discovery will become increasingly feasible across the tree of life as sequencing costs continue to decline, providing long-awaited data needed to test theoretical predictions about selection on this fundamental phenotype.
Online content
Any methods, additional references, Nature Research reporting summaries, source data, extended data, supplementary information, acknowledgements, peer review information; details of author contributions and competing interests; and statements of data and code availability are available at https://doi.org/10.1038/s41586-022-04701-5.
Methods
All Python and R code used in these analyses is available at https://github.com/tomsasani/bxd_mutator_manuscript. We used snakemake43 to write a collection of pipelines that can be used to reproduce all analyses described in the manuscript. No statistical methods were used to predetermine sample sizes. Samples were not allocated into separate experimental groups or randomized for the purpose of this analysis. Investigators were therefore not blinded to group allocation during this study.
Construction of the BXD RILs
The University of Tennessee Health Sciences Center Institutional Animal Care and Use Committee (IACUC) provided approval for the BXD breeding colony at UTHSC. Approval number: 18–094.0 B. Detailed descriptions of the BXD dataset, including the construction of the BXD RIL, can be found in a previous manuscript2. In brief, the BXD RILs were derived from crosses of the DBA/2J and C57BL/6J inbred laboratory strains initiated in six distinct epochs from 1971 to 2014. RILs were produced using one of two strategies: four epochs were produced using the standard F2 cross, and two were produced using the advanced intercross strategy. In the F2 cross design, a male DBA/2J mouse is crossed to a C57BL/6J female to produce F1 mice that are heterozygous for parental ancestry at essentially all loci in the genome. Pairs of these F1 mice are then crossed to produce F2 mice. To generate each individual RIL, a brother and sister are picked from among the F2 mice and mated; this brother-sister mating strategy continues for many generations. In the advanced intercross line (AIL) cross design, F2 mice are generated as in the standard F2 cross. However, pseudo-random pairs of F2 mice are then crossed to generate F3 mice, pseudo-random pairs of F3 mice are crossed to generate F4 mice, and so on, for up to 14 generations. Then, to generate inbred lines, brother–sister matings are once again initiated from the offspring of the final pseudo-random cross. Schematic diagrams of the F2 cross and AIL strategies are shown in Extended Data Fig. 1.
Whole-genome sequencing, alignment and variant calling
BXD mice (all males) were euthanized using isoflurane, and were a median of 51 days old at time of sequencing. Spleen tissue was collected immediately, flash frozen with liquid nitrogen, and placed in a −80 °C freezer for subsequent analysis. All DNA extraction, library preparations and sequencing was carried out by HudsonAlpha. High molecular weight genomic DNA was isolated from 50 to 80 mg of spleen tissue using the Qiagen MagAttract kit (Qiagen). The Chromium Gel Bead and Library Kit (v2 HT kit, revision A; 10X Genomics) and the Chromium instrument (10X Genomics) were used to prepare libraries for sequencing; barcoded libraries were then sequenced on the Illumina HiSeq X10 system. FASTQ files were aligned to the mm10/GRCm38 reference genome using the 10X LongRanger software (v2.1.6), using the Lariat alignment approach. Variant calling was carried out on aligned BAM files using GATK (version v3.8–1-0-gf15c-1c3ef)44 to generate gVCF files; these gVCFs were then joint-called to produce a complete VCF file containing variant calls for all BXDs and founders. GATK variant quality score recalibration (VQSR) was then applied to the joint-called VCF. A list of known, ‘true-positive’ variants was created for VQSR by identifying variants which were shared across three distinct call sets: (1) variants identified in DBA/2J in this study, (2) variants previously identified in DBA/2J45, and (3) variants identified in DBA/2J in the Sanger Mouse Genomes Project29. This generated a set of 3,972,727 SNPs, 404,349 deletions and 365,435 insertions; we were highly confident that these varied between the DBA/2J and reference sequences and expected that each should appear in approximately 50% of the BXD strains. The SNP and indel variant calls from the Sanger Mouse Genomes project29 were also used as a training resource for VQSR.
Identifying homozygous singleton variants in the BXD RILs
To confidently identify singletons (sites with a non-reference allele in exactly one of the BXD RIL) we iterated over all autosomal variants in the joint-genotyped VCF using cyvcf246 and identified variants that passed the following filters: first, we removed all variants that overlapped segmental duplications or simple repeat annotations in mm10/GRCm38, which were downloaded from the UCSC Genome Browser. We limited our analysis to single nucleotide variation and did not include any small insertion or deletion variants. At each site, we required both founder genotypes (DBA/2J and C57BL/6J) to be homozygous for the reference allele, for each of these genotypes to be supported by at least 10 sequencing reads, and for Phred-scaled genotype qualities in both founders to be at least 20. We then required that exactly one of the BXD RILs had a heterozygous or homozygous alternate (that is, non-reference) genotype at the site; although we only included 94 BXDs in downstream analyses (Supplementary Information), the genome sequences of all sequenced BXDs (except for the small number of BXDs that were isogenic with another line) were considered when identifying potential singletons to ensure that none of the excluded strains possessed the putative singleton allele present in the focal strain. To include a heterozygous genotype in our singleton callset, we required its allele balance (the fraction of reads supporting the non-reference allele) to be ≥0.9. For candidate heterozygous and homozygous singletons, we also required the genotype call to be supported by at least 10 total sequencing reads (including both reference and alternate alleles) and have Phred-scaled genotype quality at least 20. Finally, we confirmed that at least one other BXD shared a parental haplotype identical-by-descent with the focal strain (that is, the strain with the putative singleton) at the singleton site but was homozygous for the reference allele at that site (Supplementary Information).
We additionally annotated the full autosomal BXD VCF with SnpEff20 version 4.3t, using the GRCm38.86 database and the following command: java -Xmx16g -jar /path/to/snpeff/jarfile GRCm38.86 /path/to/bxd/vcf > /path/to/uncompressed/output/vcf.
Annotating singletons with triplet sequence contexts and conservation scores
For each candidate singleton variant, we were interested in characterizing the 5′ and 3′ sequence context of the mutation, as well as the phastCons conservation score of the nucleotide at which the variant occurred. To determine the sequence context of each variant, we used the mutyper Python API47. To annotate each variant with its phastCons score, we downloaded phastCons scores derived from a 60-way placental mammal alignment for the mm10/GRCm38 genome build in WIG format from the UCSC Table Browser. We then converted the WIG files to BED format using the bedops wig2bed subcommand48, compressed the BED format files with bgzip, and indexed the compressed BED files with tabix. Within the Python script used to identify singletons, we then used pytabix (https://github.com/slowkow/pytabix) to query the phastCons BED files at each putative singleton.
QTL mapping
We used the R/qtl2 software19 for QTL mapping in this study. Prior to running QTL scans, we downloaded a number of data files from the R/qtl2 data repository (https://github.com/rqtl/qtl2data), including physical (Mbp) and genetic (cM) maps of the 7,320 genotype markers used for QTL mapping, as well as a file containing genotypes for all BXDs at each of these markers (adapted from http://gn1.genenetwork.org/dbdoc/BXDGeno.html). These files are also included in the GitHub repository associated with this manuscript.
We inserted pseudo-markers into the genetic map using insert_pseudomarkers and calculated genotype probabilities at each marker using calc_genoprob, with an expected error probability of 0.002. We additionally constructed a kinship matrix describing the relatedness of all strains used for QTL mapping using the leave-one-chromosome-out (LOCO) method. We then performed a genome scan using a linear mixed model (scan1 in R/qtl2), including the kinship matrix, a covariate for the X chromosome, and two additive covariates. The first additive covariate denoted the number of generations each RIL was intercrossed prior to inbreeding (0 for strains derived from standard F2 crosses, and N for strains derived from advanced intercross, where N is the number of generations of pseudo-random crosses performed before the start of inbreeding), and the second additive covariate denoted the epoch from which the strain was derived. To assess the significance of any log-odds peaks, we performed a permutation test (1,000 permutations) with scan1perm, using the same covariates and kinship matrix as described above. We calculated the Bayes 95% credible intervals of all peaks using the bayes_int function, with prob=0.95.
When performing QTL scans for a particular mutation fraction, we treated the phenotype as the centred log-ratio transform of the fraction of singletons of that type in each strain. When performing scans for mutation rates, we used the untransformed mutation rates (per base pair per generation) as the phenotype values.
Comparing C>A singleton fractions between BXDs with D and B haplotypes at the QTL on chromosome 4
To compare singleton fractions between BXDs with D versus B haplotypes at the QTL on chromosome 4, we first used a simple Welch’s two-sided t-test, which returned P < 2.2 × 10⁻¹⁶. Since each BXD line’s singleton mutations should, by definition, be unique to that line, we assumed that each singleton was an independent observation of a particular mutation. However, approximately 50% of each BXD RIL genome is expected to be derived from DBA/2J and 50% is expected to be derived from C57BL/6J; as a result, a pairwise kinship matrix constructed from BXD genotype data will contain non-zero values at essentially every position. To account for kinship between strains in our comparison of singleton fractions, we also fit a mixed effects model using the lmekin framework from the coxme R package. This model predicted C>A singleton fractions as a function of BXD haplotypes at the QTL on chromosome 4, and included the BXD kinship matrix as a random effect term. The P-value associated with the haplotype_at_qtl fixed-effect term remained highly significant (P < 2.2 × 10⁻¹⁶).
Comparing BXD mutation spectra to TOY-KO triple-knockout germline mutation spectra
Exome sequencing was previously performed on a large pedigree of mice with triple knockouts of Mth1, Mutyh and Ogg1 (in a C57BL/6J background) in order to identify de novo germline mutations in mice lacking base excision repair machinery24. The authors deposited all 263 de novo germline mutations observed in these mice in supplementary data file 1 associated with their manuscript. For each mutation, the authors report the reference and alternate alleles, as well as 50 bp of flanking sequence up- and downstream of the mutation. We used this information to construct a 3-mer mutation type (ACA>AAA, ACT>AAT, and so on.) for each C>A mutation, and then correlated the fractions of each of the 252 C>A 3-mers in the TOY-KO dataset with the enrichments of 3-mer C>A mutation types in BXDs with D vs B haplotypes at the QTL on chromosome 4.
Identifying COSMIC mutation signatures that explain mutation spectrum differences between mice with B and D haplotypes at the QTL
To uncover more of the genetic etiology of the C>A QTL we observed on chromosome 4, we used a tool called SigProfilerExtractor (v1.1.3)27 to decompose the mutation spectra of BXD autosomal singletons into distinct sets of COSMIC mutation signatures. In every BXD line, we counted the numbers of singleton mutations belonging to each of the 96 possible 3-mer mutation types (AAA>ATA, AAA>ACA, and so on). We then ran the sigProfilerExtractor command on the file containing per-strain counts of each mutation type, specifying maximum_signatures=10, nmf_replicates=100, and opportunity_genome=”mm10”.
Comparing mutation spectra in BXDs to COSMIC mutation signatures
We downloaded mutation signature data for the SBS18 signature from the Catalog of Somatic Mutations in Cancer (COSMIC) web page using the ‘Download signature in numerical form’ button: https://cancer.sanger.ac.uk/cosmic/signatures/SBS/SBS18.tt. We then correlated the abundances of C>A mutations in all 16 possible 3-mer contexts in the signature with the enrichment of each corresponding 3-mer C>A mutation observed in BXDs with D versus B haplotypes at the QTL on chromosome 4.
Generating phylogenetic comparisons of MUTYH protein sequences
We constructed an alignment of Mutyh amino acid sequences for the 9 species shown in Figure 4 using the web-based Constraint-based Multiple Alignment Tool (COBALT)49 and the following NCBI accessions: Mus musculus (XP_006503455.1), Rattus norvegicus (XP_038965128.1), Homo sapiens (XP_011539799.1), Pan troglodytes (XP_009454580.1), Mus caroli (XP_029332110.1), Mus pahari (XP_029395766.1), Gallus gallus (XP_004936806.2), Xenopus tropicalis (NP_001072831.1) and Danio rerio (XP_686698.2). On the COBALT results page, we first downloaded the resulting protein alignment in FASTA format. We then used the phylogenetic tree view to visualize and download the phylogenetic tree in Newick format.
We then downloaded Mutyh coding sequences for each of the above species from the NCBI Nucleotide browser using the following accessions: M. musculus (NM_133250.2), R. norvegicus (XM_039109200.1), H. sapiens (XM_011541497.3), P. troglodytes (XM_009456305.2), M. caroli (XM_029476250.1), M. pahari (XM_029539906.1), G. gallus (XM_004936749.3), X. tropicalis (NM_001079363.1) and D. rerio (XM_681606.7). We queried the NCBI Nucleotide database for each accession, used the ‘highlight sequence features’ option to identify the coding sequence, and downloaded the DNA coding sequence in FASTA format.
To visualize both the phylogenetic tree and corresponding Mutyh multiple protein sequence alignment, we first reformatted the protein alignment so that it included three separate entries for C57BL/6J, DBA/2J, and the BXD68 line. Specifically, we modified the M. musculus amino acids at positions 5, 24, 69, 312, 313 to create a new DBA/2J sequence, additionally modified the amino acid at position 153 to create a new BXD68 sequence from the DBA/2J sequence, and treated the canonical Mus musculus sequence as the C57BL/6J sequence. We reformatted the Mutyh coding sequences in the same way, in order to generate three separate entries for M. musculus corresponding to C57BL/6J, DBA/2J, and BXD68.
We then performed a codon-aware multiple sequence alignment of the reformatted coding sequences using the software tool pal2nal50. Finally, we visualized the Newick tree and associated multiple protein sequence alignment using the Python API of the ete3 toolkit51. During this analysis of the protein and coding sequences, we also used the BioPython library52.
Comparing mutation spectra between groups of Mouse Genomes Project strains
Strain-private substitutions were previously identified in whole genome sequencing data from 29 inbred laboratory mouse strains and filtered to enrich for recent de novo germline mutations that likely occurred in breeding colonies of these strains17. To compare the mutation spectra of various subsets of these strains (grouped by Mutyh genotype), we first downloaded supplementary data file 1 from the associated manuscript17. We used data from table S3, which includes both the counts of each mutation type in each strain, as well as the total number of A, T, C, and G base pairs that passed filtering criteria in each strain. Assuming we were comparing the spectra between group A and group B, for each mutation type we summed the total number of mutations of that type in group A and in group B, and we collapsed strand complements in our counts (that is, C>T and G>A are considered to be the same mutation type). Note that the prior report17 does not differentiate summarized counts of C>T mutations into CpG and non-CpG mutations, so our reanalysis of their data does not include the CpG>TpG mutation spectrum category that is part of our BXD analysis. We then summed the total number of callable base pairs corresponding to the reference nucleotide and its complement in group A and group B. As an example, if we were comparing the counts of C>T mutations between two groups, we summed the counts of callable C and G nucleotides in each group. We then adjusted the counts of each mutation type in either group A or B as follows. If the number of callable base pairs was larger in group B, we calculated the ratio of callable base pairs between A and B. We expected that if there were more callable base pairs in a group, then the number of mutations observed in that group might be higher simply by virtue of there being more mutable nucleotides. Therefore, we then multiplied this ratio by the count of mutations in group “B” in order to scale the B mutation count downward. If the number of callable base pairs were higher in A, we performed the same scaling to the counts of mutations in A. For each mutation type i, we then performed a Chi-square test of independence using a contingency table of four values: (1) the scaled count of mutations of type i in group A, (2) the scaled count of singleton mutations of type i in group B, (3) the sum of scaled counts of mutations not of type i in group A and (4) the sum of scaled counts of mutations not of type i in group B.
Reporting summary
Further information on research design is available in the Nature Research Reporting Summary linked to this paper.
Extended Data
Extended Data Fig. 1 |. Cross design for BXD RIL construction.
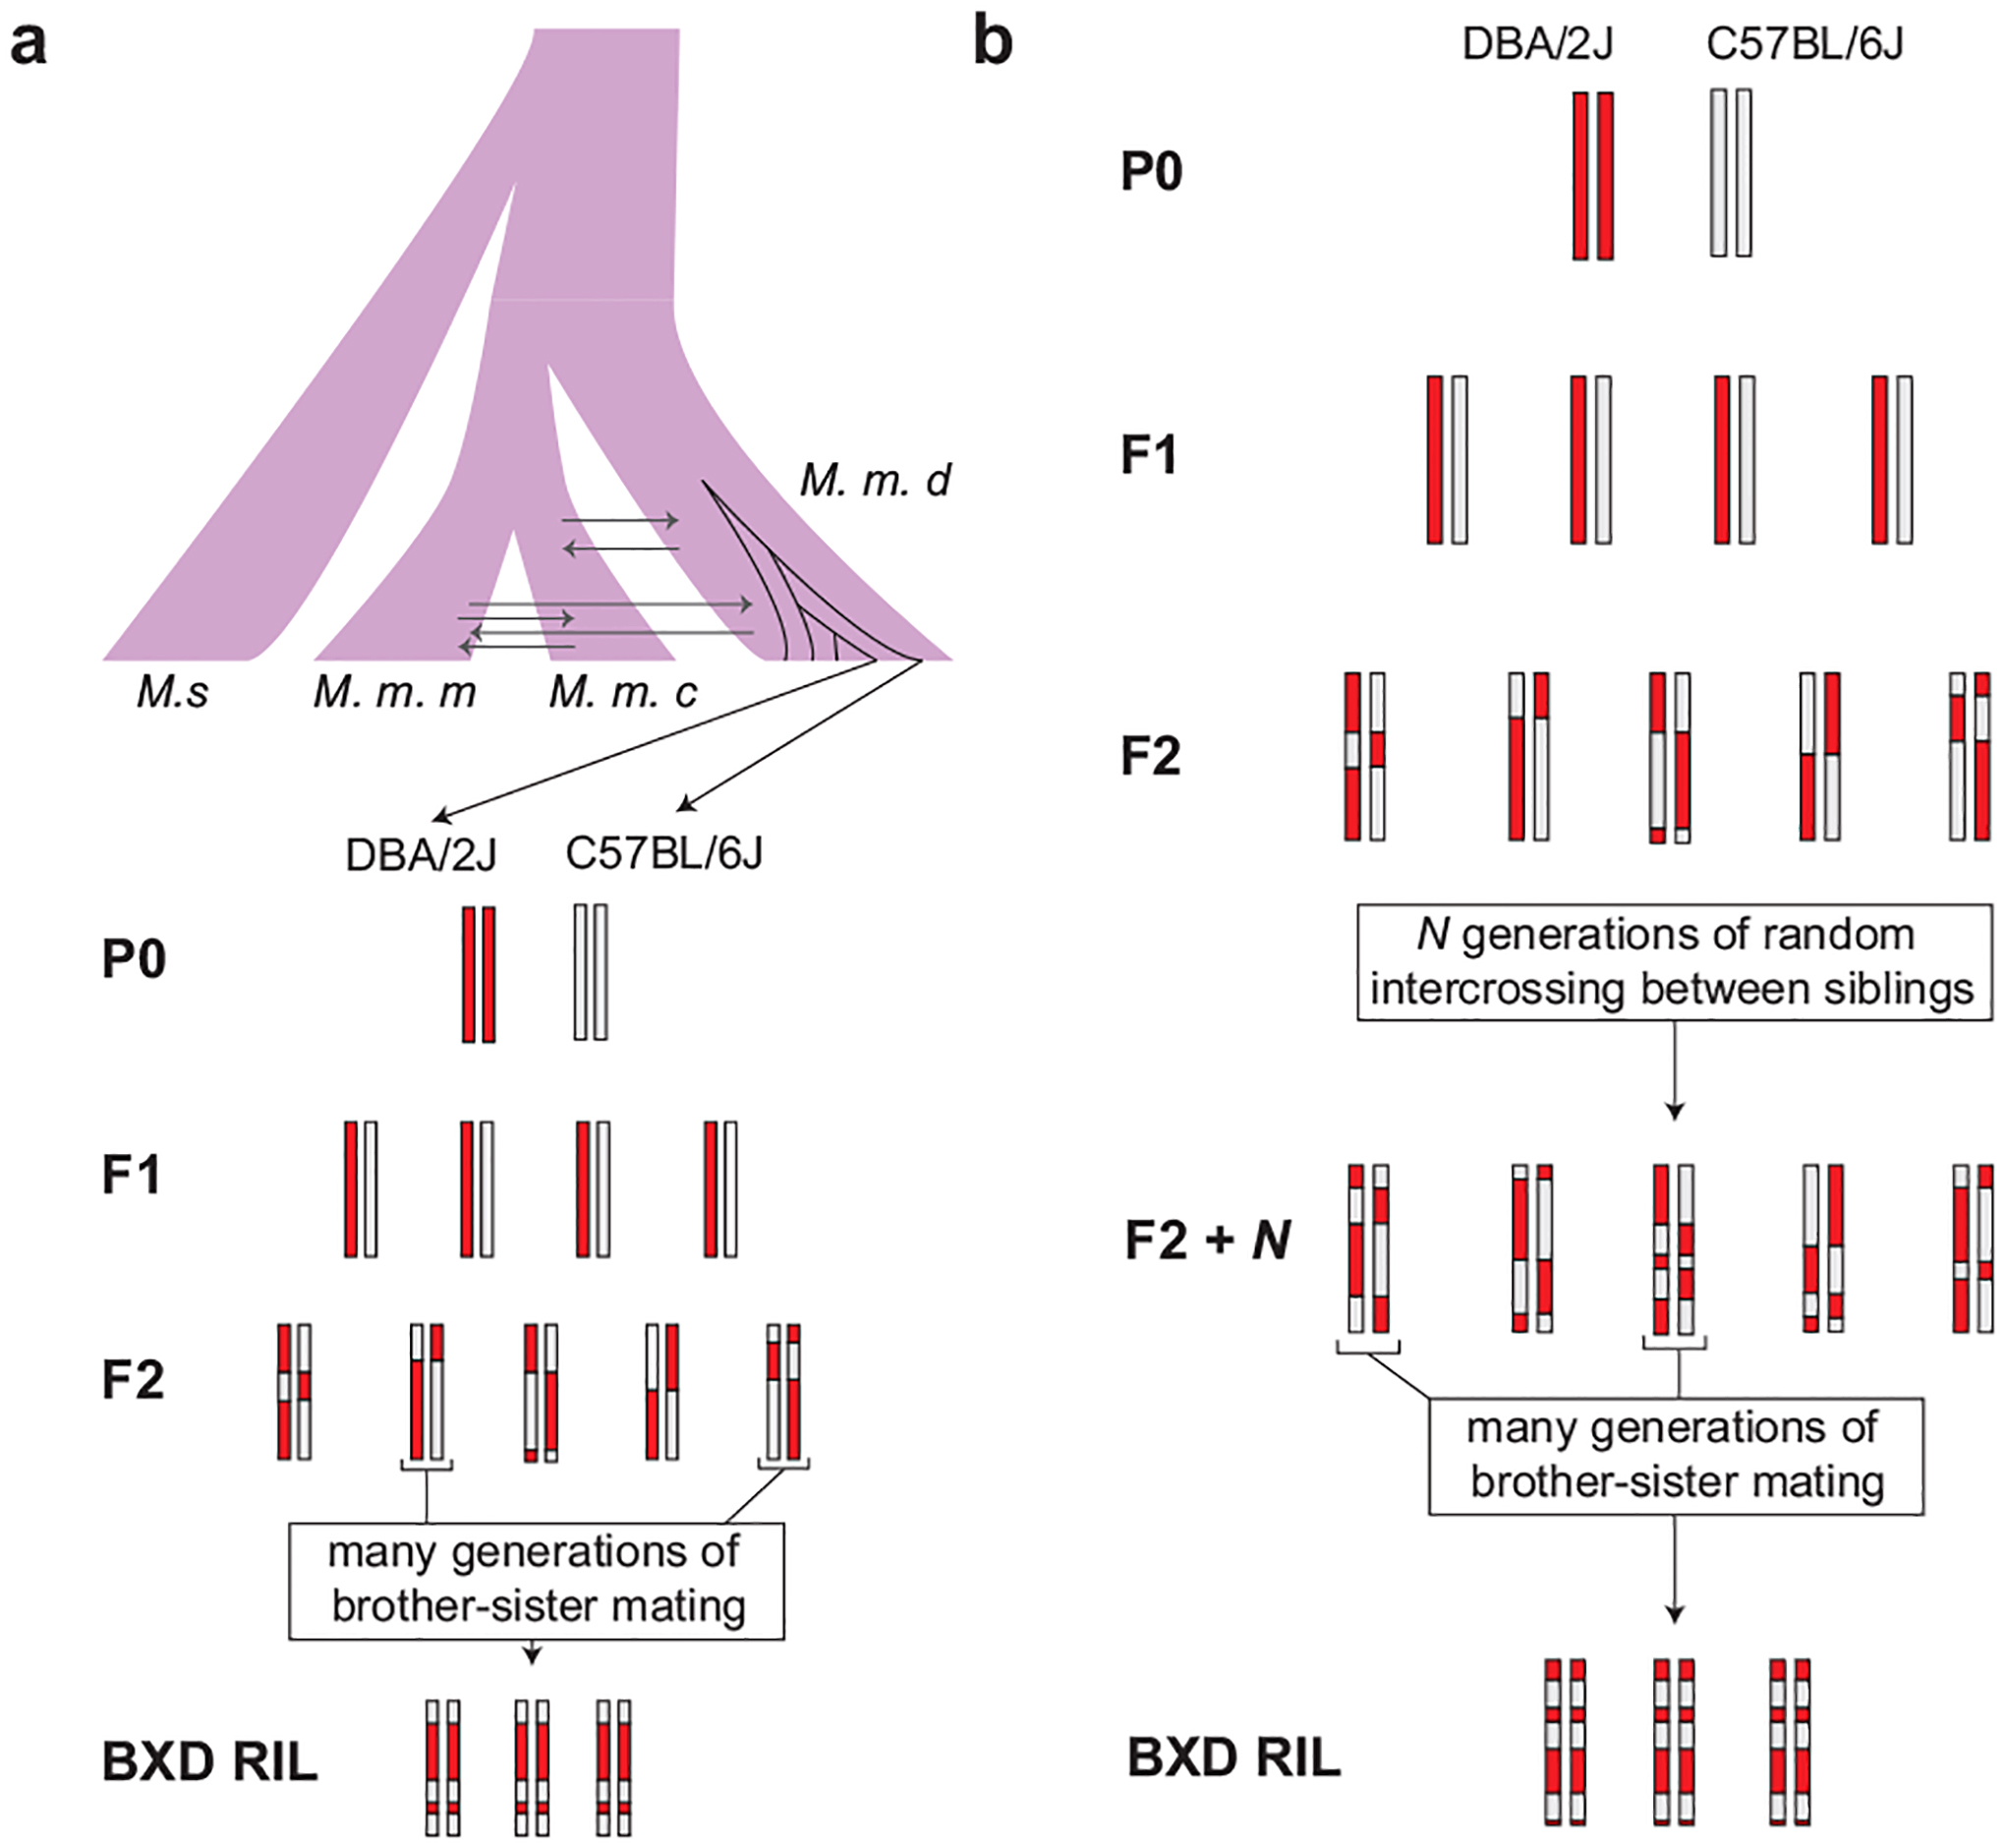
(a) BXDs derived from F2 crosses were subject to many generations of brother-sister mating in order to generate inbred RILs. The genomes of the parents of the BXD crosses (DBA/2J and C57BL/6J) are largely derived from Mus musculus domesticus. M. m. d. is Mus musculus domesticus, M. s. is Mus spretus, M. m. m. is Mus musculus musculus, and M. m. c. is Mus musculus castaneus. (b) To generate advanced intercross lines (AILs), pseudo-random pairs of F2 animals were crossed for N generations, and then subject to many generations of brother-sister mating to generate inbred RILs.
Extended Data Fig. 2 |. Generation times in the BXD lines.
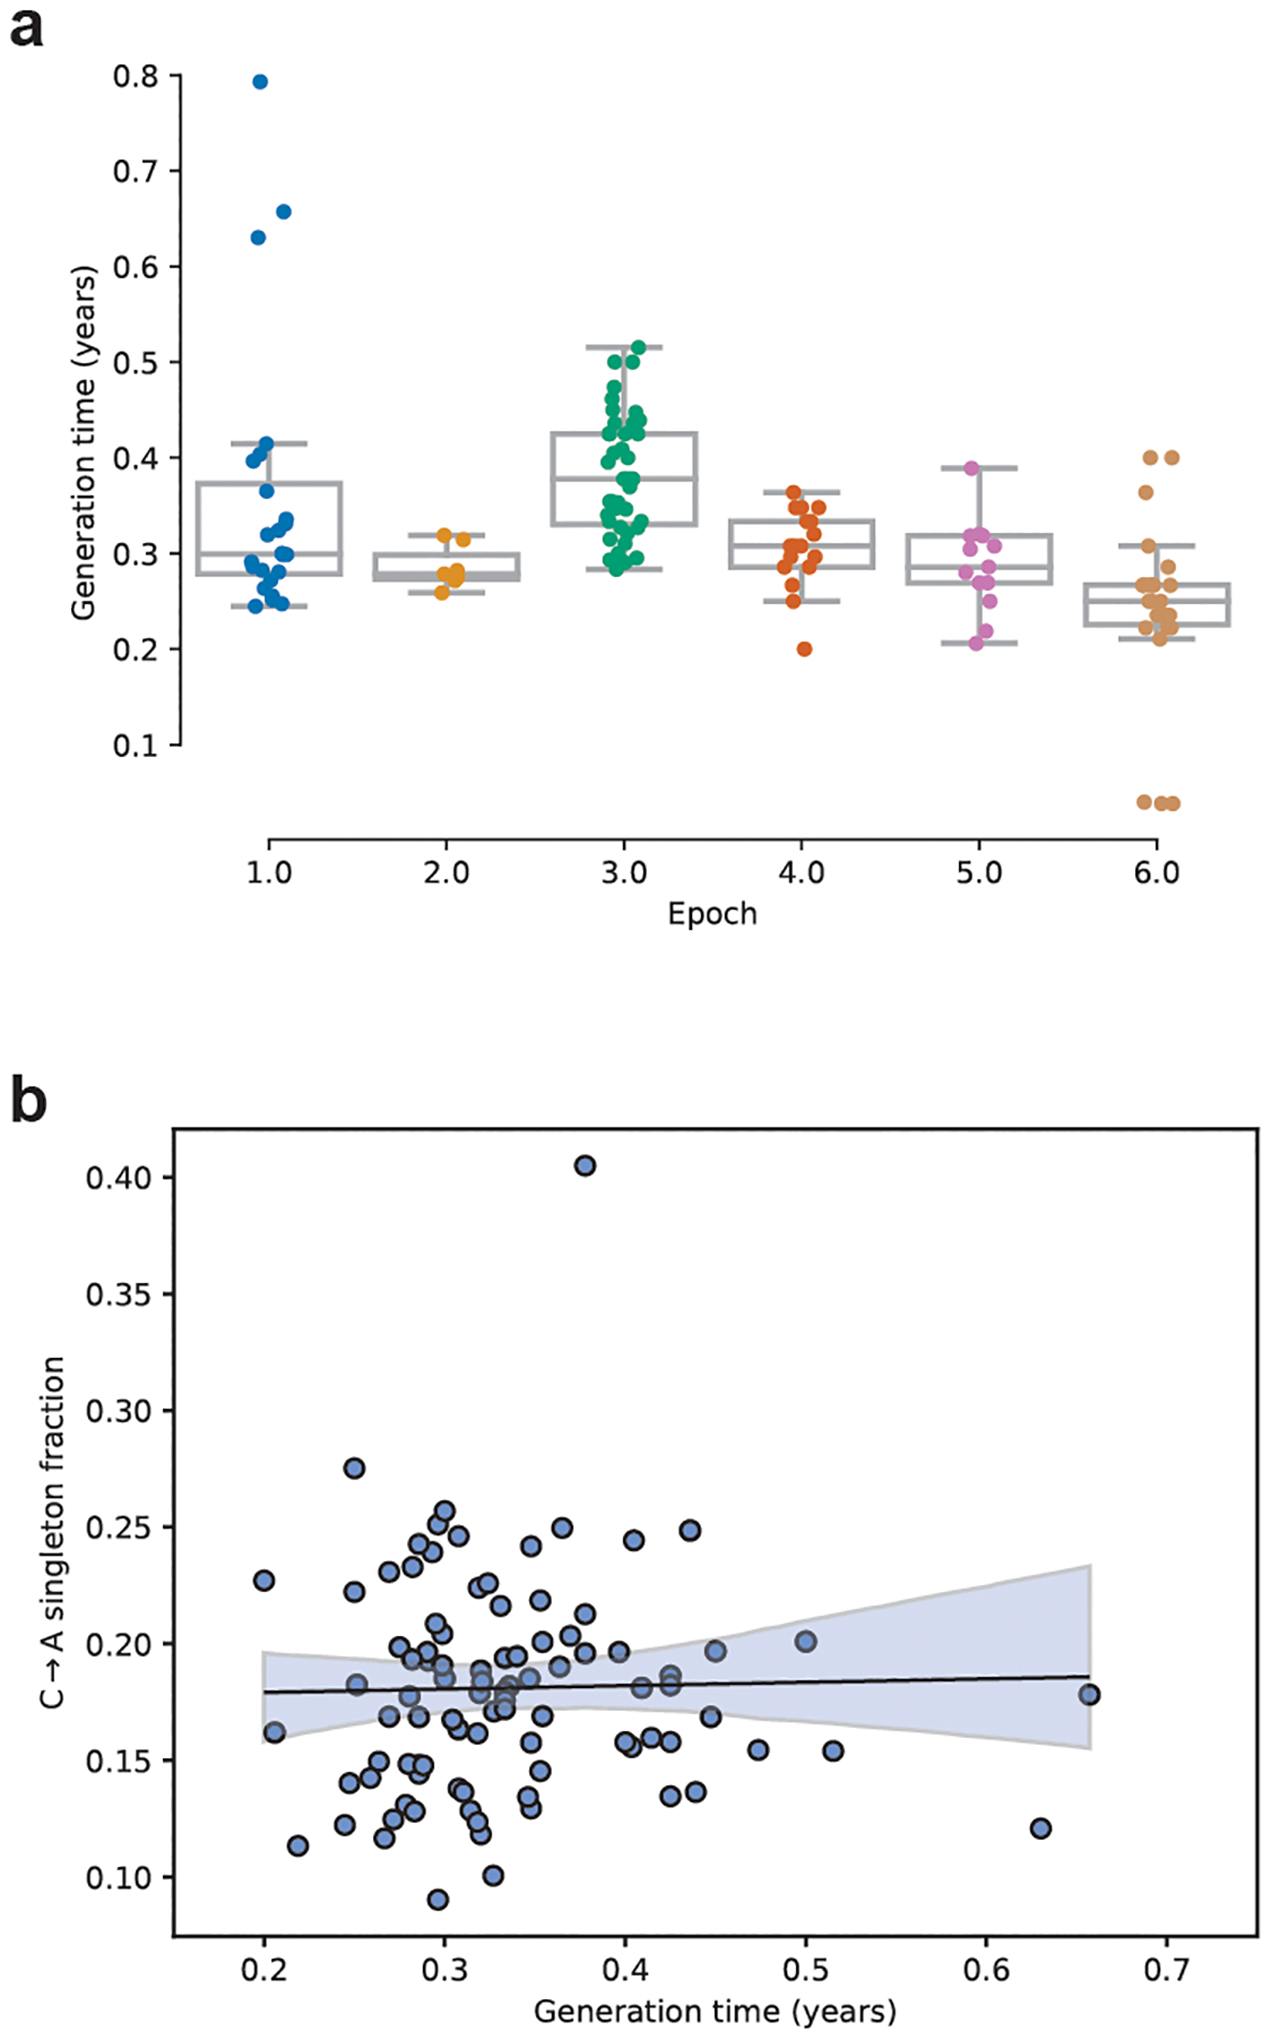
a) The elapsed time since the founding of each BXD line (n = 130 biologically independent animals) was calculated by subtracting its initial breeding date from 2017. The elapsed number of years was then divided by the cumulative number of generations of inbreeding undergone by the line, to obtain an estimate of the line’s generation time in years. Boxplots are centered at the median of each distribution, with lower and upper hinges corresponding to the 25th to 75th percentiles (i.e., first and third quartiles), and whiskers extending to no further than 1.5 times the interquartile range from either hinge; data points outside of the range defined by the whiskers are displayed as individual points. b) A linear model predicting the C>A singleton fraction of each line as a function of both generation time and the line’s epoch of origin was trained using the BXD singleton mutations. C>A fraction is not significantly correlated with generation time (F = 0.055, DoF = 1, p = 0.815).
Extended Data Fig. 3 |. Singletons are enriched in highly conserved regions of the genome.
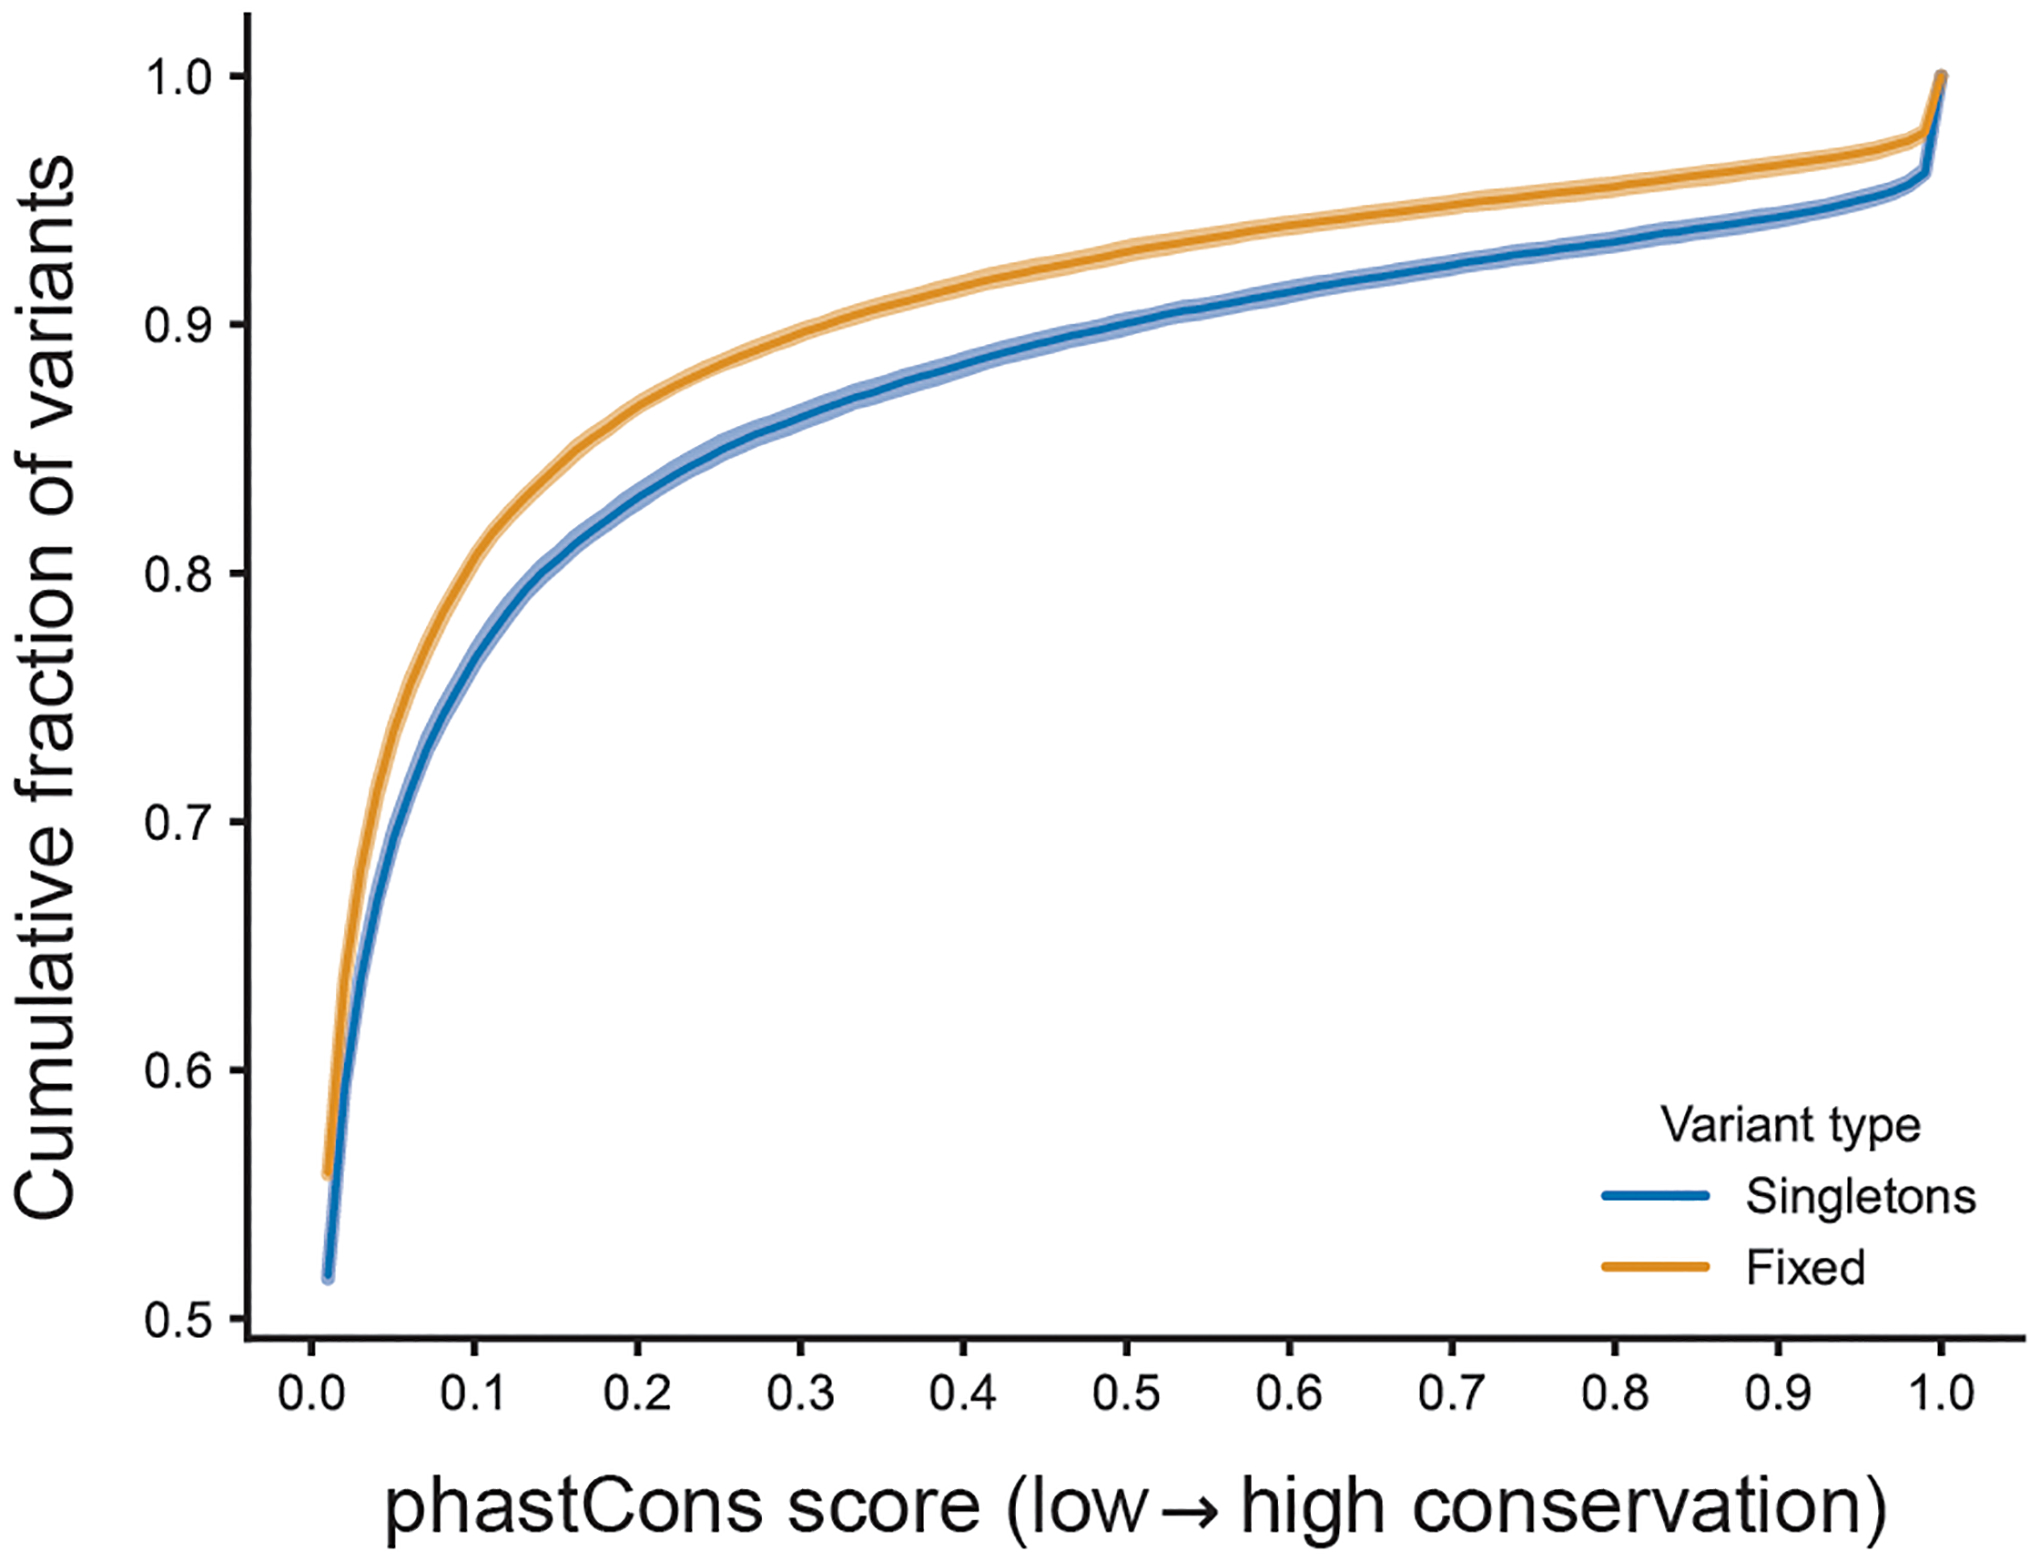
Cumulative distributions of phastCons conservation probabilities of either singletons (n = 47,659 mutations) or “fixed” variants (n = 81,186 mutations) that were randomly sampled from non-overlapping 50-kbp windows across the genome. The latter were present in a founder genome and inherited by all BXDs with the founder’s haplotype at that site. P-value of one-sided Kolmogorov-Smirnov test comparing distributions of phastCons scores is 3.8 × 10−53. Shaded area around each line indicates the bootstrap 95% confidence interval.
Extended Data Fig. 4 |. Results of QTL scans for other mutation rate phenotypes.
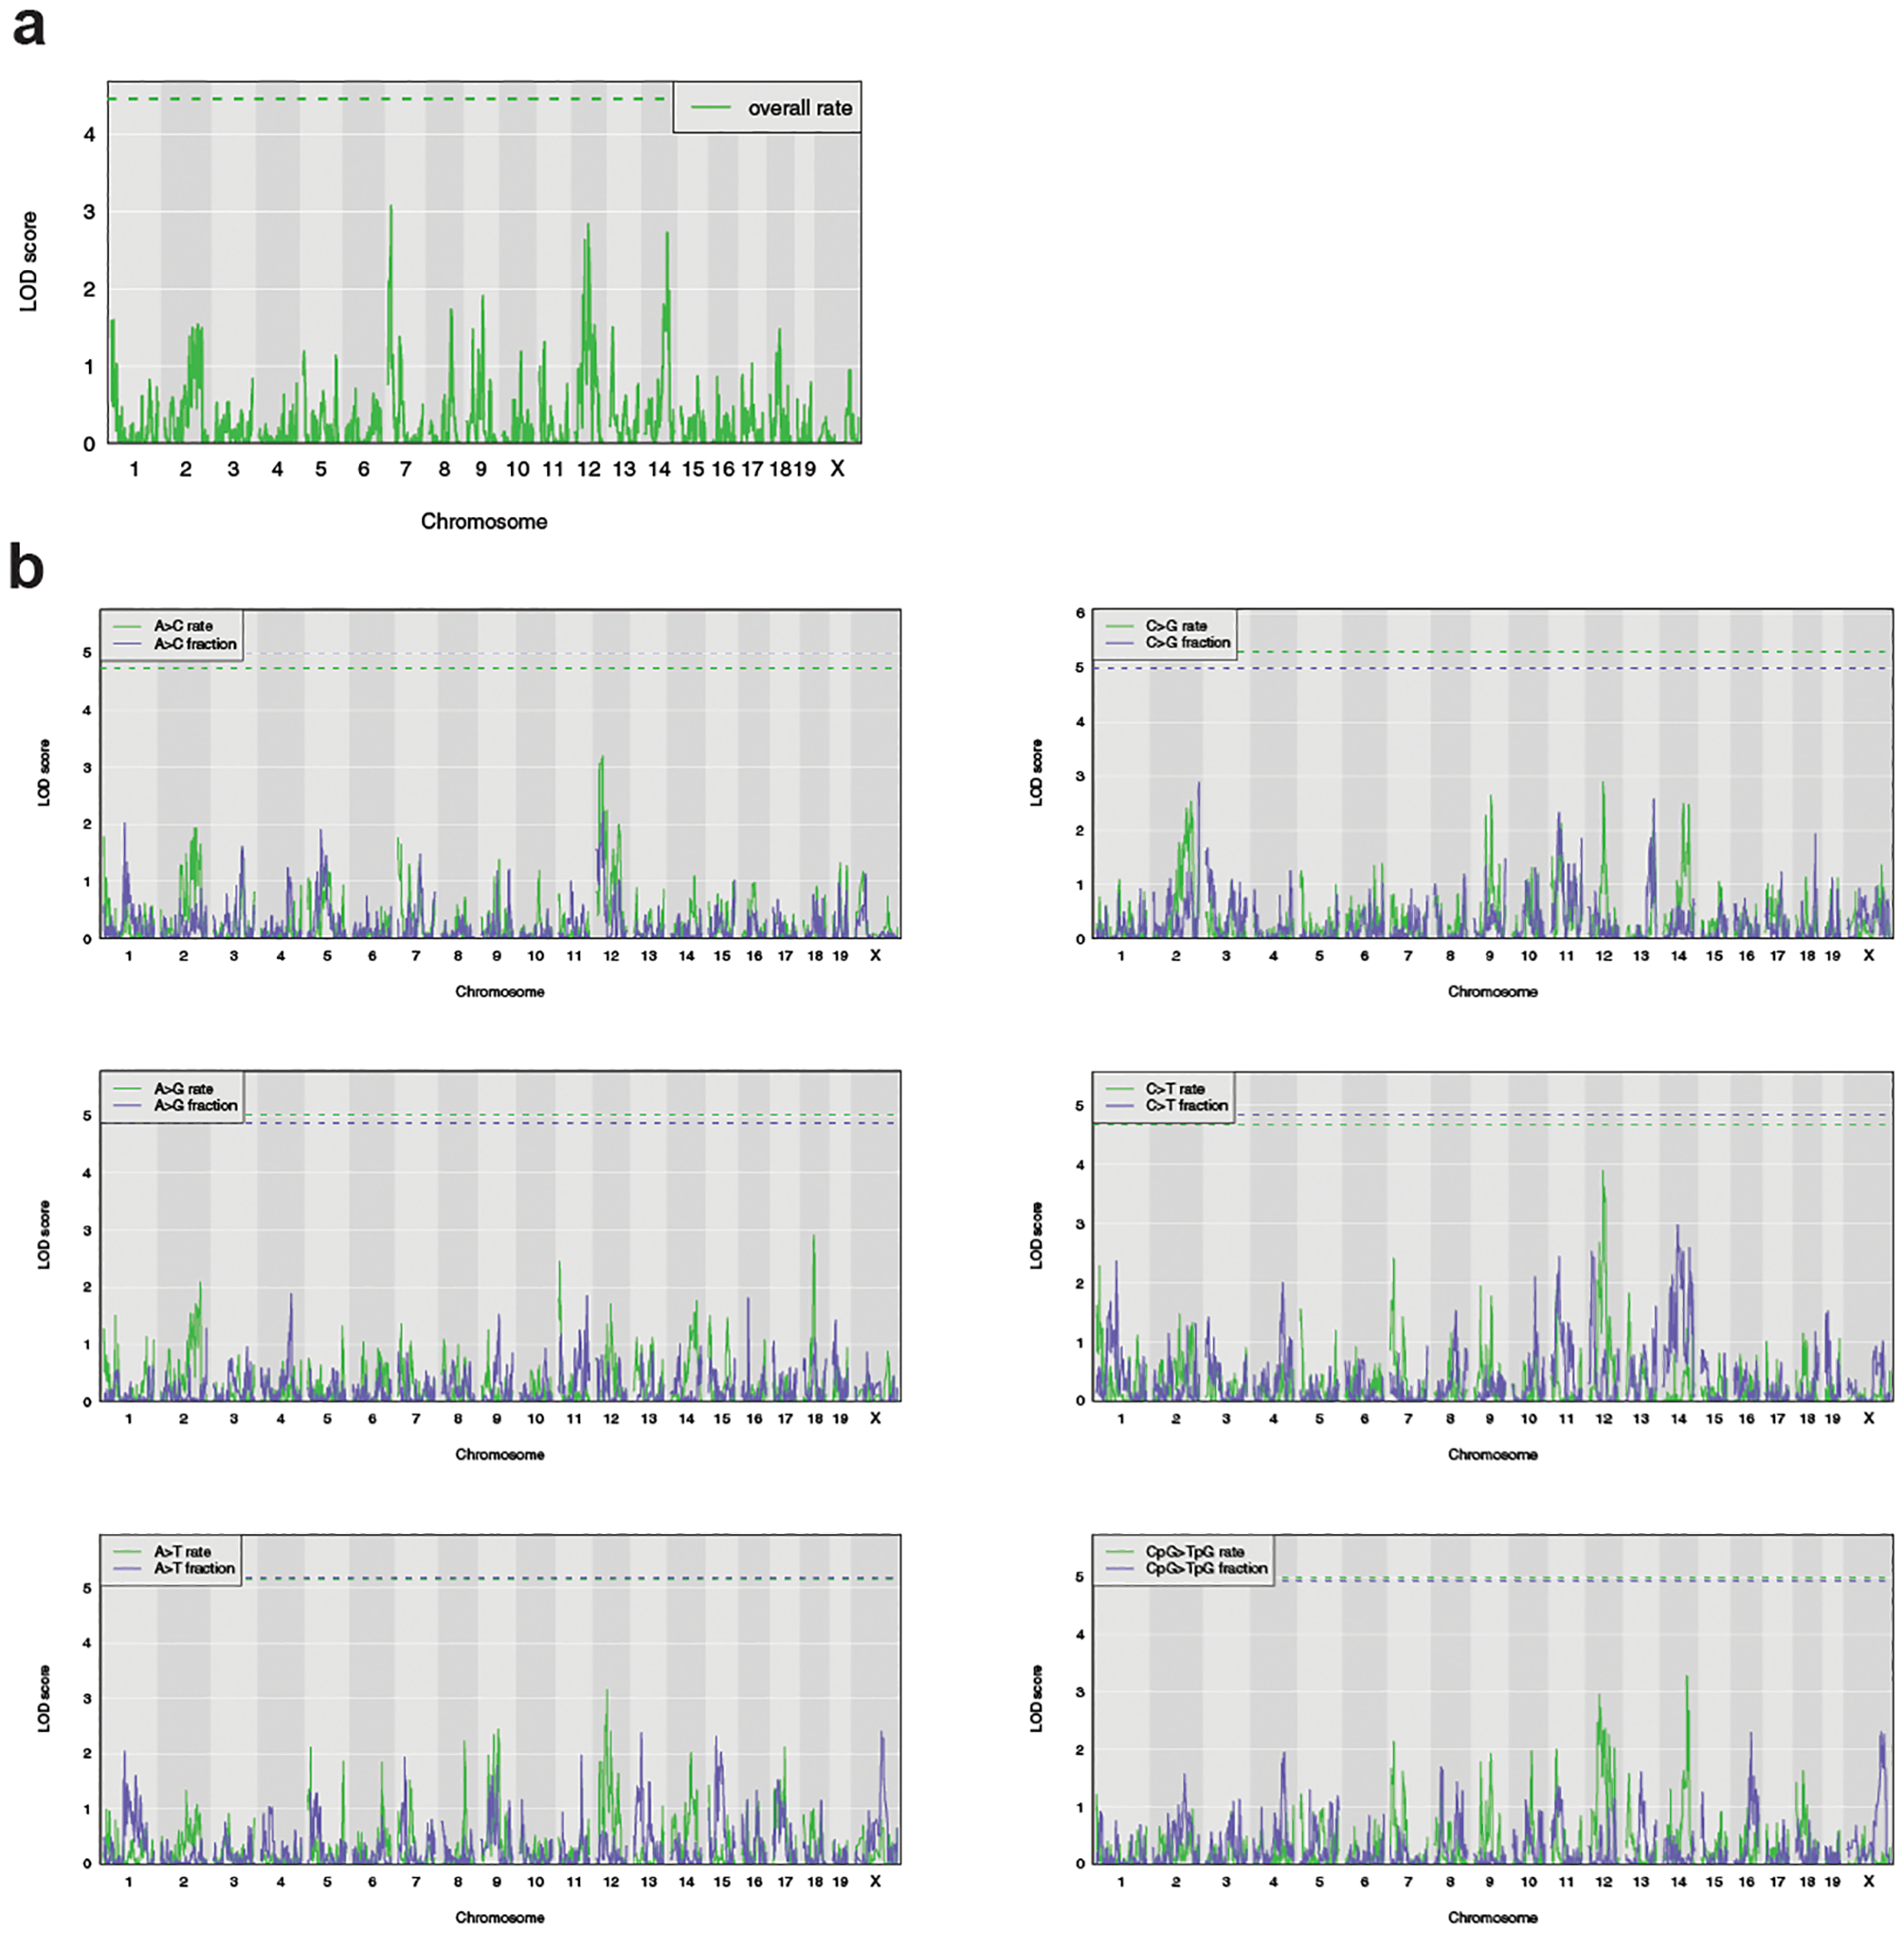
a) Using the same BXD lines and covariates as described in the Online Methods, a QTL scan was performed for the overall mutation rate of each line. The green dashed line indicates the genome-wide significance threshold using 1,000 permutations (Bonferroni-corrected alpha = 0.05/15). b)Using the same BXD lines and covariates as described in the Online Methods, QTL scans were performed for the rates and fractions of all mutation types other than C>A. Green and blue dashed lines indicate the genome-wide significance thresholds for the rate and fraction scans, respectively, using 1,000 permutations (Bonferroni-corrected alpha = 0.05/15).
Extended Data Fig. 5 |. 3-mer mutation sequence contexts enriched in DBA/2J-like Mouse Genomes Project strains.
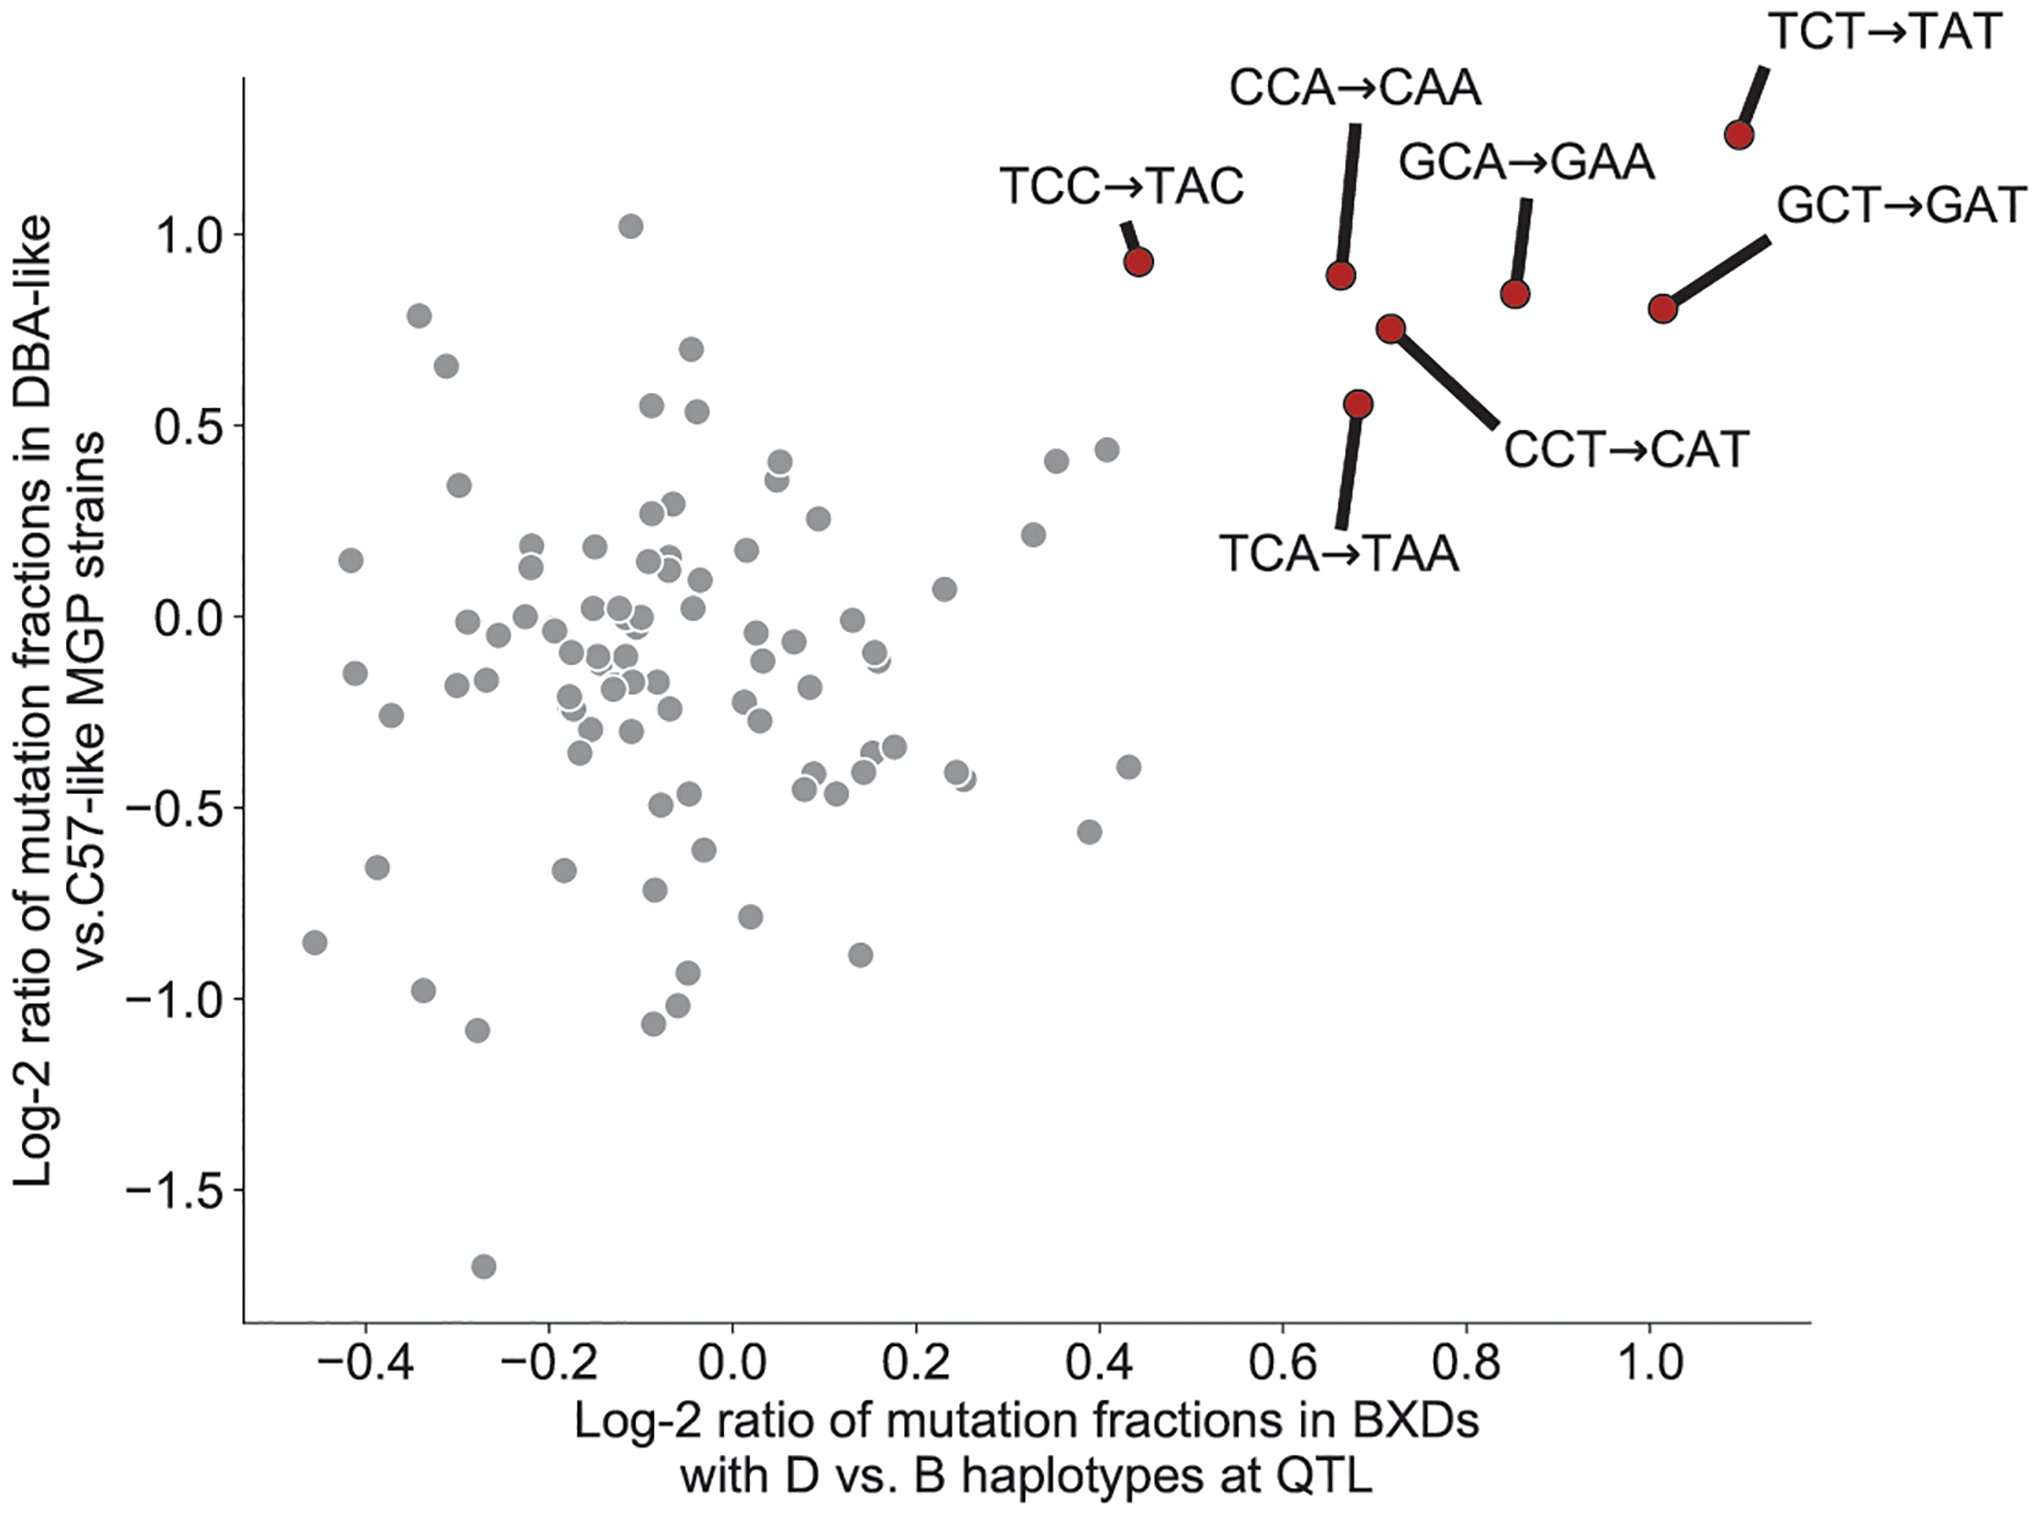
For each mutation type defined by its 3-mer sequence context, we can compute its Log-2 compositional enrichment in BXD strains with D vs. B haplotypes at the QTL on chromosome 4, as well as its log-2 compositional enrichment in Sanger Mouse Genomes Project strains that are D-like vs. B-like. These two odds ratios are correlated, indicating that the same mutational signature is enriched in the BXD D strains and the D-like Sanger MGP strains. Mutation types significantly enriched in BXDs with D haplotypes are colored red, outlined in black and labeled.
Extended Data Fig. 6 |. Site frequency spectra of C>A mutations in the four Mus species/subspecies on chromosome 4.
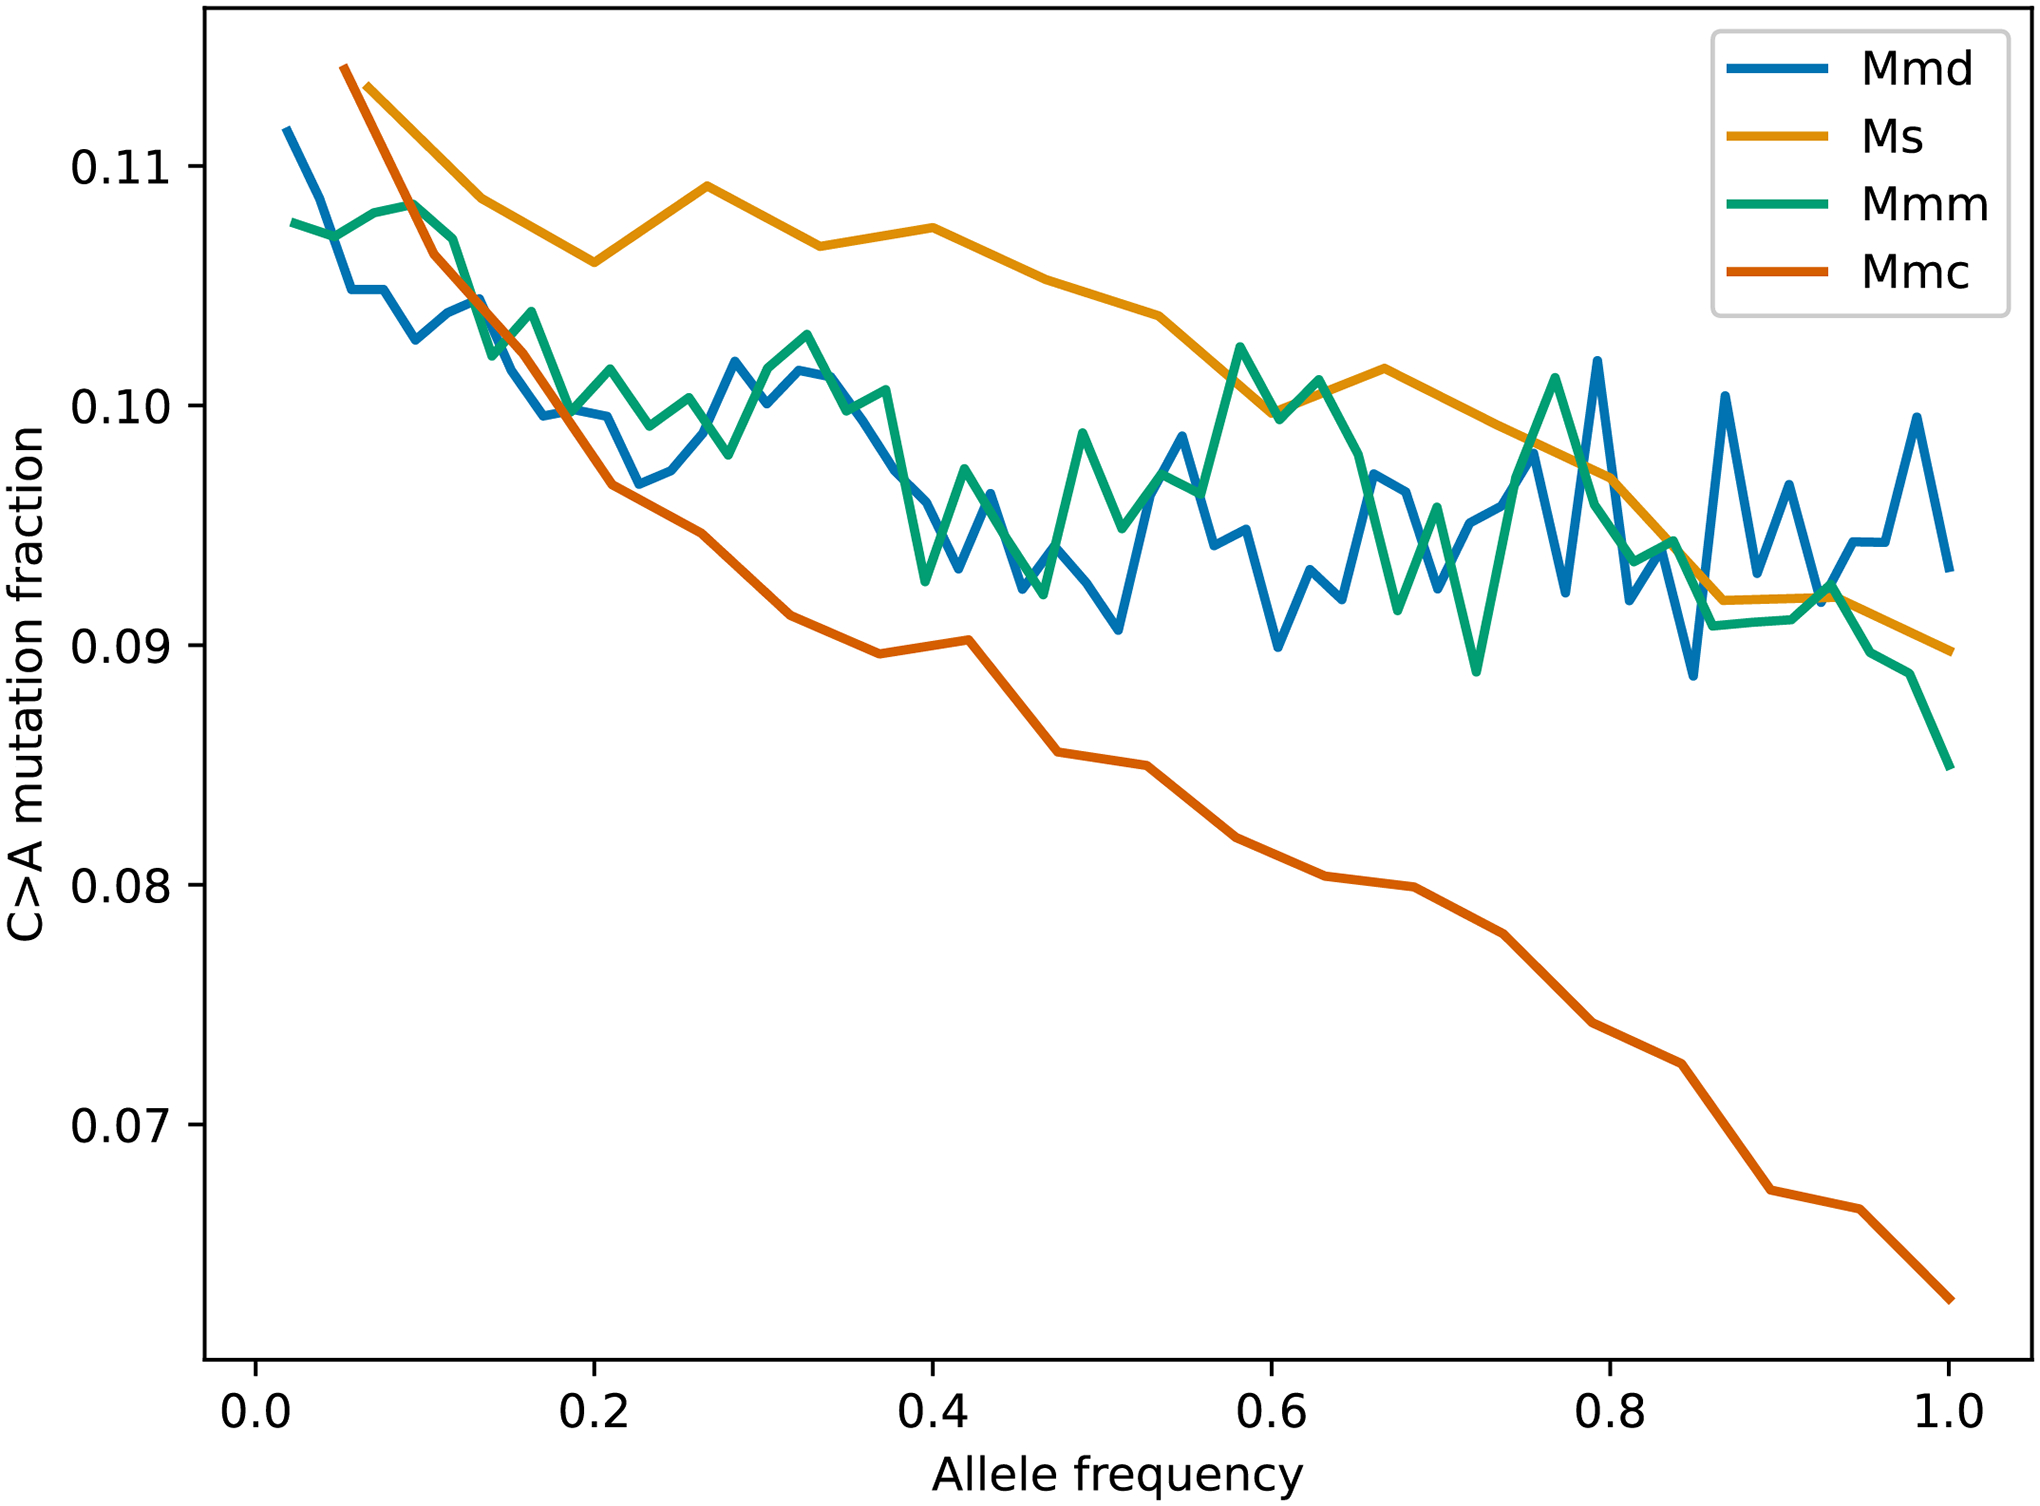
The site frequency spectra of M.m. domesticus, M.m. castaneus, M.m. musculus, and M. spretus were computed using a dataset of publicly available wild mouse genomes and a polarized version of the GRCm38/mm10 reference genome. Mmd is Mus musculus domesticus, Ms is Mus spretus, Mmm is Mus musculus musculus, and Mmc is Mus musculus castaneus.
Extended Data Fig. 7 |. Comparisons of singleton spectra between wild M.m.domesticus and other wild species.
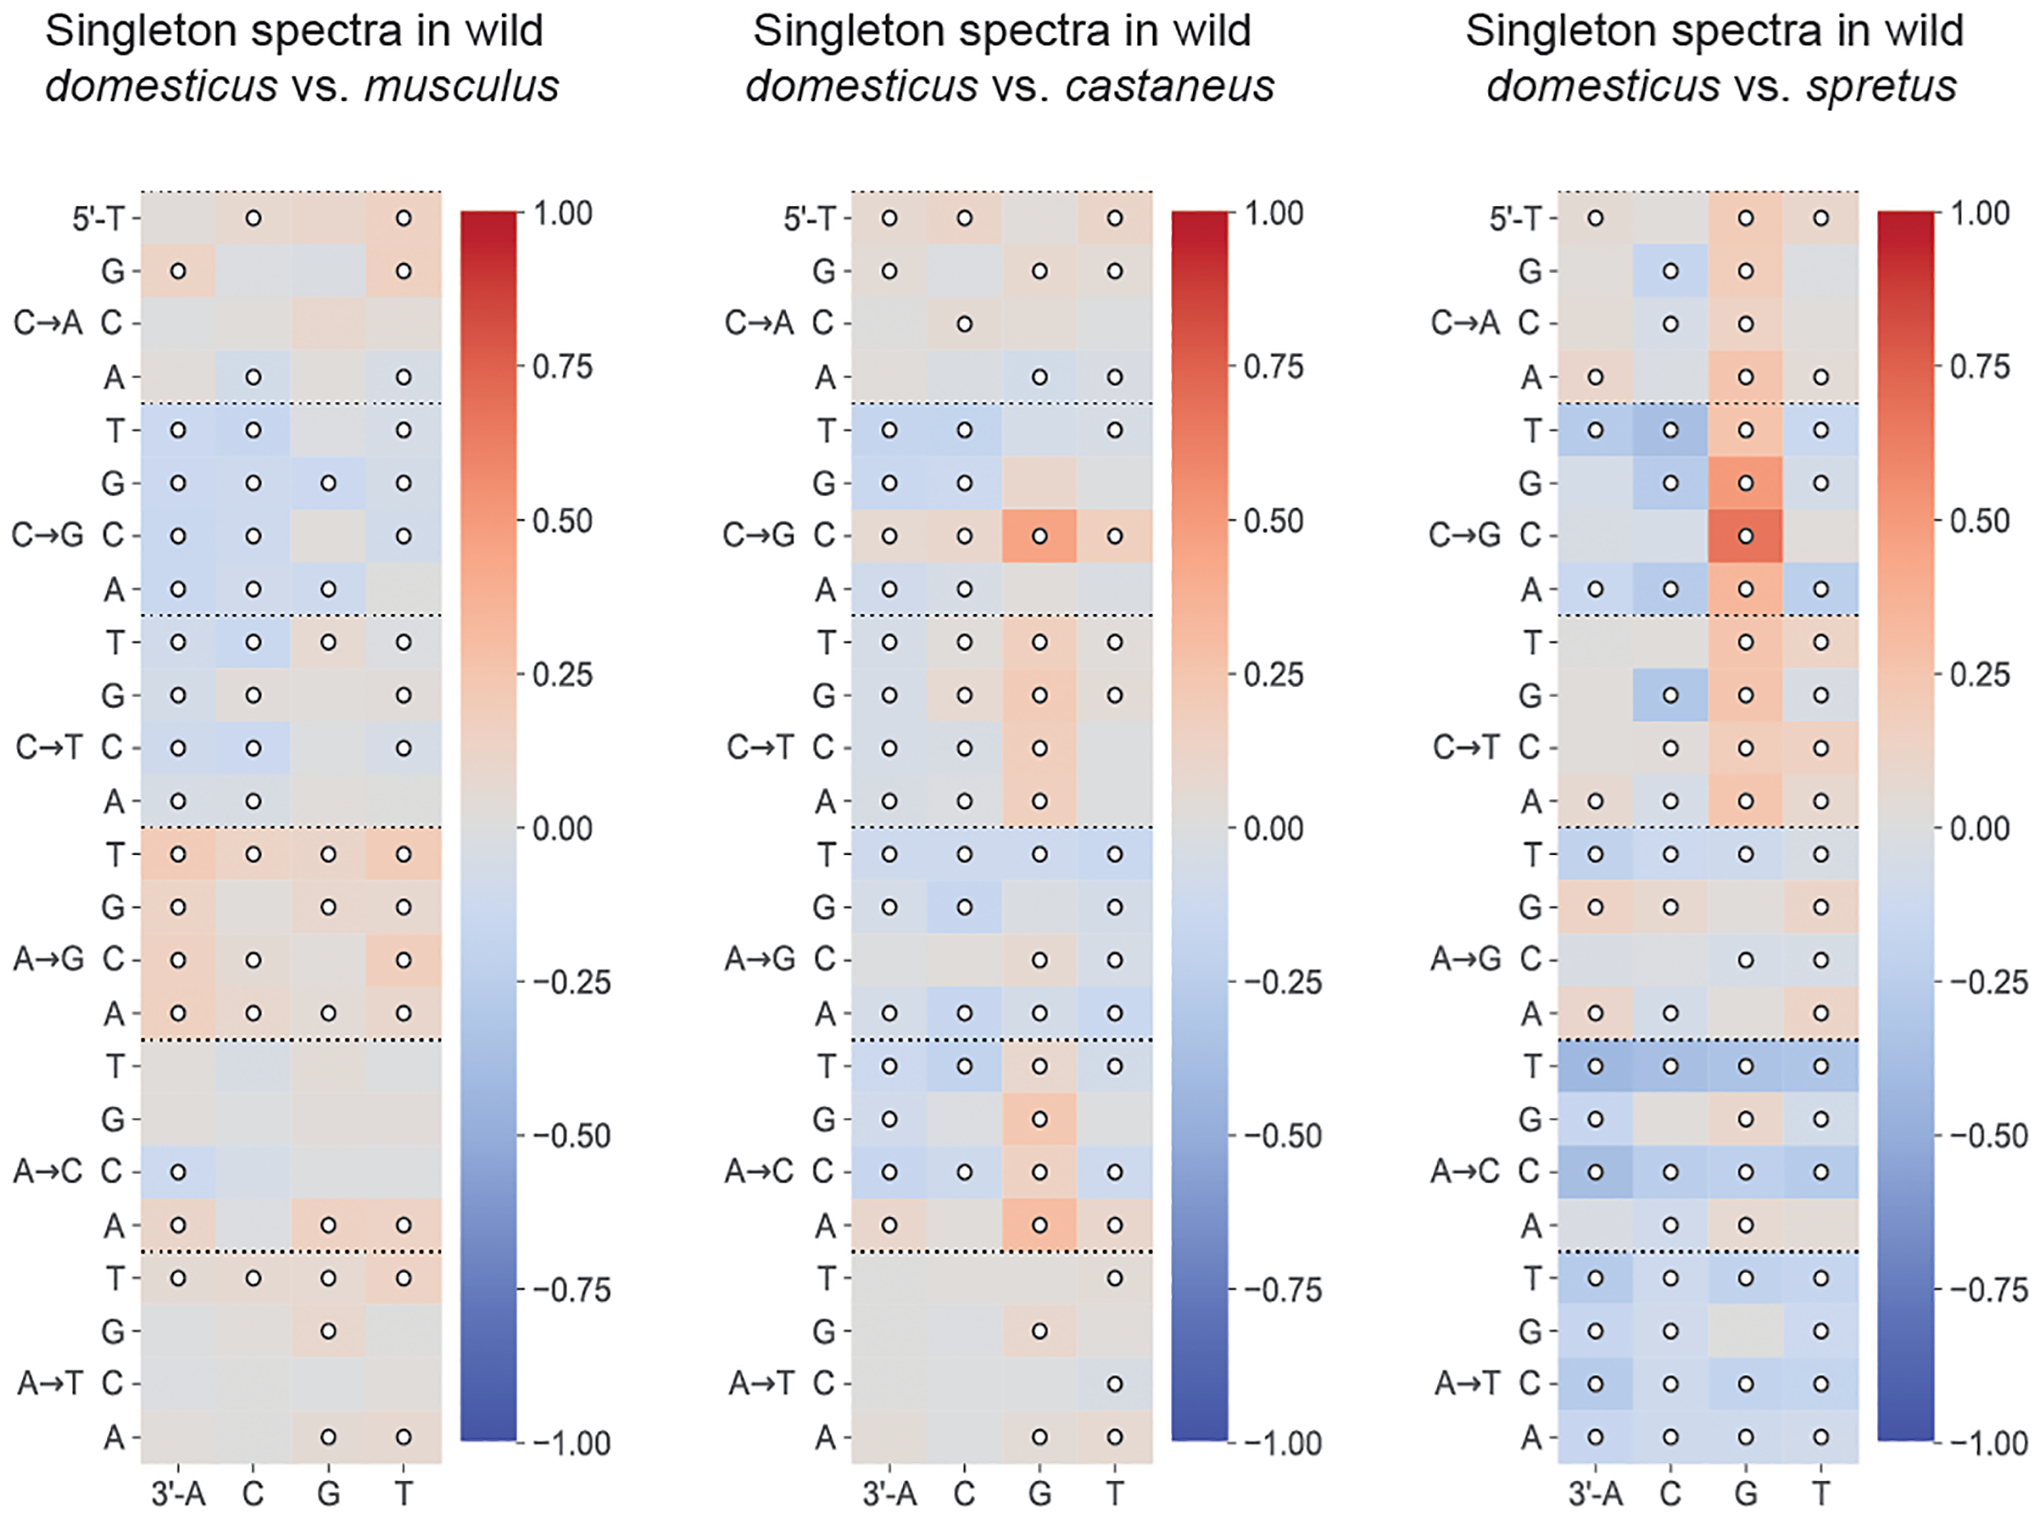
Log-2 ratios of singleton fractions of each 3-mer mutation type in Mus musculus domesticus, compared to three other wild subspecies or species of Mus. Comparisons with Chi-square test of independence p-values < 0.05/96 are annotated with white circles.
Extended Data Fig. 8 |. Comparisons of singleton spectra between wild mouse populations in the genomic neighborhood of Mutyh.
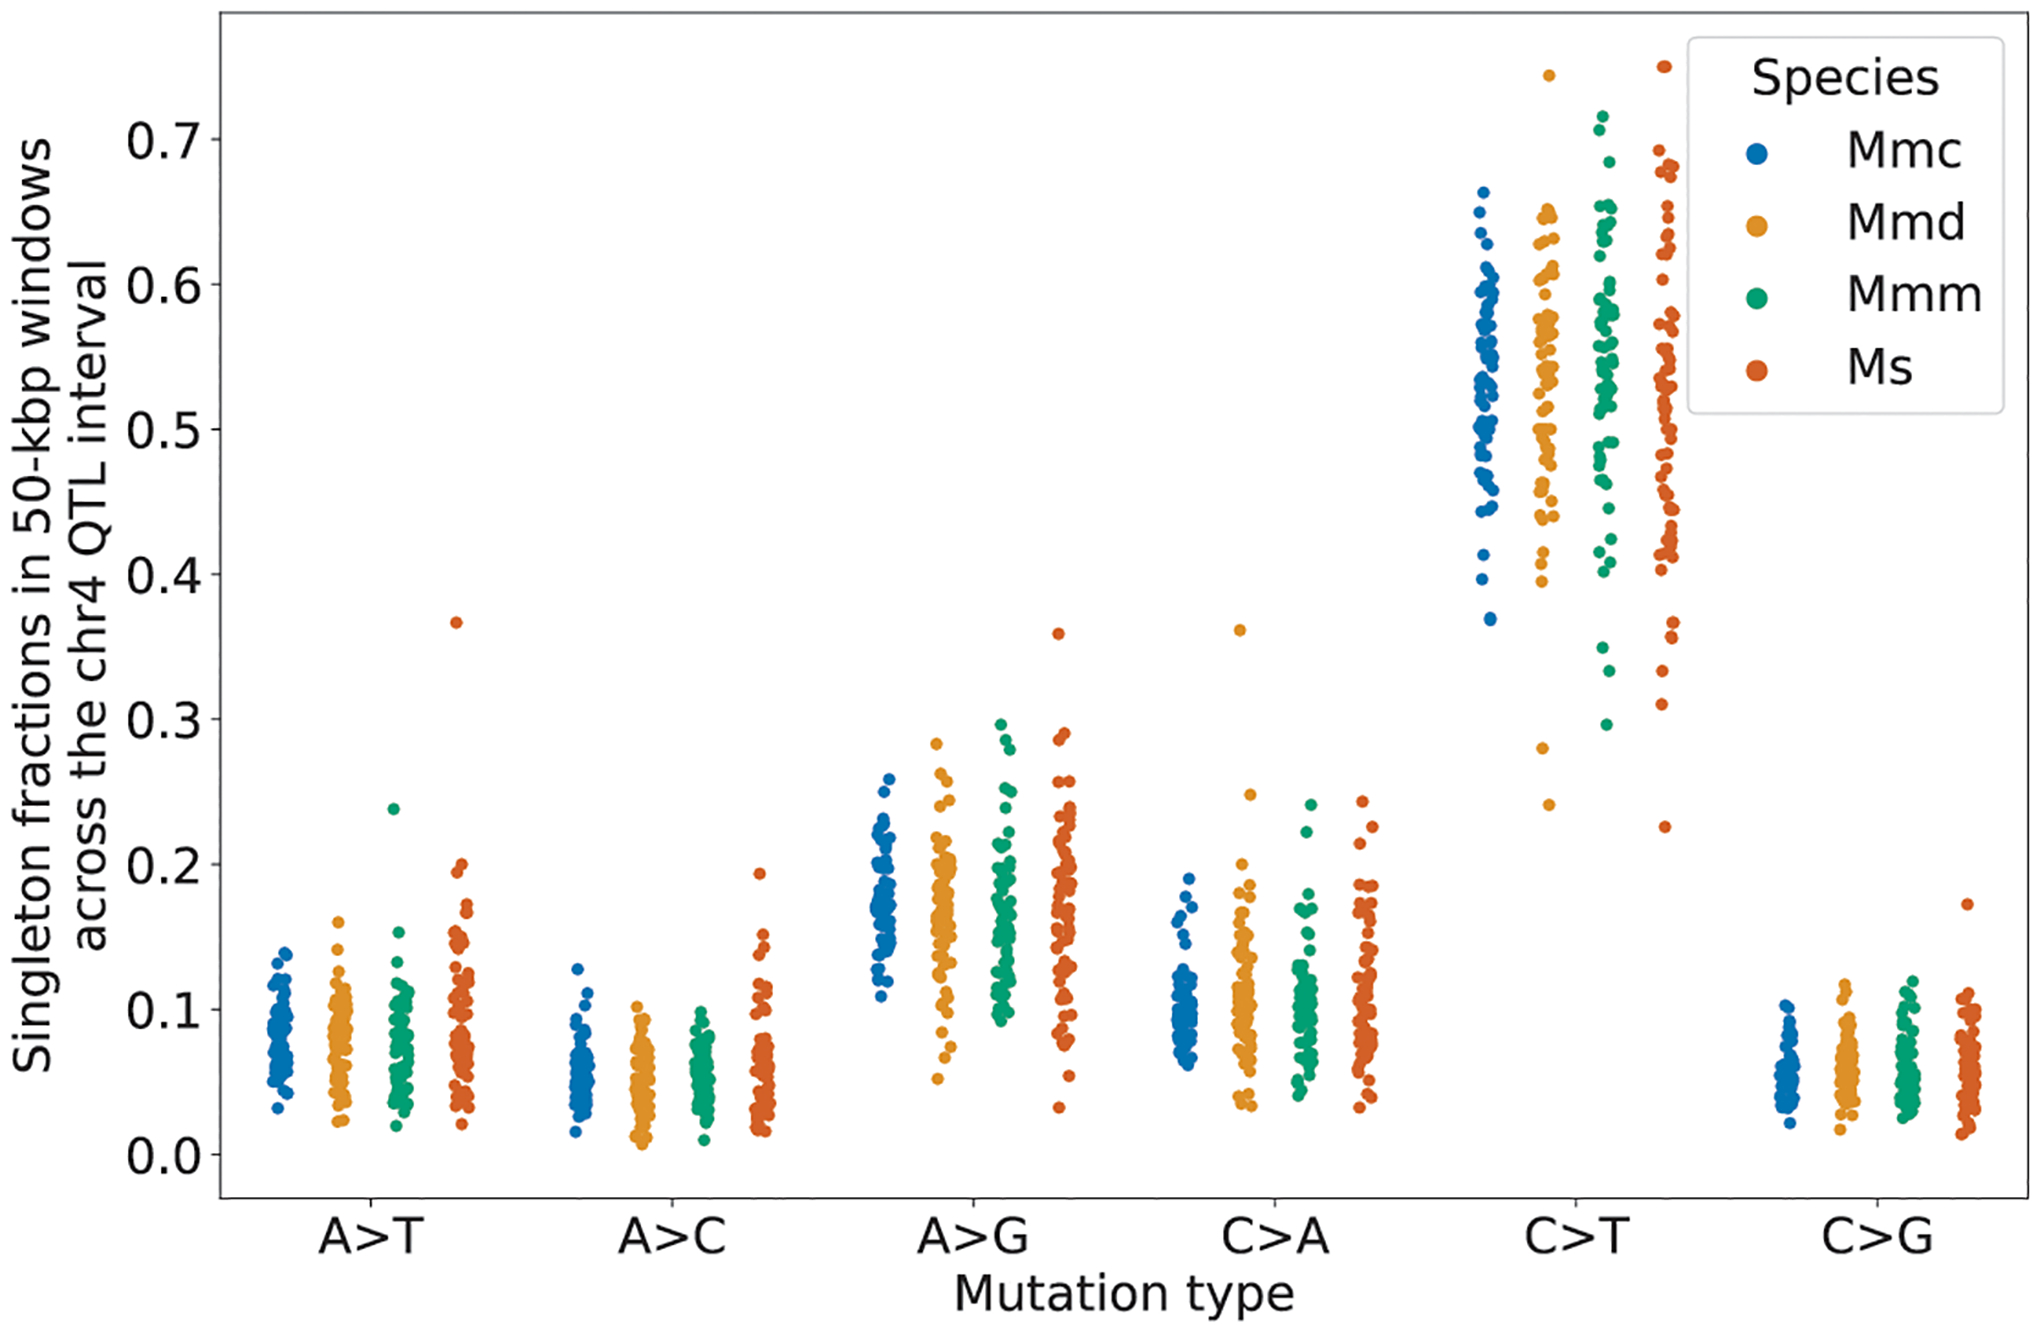
Singleton fractions of each mutation type in each wild species or subspecies were computed in 50-kilobase pair windows in the QTL interval surrounding Mutyh (114.8 Mbp to 118.3 Mbp). The median absolute deviations of C>A fractions in the species or subspecies were: 0.00985 (Mmc), 0.0195 (Mmd), 0.0155 (Mmm), and 0.0214 (Ms).
Extended Data Table 1 |.
Numbers and provenance of BXD lines analyzed in this manuscript
| Epoch | Year founded | Cross strategy | Strains with available whole-genome sequencing data | Strains in this analysis |
|---|---|---|---|---|
| 1 | 1971 | F2 | 25 | 21 |
| 2 | 1990s | F2 | 7 | 7 |
| 3 | late 1990s | Advanced intercross | 49 | 38 |
| 4 | 2008 | F2 | 23 | 16 |
| 5 | 2010 | Advanced intercross | 19 | 12 |
| 6 | 2014 | F2 | 30 | 0 |
| Total | - | - | 153 | 94 |
Extended Data Table 2 |.
Mutyh missense mutations in the BXD family
| Amino acid change relative to transcript ENSMUST00000102699.7 | Genome coordinates (mm10) | Fixed on D haplotypes? |
|---|---|---|
| p.Gln5Arg | chr4:116814338 | Yes |
| p.Arg24Cys | chr4:116814394 | Yes |
| p.Ser69Arg | chr4:116815658 | Yes |
| p.Arg153Gln | chr4:116816476 | No (private to BXD68) |
| p.Thr312Pro | chr4:116817416 | Yes |
| p.Ser313Pro | chr4:116817419 | Yes |
Supplementary Material
Acknowledgements
We thank B. Dumont, M. Gymrek, M. Mortazavi, A. Clark, D. Rothschild, U. Arora, M. Maksimov, H. Chen and J. Sebat for contributing helpful feedback as part of the BXD Genome Sequencing Consortium; M. Przeworski for providing comments on a manuscript draft; Y.-Y. Ren for assistance with preliminary genotype calling; members of the Harris and Pritchard laboratories for additional helpful discussions; the staff of HudsonAlpha—S. Levy and team—for DNA library preparation and sequencing, and for providing us with great support on data transfer; staff at the UT ISAAC facility for storage and processing of all sequence-associated data files; A. Centeno for assisting with the upload of phenotype data to GeneNetwork; C. Lutz and A. Valenzuela and J. Ingels at UTHSC for DNA sample acquisition, handling and assistance. We acknowledge support from NIH T32 Postdoctoral Training Grant 5T32HG000035-25 (to T.A.S.), a University of Tennessee Center for Integrative and Translational Genomics grant (to R.W.W., D.G.A. and L.L.), NIH Biological Mechanisms of Healthy Aging Training Grant T32AG066574 (to A.C.B.), NIH NIDA grant P50DA037844 (to A.A.P.), NIH NIDA grant U01DA051234 (to A.A.P.), NIH NIGMS grant 1R01GM123489 (to R.W.W.), NIH NIDA grant P30 DA044223 (to R.W.W.), NIH R01 HG008140 (to J.K.P.), NIH NIGMS grant 1R35GM133428-01 (to K.H.), a Searle Scholarship (to K.H.), a Sloan Research Fellowship (to K.H.), a Burroughs Wellcome Fund Career Award at the Scientific Interface (to K.H.) and a Pew Biomedical Scholarship (to K.H.).
Footnotes
Code Availability
All code used for data analysis and figure generation is deposited at https://github.com/tomsasani/bxd_mutator_manuscript (archived at Zenodo (https://doi.org/10.5281/zenodo.5941048)).
Competing interests The authors declare no competing interests.
Supplementary information
The online version contains supplementary material available at https://doi.org/10.1038/s41586-022-04701-5.
Data availability
BXD mutations and other data files necessary to reproduce the manuscript are available at https://github.com/tomsasani/bxd_ mutator_manuscript (archived at Zenodo (https://doi.org/10.5281/zenodo.5941048)). A VCF file containing variant calls from the sequenced BXDs is available in the European Nucleotide Archive with project accession PRJEB45429. The germline mutation calls from TOY-KO triple knockout mice24 are available as supplementary data file 1 from https://doi.org/10.1038/srep04689. The SBS18 COSMIC mutation signature data are available at the COSMIC web page: https://cancer.sanger.ac.uk/cosmic/signatures/SBS/SBS18.tt. The strain-private mutation data from Dumont17 are available as supplementary data from the following: https://doi.org/10.1093/molbev/msz026. The wild mouse data from Harr et al.35 are available at https://wwwuser.gwdg. de/~evolbio/evolgen/wildmouse/, as described in the manuscript at https://doi.org/10.1038/sdata.2016.75. The mm10/GRCm38 reference genome used for these analyses is version GCA_000001635.2, and can be obtained at https://hgdownload.soe.ucsc.edu/goldenPath/mm10/bigZips/mm10.fa.gz.
References
- 1.Lynch M et al. Genetic drift, selection and the evolution of the mutation rate. Nat. Rev. Genet 17, 704–714 (2016). [DOI] [PubMed] [Google Scholar]
- 2.Ashbrook DG et al. A platform for experimental precision medicine: the extended BXD mouse family. Cell Syst. 12, 235–247.e9 (2021). [DOI] [PMC free article] [PubMed] [Google Scholar]
- 3.Viel A et al. A specific mutational signature associated with DNA 8-oxoguanine persistence in MUTYH-defective colorectal cancer. eBioMedicine 20, 39–49 (2017). [DOI] [PMC free article] [PubMed] [Google Scholar]
- 4.Pilati C et al. Mutational signature analysis identifies MUTYH deficiency in colorectal cancers and adrenocortical carcinomas. J. Pathol 242, 10–15 (2017). [DOI] [PubMed] [Google Scholar]
- 5.Sniegowski PD, Gerrish PJ & Lenski RE Evolution of high mutation rates in experimental populations of E. coli. Nature 387, 703–705 (1997). [DOI] [PubMed] [Google Scholar]
- 6.Dawson KJ Evolutionarily stable mutation rates. J. Theor. Biol 194, 143–157 (1998). [DOI] [PubMed] [Google Scholar]
- 7.Sasani TA et al. Large, three-generation human families reveal post-zygotic mosaicism and variability in germline mutation accumulation. eLife 8, e46922 (2019). [DOI] [PMC free article] [PubMed] [Google Scholar]
- 8.Rahbari R et al. Timing, rates and spectra of human germline mutation. Nat. Genet 48, 126–133 (2016). [DOI] [PMC free article] [PubMed] [Google Scholar]
- 9.Kessler MD et al. De novo mutations across 1,465 diverse genomes reveal mutational insights and reductions in the Amish founder population. Proc. Natl Acad. Sci. USA 117, 2560–2569 (2020). [DOI] [PMC free article] [PubMed] [Google Scholar]
- 10.Robinson PS et al. Increased somatic mutation burdens in normal human cells due to defective DNA polymerases. Nat. Genet 53, 1434–1442 (2021). [DOI] [PMC free article] [PubMed] [Google Scholar]
- 11.Harris K Evidence for recent, population-specific evolution of the human mutation rate. Proc. Natl Acad. Sci. USA 112, 3439–3444 (2015). [DOI] [PMC free article] [PubMed] [Google Scholar]
- 12.Harris K & Pritchard JK Rapid evolution of the human mutation spectrum. eLife 6, 415 (2017). [DOI] [PMC free article] [PubMed] [Google Scholar]
- 13.Mathieson I & Reich D Differences in the rare variant spectrum among human populations. PLoS Genet. 13, e1006581 (2017). [DOI] [PMC free article] [PubMed] [Google Scholar]
- 14.Jónsson H et al. Parental influence on human germline de novo mutations in 1,548 trios from Iceland. Nature 549, 519–522 (2017). [DOI] [PubMed] [Google Scholar]
- 15.Ségurel L, Wyman MJ & Przeworski M Determinants of mutation rate variation in the human germline. Annu. Rev. Genomics Hum. Genet 15, 47–70 (2014). [DOI] [PubMed] [Google Scholar]
- 16.Halligan DL & Keightley PD Spontaneous mutation accumulation studies in evolutionary genetics. Annu. Rev. Ecol 40, 151–172 (2009). [Google Scholar]
- 17.Dumont BL Significant strain variation in the mutation spectra of inbred laboratory mice. Mol. Biol. Evol 36, 865–874 (2019). [DOI] [PMC free article] [PubMed] [Google Scholar]
- 18.Lindsay SJ, Rahbari R, Kaplanis J, Keane T & Hurles ME Similarities and differences in patterns of germline mutation between mice and humans. Nat. Commun 10, 4053 (2019). [DOI] [PMC free article] [PubMed] [Google Scholar]
- 19.Broman KW et al. R/qtl2: software for mapping quantitative trait loci with high-dimensional data and multiparent populations. Genetics 211, 495–502 (2019). [DOI] [PMC free article] [PubMed] [Google Scholar]
- 20.Cingolani P et al. A program for annotating and predicting the effects of single nucleotide polymorphisms, SnpEff: SNPs in the genome of Drosophila melanogaster strain w1118; iso-2; iso-3. Fly 6, 80–92 (2012). [DOI] [PMC free article] [PubMed] [Google Scholar]
- 21.Gene Ontology Consortium. The Gene Ontology resource: enriching a GOld mine. Nucleic Acids Res. 49, D325–D334 (2021). [DOI] [PMC free article] [PubMed] [Google Scholar]
- 22.Ashburner M et al. Gene ontology: tool for the unification of biology. Nat. Genet 25, 25–29 (2000). [DOI] [PMC free article] [PubMed] [Google Scholar]
- 23.David SS, O’Shea VL & Kundu S Base-excision repair of oxidative DNA damage. Nature 447, 941–950 (2007). [DOI] [PMC free article] [PubMed] [Google Scholar]
- 24.Ohno M et al. 8-oxoguanine causes spontaneous de novo germline mutations in mice. Sci. Rep 4, 4689 (2014). [DOI] [PMC free article] [PubMed] [Google Scholar]
- 25.Alexandrov LB et al. The repertoire of mutational signatures in human cancer. Nature 578, 94–101 (2020). [DOI] [PMC free article] [PubMed] [Google Scholar]
- 26.Georgeson P et al. Evaluating the utility of tumour mutational signatures for identifying hereditary colorectal cancer and polyposis syndrome carriers. Gut 70, 2138–2149 (2021). [DOI] [PMC free article] [PubMed] [Google Scholar]
- 27.Islam SMA et al. Uncovering novel mutational signatures by de novo extraction with SigProfilerExtractor. Preprint at 10.1101/2020.12.13.422570 (2021). [DOI] [PMC free article] [PubMed]
- 28.Mulligan MK, Mozhui K, Prins P & Williams RW GeneNetwork: a toolbox for systems genetics. Methods Mol. Biol 1488, 75–120 (2017). [DOI] [PMC free article] [PubMed] [Google Scholar]
- 29.Keane TM et al. Mouse genomic variation and its effect on phenotypes and gene regulation. Nature 477, 289–294 (2011). [DOI] [PMC free article] [PubMed] [Google Scholar]
- 30.Segovia R, Shen Y, Lujan SA, Jones SJM & Stirling PC Hypermutation signature reveals a slippage and realignment model of translesion synthesis by Rev3 polymerase in cisplatin-treated yeast. Proc. Natl Acad. Sci. USA 114, 2663–2668 (2017). [DOI] [PMC free article] [PubMed] [Google Scholar]
- 31.Landrum MJ et al. ClinVar: improvements to accessing data. Nucleic Acids Res. 48, D835–D844 (2020). [DOI] [PMC free article] [PubMed] [Google Scholar]
- 32.Choi Y & Chan AP PROVEAN web server: a tool to predict the functional effect of amino acid substitutions and indels. Bioinformatics 31, 2745–2747 (2015). [DOI] [PMC free article] [PubMed] [Google Scholar]
- 33.Ng PC & Henikoff S SIFT: Predicting amino acid changes that affect protein function. Nucleic Acids Res. 31, 3812–3814 (2003). [DOI] [PMC free article] [PubMed] [Google Scholar]
- 34.Yang H et al. Subspecific origin and haplotype diversity in the laboratory mouse. Nat. Genet 43, 648–655 (2011). [DOI] [PMC free article] [PubMed] [Google Scholar]
- 35.Harr B et al. Genomic resources for wild populations of the house mouse, Mus musculus and its close relative Mus spretus. Sci. Data 3, 160075 (2016). [DOI] [PMC free article] [PubMed] [Google Scholar]
- 36.Huber CD, Kim BY, Marsden CD & Lohmueller KE Determining the factors driving selective effects of new nonsynonymous mutations. Proc. Natl Acad. Sci. USA 114, 4465–4470 (2017). [DOI] [PMC free article] [PubMed] [Google Scholar]
- 37.Geraldes A et al. Inferring the history of speciation in house mice from autosomal, X-linked, Y-linked and mitochondrial genes. Mol. Ecol 17, 5349–5363 (2008). [DOI] [PMC free article] [PubMed] [Google Scholar]
- 38.Phifer-Rixey M et al. Adaptive evolution and effective population size in wild house mice. Mol. Biol. Evol 29, 2949–2955 (2012). [DOI] [PMC free article] [PubMed] [Google Scholar]
- 39.Gou L, Bloom JS & Kruglyak L The genetic basis of mutation rate variation in yeast. Genetics 211, 731–740 (2019). [DOI] [PMC free article] [PubMed] [Google Scholar]
- 40.Jiang P et al. A modified fluctuation assay reveals a natural mutator phenotype that drives mutation spectrum variation within Saccharomyces cerevisiae. Evol. Biol. Genet. Genomics 10, e68285 (2021). [DOI] [PMC free article] [PubMed] [Google Scholar]
- 41.Robinson PS et al. Inherited MUTYH mutations cause elevated somatic mutation rates and distinctive mutational signatures in normal human cells. Preprint at 10.1101/2021.10.20.465093 (2021). [DOI] [PMC free article] [PubMed]
- 42.Goldberg ME & Harris K Mutational signatures of replication timing and epigenetic modification persist through the global divergence of mutation spectra across the great ape phylogeny. Genome Biol. Evol 14, evab104 (2021). [DOI] [PMC free article] [PubMed] [Google Scholar]
- 43.Köster J & Rahmann S Snakemake—a scalable bioinformatics workflow engine. Bioinformatics 28, 2520–2522 (2012). [DOI] [PubMed] [Google Scholar]
- 44.DePristo MA et al. A framework for variation discovery and genotyping using next-generation DNA sequencing data. Nat. Genet 43, 491–498 (2011). [DOI] [PMC free article] [PubMed] [Google Scholar]
- 45.Wang X et al. High-throughput sequencing of the DBA/2J mouse genome. BMC Bioinf. 11, O7 (2010). [Google Scholar]
- 46.Pedersen BS & Quinlan AR cyvcf2: fast, flexible variant analysis with Python. Bioinformatics 33, 1867–1869 (2017). [DOI] [PMC free article] [PubMed] [Google Scholar]
- 47.DeWitt WS mutyper: assigning and summarizing mutation types for analyzing germline mutation spectra. Preprint at 10.1101/2020.07.01.183392 (2020). [DOI]
- 48.Neph S et al. BEDOPS: high-performance genomic feature operations. Bioinformatics 28, 1919–1920 (2012). [DOI] [PMC free article] [PubMed] [Google Scholar]
- 49.Papadopoulos JS & Agarwala R COBALT: constraint-based alignment tool for multiple protein sequences. Bioinformatics 23, 1073–1079 (2007). [DOI] [PubMed] [Google Scholar]
- 50.Suyama M, Torrents D & Bork P PAL2NAL: robust conversion of protein sequence alignments into the corresponding codon alignments. Nucleic Acids Res. 34, W609–W612 (2006). [DOI] [PMC free article] [PubMed] [Google Scholar]
- 51.Huerta-Cepas J, Serra F & Bork P ETE 3: reconstruction, analysis, and visualization of phylogenomic data. Mol. Biol. Evol 33, 1635–1638 (2016). [DOI] [PMC free article] [PubMed] [Google Scholar]
- 52.Cock PJA et al. Biopython: freely available Python tools for computational molecular biology and bioinformatics. Bioinformatics 25, 1422–1423 (2009). [DOI] [PMC free article] [PubMed] [Google Scholar]
Associated Data
This section collects any data citations, data availability statements, or supplementary materials included in this article.
Supplementary Materials
Data Availability Statement
BXD mutations and other data files necessary to reproduce the manuscript are available at https://github.com/tomsasani/bxd_ mutator_manuscript (archived at Zenodo (https://doi.org/10.5281/zenodo.5941048)). A VCF file containing variant calls from the sequenced BXDs is available in the European Nucleotide Archive with project accession PRJEB45429. The germline mutation calls from TOY-KO triple knockout mice24 are available as supplementary data file 1 from https://doi.org/10.1038/srep04689. The SBS18 COSMIC mutation signature data are available at the COSMIC web page: https://cancer.sanger.ac.uk/cosmic/signatures/SBS/SBS18.tt. The strain-private mutation data from Dumont17 are available as supplementary data from the following: https://doi.org/10.1093/molbev/msz026. The wild mouse data from Harr et al.35 are available at https://wwwuser.gwdg. de/~evolbio/evolgen/wildmouse/, as described in the manuscript at https://doi.org/10.1038/sdata.2016.75. The mm10/GRCm38 reference genome used for these analyses is version GCA_000001635.2, and can be obtained at https://hgdownload.soe.ucsc.edu/goldenPath/mm10/bigZips/mm10.fa.gz.


