

Abstract
Changes in mitochondrial size and shape have been implicated in several physiologic processes, but their role in mitochondrial Ca2+ uptake regulation and overall cellular Ca2+ homeostasis is largely unknown. Here we show that modulating mitochondrial dynamics toward increased fusion through expression of a dominant negative (DN) form of the fission protein [dynamin‐related protein 1 (DRP1)] markedly increased both mitochondrial Ca2+ retention capacity and Ca2+ uptake rates in permeabilized C2C12 cells. Similar results were seen using the pharmacological fusion‐promoting M1 molecule. Conversely, promoting a fission phenotype through the knockdown of the fusion protein mitofusin (MFN)‐2 strongly reduced the mitochondrial Ca2+ uptake speed and capacity in these cells. These changes were not dependent on modifications in mitochondrial calcium uniporter expression, inner membrane potentials, or the mitochondrial permeability transition. Implications of mitochondrial morphology modulation on cellular calcium homeostasis were measured in intact cells; mitochondrial fission promoted lower basal cellular calcium levels and lower endoplasmic reticulum (ER) calcium stores, as indicated by depletion with thapsigargin. Indeed, mitochondrial fission was associated with ER stress. Additionally, the calcium‐replenishing process of store‐operated calcium entry was impaired in MFN2 knockdown cells, whereas DRP1‐DN‐promoted fusion resulted in faster cytosolic Ca2+ increase rates. Overall, our results show a novel role for mitochondrial morphology in the regulation of mitochondrial Ca2+ uptake, which impacts cellular Ca2+ homeostasis.—Kowaltowski, A. J., Menezes‐Filho, S. L., Assali, E. A., Gonçalves, I. G., Cabral‐Costa, J. V., Abreu, P., Miller, N., Nolasco, P., Laurindo, F. R. M., Bruni‐Cardoso, A., Shirihai, O. Mitochondrial morphology regulates organellar Ca2+ uptake and changes cellular Ca2+ homeostasis. FASEB J. 33, 13176–13188 (2019). www.fasebj.org
Keywords: mitochondria, calcium, ER stress, metabolism, bioenergetics
ABBREVIATIONS
- ΔΨ
inner mitochondrial membrane potential
- BSA
bovine serum albumin
- CsA
cyclosporin A
- DN
dominant negative
- DRP1
dynamin‐related protein 1
- ER
endoplasmic reticulum
- FBS
fetal bovine serum
- HEPES
4‐(2‐hydroxyethyl)‐1‐piperazineethanesulfonic acid
- KD
kinase dead
- MCU
mitochondrial calcium uniporter
- MFN
mitofusin
- RR
ruthenium red
- SOCE
store‐operated calcium entry
- TBST
Tris‐buffered saline, 0.1% Tween 20
Recent advances in imaging techniques have allowed for detailed studies of mitochondrial morphology and their dynamic changes in live cells. Mitochondria not only vary in size and shape in different cell types but also rapidly remodel their morphology in response to environmental changes like nutrient availability (1–5). Interestingly, changes in mitochondrial morphology occur not only in response to metabolic cues but also reciprocally regulate cellular metabolic responses (4). Dynamic changes in mitochondrial morphology additionally regulate organelle turnover, the maintenance of a healthy mitochondrial pool, and the interaction between mitochondria and other organelles such as the endoplasmic reticulum (ER) and lipid droplets (5–9).
The core proteins responsible for modulation of mitochondrial morphology include mitofusin (MFN)‐1 and MFN2, outer membrane dynamin‐related GTPases that form complexes between neighboring mitochondria and mediate outer membrane fusion. This process is followed by inner membrane fusion mediated by optic atrophy 1, a GTPase also involved in cristae remodeling (5). MFN2 also plays a key role in Ca2+ signaling by mediating the interaction between mitochondria and the ER (10) and regulating mitophagy (11). Increased MFN‐mediated mitochondrial fusion is often associated with enhanced bioenergetic efficiency (4, 12). Mitochondrial fission, on the other hand, is often associated with low bioenergetic efficiency and is controlled by the cytosolic dynamin‐related protein 1 (DRP1), which assembles as oligomers around the fission site. GTP hydrolysis and DRP1 superstructure constriction then promote mitochondrial fragmentation (5). Interestingly, the location of mitochondrial outer membrane constriction is determined by ER‐mitochondrial contact sites (13). Recent findings also suggest that inner mitochondrial membrane fission occurs at ER‐mitochondrial contact sites in response to enhanced mitochondrial Ca2+ uptake from ER stores, independently of DRP1 (14, 15).
ER‐mitochondrial interactions are important not only for the regulation of mitochondrial morphology but also for the regulation of intracellular Ca2+ signals (5, 16–18). Intracellular and intramitochondrial Ca2+, on the other hand, are central metabolic regulators that affect the activity of both cytosolic and mitochondrial metabolic pathways (19–21). Although the close interaction between the ER and mitochondria is important for adequate signaling, recent studies have shown that ER‐mitochondrial interactions increase excessively in high‐fat diets, resulting in mitochondrial Ca2+ overload and dysfunction. Disrupting these interactions can increase animal health despite their diet, demonstrating the importance of mitochondrial Ca2+ in metabolic control (22, 23).
Ca2+ uptake into the mitochondrial matrix occurs through a mitochondrial calcium uniporter (MCU) and is driven by the inner mitochondrial membrane potential (ΔΨ), which attracts positively charged species (24). Mitochondria take up Ca2+ with very high capacity, allowing for the accumulation of large quantities of the ion, although with low affinity relative to the ER. Within mitochondria, Ca2+ ions act as regulators of important metabolic pathways, determining ATP synthesis rates (19–21). Excessive mitochondrial Ca2+ uptake, however, is disruptive for cell integrity under a number of pathologic conditions, including stroke, ischemic heart disease, and inflammatory liver conditions (23, 25–28). Under these conditions, dysfunction is associated with the mitochondrial permeability transition, a loss of inner mitochondrial membrane impermeability promoted by Ca2+ overload, oxidative imbalance, and protein misfolding (21, 29, 30).
We have recently found that mitochondria isolated from animals maintained ona chronic calorically restricted diet present increased Ca2+ accumulation capacity and resistance against mitochondrial permeability transition (31, 32), whereas acute unfed periods promote increased susceptibility to permeability transition and reduced Ca2+ accumulation capacity (33). This further supports the notion that dietary interventions may not only affect physiologic Ca2+ handling but also modulate damaging effects of supraphysiologic Ca2+ accumulation. Interestingly, caloric restriction and nutrient starvation also modulate mitochondrial morphology, thus stimulating mitochon‐drial fusion (34–36), whereas nutrient overload is often associated with mitochondrial fission (4, 37, 38).
Altogether, a wealth of evidence supports links between nutritional status, mitochondrial morphology and dynamics, Ca2+ signaling, and bioenergetic efficiency. However, a specific and central point that has not been studied is whether changes in mitochondrial morphology directly promote changes in mitochondrial Ca2+ uptake that impact intracellular Ca2+ signaling. Here we show that modifying mitochondrial morphology alters Ca2+ uptake rates and capacity, with larger mitochondria exhibiting faster and larger Ca2+ uptake. We also found that mitochondrial morphology regulates the cellular calcium‐replenishing process of store‐operated calcium entry (SOCE). Our results uncover a novel role for mitochondrial morphology in the control of mitochondrial Ca2+ uptake, which impacts cellular Ca2+ homeostasis.
MATERIALS AND METHODS
Cell cultures
C2C12 cells (passages 6–21) were cultured in high‐glucose DMEM with 10% fetal bovine serum, 1 mM pyruvate, 100 U/ml penicillin, and 1000 μg/ml streptomycin and were trypsinized every 2–3 d and typically split 1:7.
Modulation of mitochondrial morphology
Mitochondrial fusion was promoted by infection with an adenovirus containing a dominant negative (DN) form of DRP1 (DRP1 DN; Welgen, Worcester, MA, USA) at a multiplicity of infection level of 200. Mitochondrial fission was promoted by MFN2 silencing using an adenovirus from Welgen at a multiplicity of infection of 20. Cells were treated when split, and the medium was changed after 24 h. Experiments were conducted 72 h after, when infection rates were maximized (12). Cell viability was assessed by Trypan blue exclusion (MilliporeSigma, Burlington, MA, USA), and >95% for all experiments conducted.
Analysis of mitochondrial morphology
Cells were plated on glass‐bottomed plates 72 h prior to imaging and loaded with Mitotracker Green (Thermo Fisher Scientific, Waltham, MA, USA) (200 nM) for 30 min followed by washout just prior to the experiment. A Zeiss LSM 880 confocal microscope in Airyscan mode was used for superresolution imaging, with a 488 nm Argon laser and Zeiss × 63/1.4 numerical aperture oil immersion objective (Carl Zeiss, Oberkochen, Germany). At least 10 images per experimental condition were collected. Cells were individualized as areas of interest using ImageJ (National Institutes of Health, Bethesda, MD, USA), and automated mitochon‐drial circularity and aspect ratios (the proportional relationship between width and height) were measured. Data are presented as symbols that represent average circularity and aspect ratio per cell. Mitochondrial fission is expected to increase circularity and decrease the aspect ratio. Representative images shown were adjusted in brightness and contrast for better visualization.
Digitonin‐permeabilized cells
Cells were trypsinized, washed, and suspended in 200 μl of 140 mM NaCl, 3 mM KCl, 400 μM KH2PO4, 20 mM 4‐(2‐hydroxyethyl)‐1‐piperazineethanesulfonic acid (HEPES), 5 mM NaHPO4, 5 mM glucose, and 1 mM MgCl2, pH 7 (NaOH). They were counted and kept in this medium at room temperature for, at most, 90 min while experiments were conducted, and then they were resuspended in permeabilized cell medium just prior to each trace. Ideal cell quantities and digitonin titers were determined by following plasma membrane permeabüization using safranin (39) and were found to be 2.5 · 106/ml cells in the presence of 0.0025% digitonin (added just prior to the trace). Under these conditions, cells were safranin‐permeant (indicating plasma membrane permeabilization) and maintained inner membrane potentials for 40 min (indicating mitochondrial membrane integrity).
Mitochondrial Ca2+ uptake
Extramitochondrial Ca2+ uptake was followed in digitonin‐permeabilized cells using the florescent calcium probe Ca2+ Green (Thermo Fisher Scientific) (100 nM; 31, 40) in medium containing 125 mM KCl, 2 mM KH2PO4, 10 mM HEPES, 1 mM MgCl2, 5 mM succinate, 5 mM malate, and 5 mM glutamate, with pH 7 (KOH). Fluorescence was measured with constant stirring, in a cuvette fluorimeter at 506 nm excitation and 532 nm emission. Where indicated in the figures, successive additions of 50 μM CaCl2 were made until Ca2+ accumulation capacity was exhausted, as indicated by lack of further uptake and release. A calibration curve was constructed using known CaCl2 concentrations, and maximal calcium uptake capacity and initial uptake rates were calculated for each trace. Where indicated, 1 μM cyclosporin A (CsA), a mitochondrial permeability transition inhibitor, or 1 μM ruthenium red (RR), an MCU inhibitor, were present. Cells were treated either with 10 μM M1 or equivalent volumes of DMSO (control group) in the culture medium 16 h prior to membrane permeabilization and Ca2+ uptake measurements.
Western blotting
Approximately 100 · 103 (in control and DRP1 DN groups) or 125 · 103 [in MFN2 kinase dead (KD) group] cells were seeded on P100 plates and treated as previously described to modulate mitochondrial morphology. Cells were washed with PBS, quickly frozen in dry ice, and lysed in RIPA buffer containing protease and phosphatase inhibitors. This extract was centrifuged at 1000 g for 10 min at 4°C, and the supernatant wascollected andstoredat –20°C. Protein concentration was determined using the BCA Protein Assay Kit (Thermo Fisher Scientific, Waltham, MA, USA), and extracts were diluted in sample buffer at a final concentration of 1.25 μg/μl. Samples (20 μg) were resolved by SDS‐PAGE in 10% polyacrylamide gels, transferred onto nitrocellulose membranes, and blocked by 5% bovine serum albumin (BSA) in Tris‐buffered saline, 0.1% Tween 20 (TBST) buffer. Primary antibodies were incubated for 1 h at room temperature (anti‐β‐actin, ab8226; Abcam, Cambridge, MA, USA, 1:10,000 1% BSA in TBST) or overnight at 4°C (anti‐MCU, 14997, 1:1000 1% BSA in TBST; Cell Signaling Technology, Danvers, MA, USA). Secondary antibodies were in incubated for 2 h at room temperature [anti‐rabbit, IRDye 680RD (926–68071) and anti‐Mouse IRDye 800CW (925–32210), 1:20,000 1% BSA in TBST], and imaged with near‐infrared detection by Odyssey (Li‐Cor Biosciences, Lincoln, NE, USA). Signals were quantified by densitometry using Fiji/ImageJ. All bands were normalized to the respective β‐actin sample values.
Mitochondrial membrane potentials
Inner mitochondrial membrane potenials (ΔΨ) were determined in permeabilized cells by following the fluorescence of 5 μM safranin O at 485‐nm excitation and 586‐nm emission. For ideal digitonin permeabilization determination, the same medium as Ca2+ uptake measurements was used, and the digitonin concentration that promoted permeabilization (seen as a low, stable fluorescence) in <5 min and sustained for at least 40 min, was used. For ΔΨ quantification, medium devoid of K+ was prepared (all K+ salts were substituted for Na+, except KCl, which was substituted by 250 mM sucrose). Fluorescence was related to known ΔΨs by adding 50 nM valinomycin and known KCl concentrations, allowing ΔΨ to be calculated using the Nernst equation. A calibration curve was constructed relating ΔΨ and fluorescence and extrapolated for basal fluorescence measured in the absence of added KCl (39).
Ca2+ uptake in permeabilized cells with clamped ΔΨ
Cells were incubated in the same medium used for ΔΨ quantification, with 50 nM valinomycin plus 0.41 mM KCl, which was sufficient to reach the same ΔΨ as found in MFN2 KD cells. Ca2+ uptake was measured as described. Controls were conducted without the addition of KCl, in the same media. Samples were paired for preparations from the same flask/passage.
Cellular Ca2+ imaging
Three days prior to the experiment, cells were plated in Greiner 627871 4‐compartment glass‐bottom cell culture dishes (Greiner Bio‐One, Kremsmünster, Austria) and mitochondrial morphology was modulated as described above. Fura‐2 AM loading and imaging protocols were adapted from Arruda et al. (41), with modifications. On the experimental day, the culture medium was removed, and cells were washed twice with experimental buffer containing 10 mM HEPES, 150 mM NaCl, 4 mM KCl, 1 mM MgCl2, and 10 mM d‐glucose (pH 7.4) and then were incubated with 10 μM Fura‐2 AM, 0.1% pluronic acid, and 2 mM CaCl2 in that same medium for 40 min at 37°C and 5% CO2 in order to load the probe. After incubation, the medium was removed and cells were washed twice in the experimental buffer. Cells were then incubated in 1 ml experimental buffer and placed inside the chamber of a Leica DMi‐8 microscope equipped with a Fura‐2 filter (Leica Microsystems, Buffalo Grove, IL, USA) and a ×40 objective. Fura‐2 cytosolic Ca2+ imaging was conducted by alternatively illuminating the cells with wavelengths of 340 and 387 nm. Images were acquired every 5 s. Cytosolic Ca2+ levels are shown in the figures as the 340/387 ratios for the Fura‐2 channels, which are proportional to Ca2+ concentrations. Intensities were calculated using Fiji/ImageJ extension by converting the videos obtained in each channel to grayscale and then plotting the mean gray values over time for each cell. Thirty seconds after the beginning of the experiment, 2 μM thapsigargin was added to the experimental medium in order to promote ER Ca2+ release. At 630 s, 2 mM CaCl2 was added in order to trigger store‐operated Ca2+ reentry. Experiments were repeated on 3 separate days, with 7–10 cells analyzed per day under each experimental condition. Cytosolic Ca2+ (340/387 nm ratio) increase rates after the addition of 2 mM CaCl2 were measured by adjusting a linear fit using Origin 8 Pro software (OriginLab, Northampton, MA, USA).
ER stress marker evaluation by real‐time PCR
On the third day after infection, total RNA from the cells was extracted and purified using Trizol reagent (Thermo Fisher Scientific) and quality‐checked using 260/230 and 260/280 nm scores in a NanoDrop Ppectrophotometer. Equivalent contents of RNA were reverse transcribed using a High‐Capacity cDNA Reverse Transcription Kit (Thermo Fisher Scientific). Synthesized cDNA was stored at –20°C prior to the real‐time PCR assay. Data shown here are expressed as the ratio of the target gene to the hypoxanthine phosphoribosyl transferase (HPRT) reference/housekeeping gene, which was validated through deletion experiments (42). cDNA amplification was performed using Platinum SYBR Green quantitative PCR SuperMix UDG (Thermo Fisher Scientific) and evaluated by real‐time PCR using Rotor Gene 3000 apparatus (Corbett Research, Mortlake, Australia). Quantitative RT‐PCR primer sequences were obtained from the Harvard database PrimerBank (43), as listed in Supplemental Data, and had their efficiency (90% minimum) and concentration standardized. Fold changes were calculated by the 2–ΔΔCt method.
Statistical analysis
Comparisons were made using Prism software (GraphPad, La Jolla, CA, USA), with Student's t tests for simple comparisons between 2 groups and ANOVA for multiple comparisons.
RESULTS
To study the effects of mitochondrial morphology modulation on Ca2+ uptake by this organelle, we used C2C12 myoblast cells, which have a functional and dynamic mitochondrial network (44, 45), are amenable to automated mitochondrial morphologic quantification (46), and display robust intracellular Ca2+ signaling (47). Figure 1 (leftmost panels) shows typical superresolution images of stained mitochondria in these cells, such as those used for automated morphologic analysis. We found that DRP1 DN cells, in which the fission machinery is inhibited, presented mitochondria with lower circularity (Fig. 1 A) and higher aspect ratios (the proportional relationship between width and height, Fig. 1 B) when compared with control cells. This indicates that DRP1 DN cells, as expected, had longer and less circular mitochondria as a consequence of the inhibition of fission. Conversely, MFN2 KD cells, in which fusion was partially impaired (mRNA levels were decreased on average by 40%), presented enhanced mitochondrial fragmentation, as indicated by higher circularity (Fig. 1 A) and lower aspect ratios (Fig. 1 B). Notably, the changes in morphology were expected for physiologic conditions (4). Neither genetic interference affected the area occupied by mitochondria (Fig. 1 C), which indicates that no large‐scale disruption of mitochondrial content occurred. Furthermore, cell viability was above 95% under all conditions, showing that we were able to successfully modulate mitochondrial morphology without compromising cell integrity.
Figure 1.
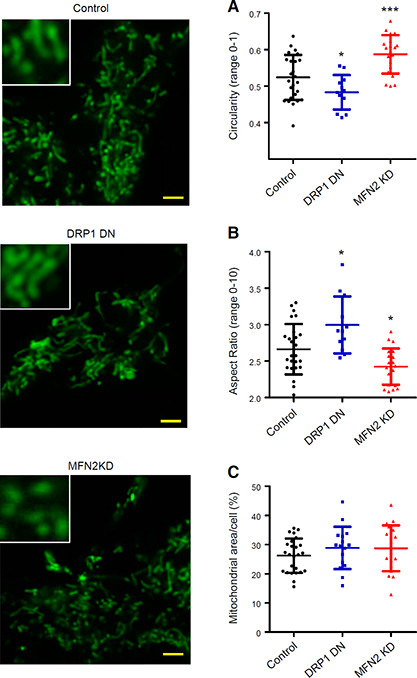
Mitochondrial morphology is modulated by DRP1 and MFN2. C2C12 mitochondria were marked with MitoTracker Green and imaged in intact cells as described in Materials and Methods (left panels, scale bars, 10 μm). The inserts show higher magnifications of selected areas. Mitochondrial circularity (A), aspect ratios (B), and cross‐sectional area relative to the cellular area (C) were quantified from these images; n > 10 cells per condition. *P < 0.05, ***P < 0.001 relative to control cells.
Next, we determined if the changes in mitochondrial morphology modified Ca2+ uptake by these organelles using digitonin‐permeabilized cell suspensions. Plasma membrane permeabilization under these conditions has been shown to keep mitochondrial and cell architecture, as well as the cytoskeleton, intact (48) while largely diluting cytosolic components, allowing for a direct assessment of organellar Ca2+ dynamics. Calcium levels were followed in permeabilized cells using the membrane‐impermeable probe Calcium Green, which fluoresces in the presence of Ca2+ in the experimental buffer but does not enter membrane‐bound organelles. Figure 2 A shows a scheme of the experimental setup. Adding successive Ca2+ boluses (where indicated by the arrows) to a suspension of permeabilized cells results in a rapid increase in Ca2+ levels, followed by gradual decrease in Ca2+ detection due to the uptake of the ion by membrane‐bound organelles. Uptake of the ion continues after each bolus addition until the maximal capacity is reached. Beyond this point, addition of Ca2+ to the extramitochondrial medium is not followed by its uptake by these organelles. Eventually, calcium overload leads to spontaneous Ca2+ release.
Figure 2.
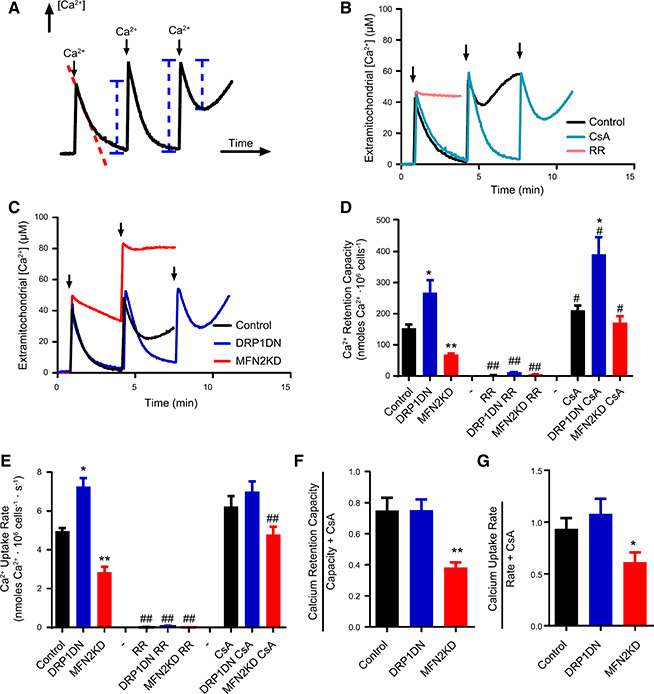
Ca2+ uptake is modulated by mitochondrial morphology. Ca2+ uptake was measured in permeabilized cells as described in Materials and Methods, in control (black lines/columns), DRP1 DN (dark blue lines/columns) and MFN2 KD (red lines/columns) (B–D) cells, as indicated. A) The measurement technique used: Ca2+ uptake by mitochondria is followed by measuring extramitochondrial [Ca2+] concentrations over time, after the addition of successive boluses of the ion to the experimental medium where indicated by arrows. The dotted red line indicates data used to measure Ca2+ uptake rates. Blue lines represent Ca2+ quantities that, when added, reflect maximal retention capacity. B) Only control cells were used, and, where indicated, 1 μM CsA (light blue line) or 1 μM RR (pink line) were present. Arrows indicate bolus 50 μM Ca2+ additions. C) Typical traces in control (black), DRP1 DN (blue), and MFN2 KD (red) cell types. Arrows indicate bolus 50 μM Ca2+ additions. D) Quantification of Ca2+ retention capacity in traces such as those shown in B and C. E) Quantification of Ca2+ uptake rates over the first 20 s after the first Ca2+ addition in traces such as those in B and C. F, and G) Basal calcium retention capacity relative to retention in the presence of CsA (F) and basal uptake rates relative to rates in the presence of CsA (G) were plotted; n ≥ 5 independent repetitions. *P < 0.05, **P < 0.01 relative to noninfected cells under the same conditions; # P < 0.05, ## P < 0.01, relative to the same cells in the absence of CsA or RR.
Ca2+ removal from the medium is due to mitochondrial activity, as uptake by this organelle occurs with higher capacity than that by the ER. Indeed, Ca2+ uptake in control cells (Fig. 2 B, black line) was completely prevented in the presence of the MCU inhibitor RR (Fig. 2 B, pink line). Inhibition of the mitochondrial permeability transition with CsA (Fig. 2 B, light blue line) resulted in a large increase in Ca2+ uptake capacity, further confirming that mitochondrial Ca2+ uptake was measured.
Two characteristics of mitochondrial Ca2+ uptake can be calculated from traces generated by this assay: calcium retention capacity, the maximal amount of Ca2+ taken up by mitochondria (see blue lines in Fig. 2 A) before spontaneous release, and calcium uptake rates (see the dotted red line in Fig. 2 A), the speed in which the ion is removed from the medium after the first addition. We found that DPR1 DN cells, in which mitochondria become elongated, have higher calcium retention capacity (blue traces in Fig. 2 C, and blue columns in Fig. 2 D) and higher calcium uptake rates (Fig. 2 E) when compared with control cells (black traces and columns, Fig. 2 C‐E). This enhanced accumulation was due to augmented mitochondrial Ca2+ uptake because the MCU inhibitor RR completely inhibited it (Fig. 2 D, E). On the other hand, MFN2 KD cells, with fragmented mitochondria, present lower calcium uptake capacity (Fig. 2 C, red trace, and Fig. 2 D, red columns) and lower Ca2+ uptake rates (Fig. 2 E, red columns). Overall, this shows that increased mitochondrial fusion enhances Ca2+ uptake speed and capacity, whereas mitochon‐drial fission decreases Ca2+ uptake. On the other hand, the affinity for Ca2+ in cells with different mitochondrial morphologies was equal, as evaluated by residual concentrations of the ion left in the medium after uptake stabilized.
The presence of CsA (Fig. 2 D) enhanced calcium retention capacity in all cell types, although uptake with CsA was still larger in DRP1 DN mitochondria and lower in MFN2 KD. Interestingly, CsA had a particularly pronounced effect on the MFN2 KD mitochondrial Ca2+ uptake. We calculated the proportional effect of the mitochondrial permeability transition on Ca2+ uptake capacity and rates by comparing these values in the absence and presence of permeability transition inhibitor CsA. Our results indicate that proportional susceptibility to permeability transition is not changed in DRP1 DN cells, yet this process is facilitated by mitochondrial fission promoted by MFN2 knockdown: both mitochondrial Ca2+ uptake capacity (Fig. 2 F) and rates (Fig. 2 G) are proportionally lower in MFN2 KD cells when normalized to these measurements in the presence of CsA. Thus, MFN2 KD‐promoted fragmentation increases mitochondrial permeability transition activity. However, despite the effects of permeability transition in MFN2 KD cells, the absolute differences in Ca2+ uptake capacity and rates promoted by changes in mitochondrial morphology persisted even in the presence of CsA (Fig. 2 D, E). This shows that the permeability transition is not solely responsible for the changes in Ca2+ uptake observed with modified mitochondrial morphology but rather an additional factor governing Ca2+ homeostasis in this organelle.
Interestingly, we found that MCU protein quantities were equal in control, DRP1 DN, and MFN2 KD cells, as detected by Western blots (Fig. 3 ). Thus, modifications in uptake rates and capacity cannot be attributed to enhanced MCU expression. Regulation of the MCU activity also does not seem to be involved in the modulation of Ca2+ uptake by mitochondrial morphology because spermine, an MCU activator, did not enhance mitochondrial uptake in control or MFN2 KD cells (unpublished results).
Figure 3.
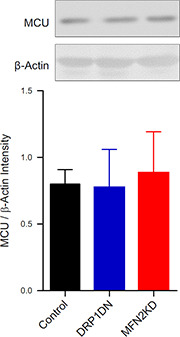
Mitochondrial morphology does not affect MCU expression. Protein expression in control (black), DRP1 DN (blue), and MFN2 KD (red) C2C12 cells was assessed by Western blotting as described in Materials and Methods. No significant differences were measured; n = 5 independent samples.
In order to verify whether an independent and more acute morphology‐modulating intervention could reproduce the effects seen by genetically manipulating mitochondria, we tested the effects of fusion‐promoting compounds. In preliminary experiments, mdivi‐1, identified as a mitochondrial division inhibitor 1 in a chemical screen (49), promoted extensive cell death within 16 h, possibly because of its effect as a complex I inhibitor (50). A second small molecule, mitochondrial fusion promoter M1, did not affect cell viability when tested and was used to induce acute fusion in the cells (Fig. 4 ). M1 treatment robustly increased both calcium retention capacity (Fig. 4 A) and uptake rates (Fig. 4 B) in control cells, confirming through a pharmacological approach that mitochondrial fusion promotes an increase in Ca2+ uptake by this organelle.
Figure 4.
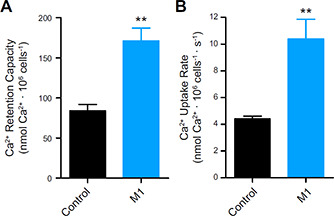
Mitochondrial fusion promoted by M1 increases Ca2+ uptake. Control cells were incubated in the presence or absence of 10 μM M1, as described in Materials and Methods, and Ca2+ retention capacity (A) and uptake rates (B) were measured as described for Fig. 2; n = 4 independent repetitions. **P < 0.01 relative to DMSO‐treated (control) cells.
The fact that mitochondrial Ca2+ homeostasis could be modulated by 2 different methods to change mitochon‐drial morphology (genetically manipulating protein levels and use of a fusion‐inducing small molecule), despite equal MCU expression, led us to seek a mechanistic explanation for the changes in Ca2+ uptake. Ca2+ extrusion from mitochondria mediated by the Na+/Ca2+ exchanger (NCLX) could be excluded as a cause for these differences because sodium was not added to the medium in these experiments, rendering this pathway inactive (51). A possible reason could be a modification of the ΔΨ, the driving force for Ca2+ uptake. We thus measured ΔΨ using plasma membrane‐impermeable safranin O fluorescence, which allows for quantitative ΔΨ determinations in isolated mitochondria or permeabilized cells [Fig. 5 (39, 52)].
Figure 5.
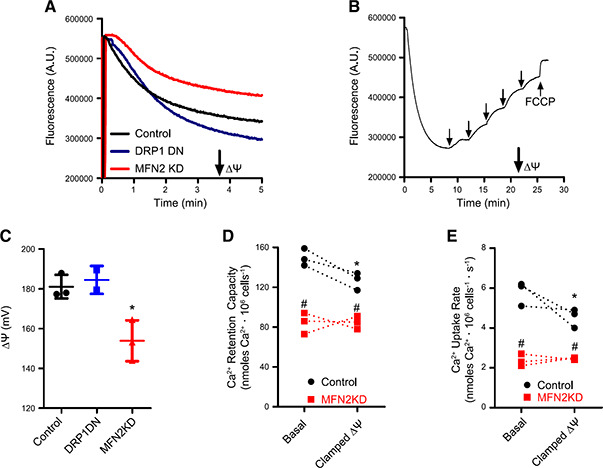
Mitochondrial morphology affects ΔΨ measurements. ΔΨ were measured using safranin O fluorescence as described in Materials and Methods. A) Typical safranin fluorescence traces in control (black), DRP1 DN (blue), and MFN2 KD (red) permeabilized cells. B) A typical ΔΨ calibration procedure in control cells, conducted as described in Materials and Methods. Arrows indicate where K+ and the uncoupler carbonyl cyanide 4‐(trifluoromethoxy) phenylhydrazone (FCCP; 1 μM) were added. C) Presentation of calibrated ΔΨ determinations in control (black symbols), DRP1 DN (blue symbols), and MFN2 KD (red symbols) permeabilized cells; n = 5. *P < 0.05 relative to control cells. D) Ca2+ uptake capacity was evaluated in control (black circles) and MFN2 KD (red squares) permeabilized cells under basal conditions or when ΔΨ was clamped to the average measured MFN2 KD ΔΨ (see Materials and Methods). E) Ca2+ uptake rates were evaluated in control (black circles) and MFN2 KD (red squares) permeabilized cells under basal conditions or when ΔΨ was clamped to the average measured MFN2 KD ΔΨ; n =3 independent repetitions. *P < 0.05 relative to basal ΔΨ; # P < 0.05 relative to control cells under the same ΔΨ condition; traces connect paired experiments.
Figure 5A shows typical safranin fluorescence traces over time after cell permeabilization with digitonin. The downward deflection of the curve over time is a result of ΔΨ‐driven accumulation of the cationic probe in the mitochondrial matrix, which decreases its fluorescence (39, 52). Safranin accumulation in DRP1 DN cells (blue trace) was consistently higher than that in control cells (black trace), whereas MFN2 KD cells (red trace) accumulated less safranin. This result could be indicative of changes in ΔΨ promoted by manipulating mitochondrial morphology. However, accumulation and fluorescence of ΔΨ‐sensitive probes is also modified by mitochondrial size and shape (39, 53). To overcome this possible artifact and quantify changes in ΔΨ, we calibrated safranin fluorescence curves in K+‐free medium in the presence of the K+ ionophore valinomycin, by adding known quantities of extramitochondrial K+ into the medium and following fluorescence changes [Fig. 5 B (52)]. Under these conditions, ΔΨ can be calculated for each added K+ concentration using the Nernst equation, and basal ΔΨ can be extrapolated, in millivolts, from the calibration curves (39, 52). Carbonyl cyanide 4‐(trifluoromethoxy) phenylhydrazone, a proton ionophore, was added at the end of each trace to complete the dissipation of ΔΨ. By using K+ calibrations, we found that, despite differences in safranin accumulation and fluorescence, control and DRP1 DN mitochondria displayed the same ΔΨ (in the range of 180 mV, Fig. 5 C), whereas MFN2 KD mitochondria had significantly lower ΔΨ (in the range of 155 mV, Fig. 5 C). Despite this lower ΔΨ, MFN2 KD mitochondria were still capable of promoting oxidative phosphorylation, as demonstrated by measuring a decrease in ΔΨ upon the addition of 2 mM ADP (unpublished results).
These results highlight a highly important and often overlooked caveat of studies using mitochondrially accumulated probes under conditions in which morphology is modified: in the absence of calibration for each individual condition, changes in fluorescence may be misinterpreted as changes in the parameter the probe is measuring (39, 53), when they may only reflect variations in calibration.
Overall, our ΔΨ quantifications do not explain the increase in Ca2+ uptake capacity and rates in DRP1 DN mitochondria because ΔΨ was unchanged relative to the control cells. However, the decrease in ΔΨ observed in MFN2 KD mitochondria may be the cause for lower Ca2+ uptake capacity and rates as well as higher permeability transition susceptibility observed in Fig. 2. To assess this possibility, we designed an experiment in which the ΔΨ of control cell mitochondria was forcibly clamped at the same level as the ΔΨ of MFN2 KD mitochondria using added extramitochondrial K+ and valinomycin (see Materials and Methods). Calcium uptake was then quantified under these conditions, comparing the effects of clamping ΔΨ on Ca2+ retention capacity (Fig. 5 D) and uptake rates (Fig. 5 E). MFN2 KD cells presented equal calcium retention and uptake rates under basal and clamped ΔΨ conditions (red squares; connected traces show individual replicates under basal conditions paired with the same sample with clamped ΔΨ). This result was expected because ΔΨ was clamped at the same level as basal ΔΨ in MFN2 KD cells. On the other hand, control cells (black circles) presented a decrease in retention capacity and uptake rates when the ΔΨ was clamped. However, mitochondrial Ca2+ uptake capacity and rates were still significantly higher in control cells relative to MFN2 KD cells under clamped ΔΨ conditions, indicating that ΔΨ is not the only factor decreasing Ca2+ uptake in cells with impaired mitochondrial fusion. This result is in line with the finding that DRP1 DN mitochondria do not present changes in ΔΨ but rather take up more Ca2+ at faster rates. Furthermore, changes in ΔΨ would be expected to impact uptake rates but not necessarily retention capacity. Overall, our results conclusively demonstrate that changes in mitochondrial morphology and dynamics are sufficient to change Ca2+ homeostasis in this organelle.
Our next question was whether these modifications in mitochondrial Ca2+ homeostasis have an impact on cellular calcium handling. To investigate this, we evaluated cytosolic Ca2+ levels in intact cells in which mitochondrial morphology was modulated (Fig. 6 ). Figure 5 A shows typical Fura‐2 fluorescence ratio traces (which are directly proportional to intracellular calcium concentrations) of cells acutely incubated in the absence of extracellular calcium. We found that MFN2 KD cells had consistently lower basal calcium levels (typical traces in Fig. 6 A are quantified in Fig. 6 B), whereas levels in control and DRP1 DN cells were equal. Upon promoting calcium release from the ER with thapsigargin (indicated by the arrow in Fig. 6 A), MFN2 KD cells showed lower cytosolic Ca2+ increments (Fig. 6 B) relative to control and DRP1 DN cells, suggestive of lower ER Ca2+ stores. After ER calcium release, basal cytosolic Ca2+ levels were requantified and once again found to be lower in MFN2 KD cells (basal 2, Fig. 6 B). Overall, these results show that MFN2 KD cells had lower cytosolic and ER Ca2+ concentrations.
Figure 6.
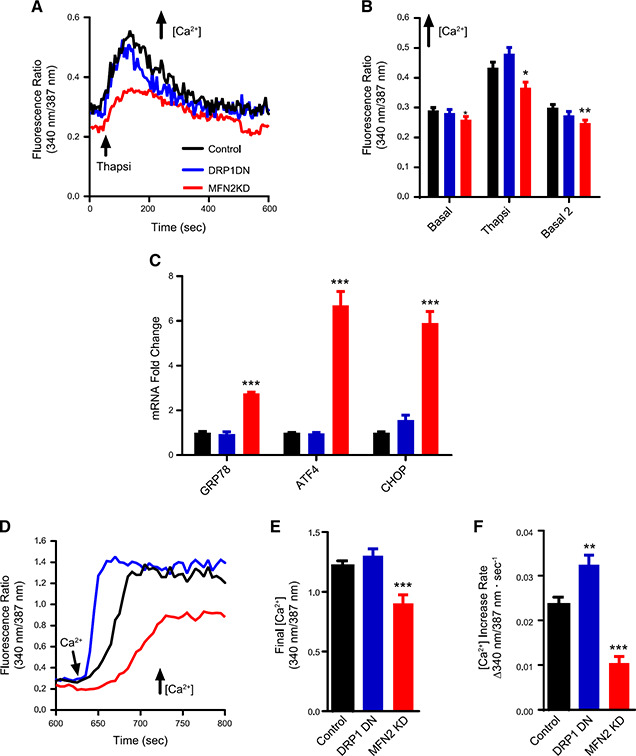
Mitochondrial morphology affects cellular Ca2+ homeostasis and ER stress responses. A) Representative traces of Fura‐2 ratios corresponding to cytosolic Ca2+ concentrations in intact control (black), DRP1 DN (blue), and MFN2 KD (red) plated cells. Where indicated, 2 μM thapsigargin (Thanpsi) was added. B) Quantifications of these traces, including basal initial ratios, peak Thanpsi ratios, and basal 2 ratios, after Thanpsi. C) mRNA levels of ER stress markers 78 kDa glucose‐regulated protein (GRP78), activating transcription factor 4 (ATF4), and C/EBP homologous protein (CHOP) are expressed as the fold change relative to the housekeeping gene hypoxanthine phosphoribosyl transferase (HPRT). D) Representative traces of Fura‐2 ratios after the addition of 2 mM extracellular Ca2+, to activate SOCE. Final SOCE fluorescence ratios are quantified in E. F) quantifies SOCE fluorescence increase rates; n = 23–27 cells/condition. *P < 0.05, **P < 0.01, ***P < 0.001 compared with control cells.
Disruption of ER Ca2+ homeostasis is linked to ER stress responses (54), so we evaluated the expression levels of ER stress markers 78 kDa glucose‐regulated protein [an ER chaperone also known as BiP (55)], activating transcription factor 4, and C/EBP homologous protein [transcription factors that induce protein synthesis in the unfolded protein response (56)] in our cells (Fig. 6 C) as a second indication of a disruption in ER Ca2+ homeostasis. We found that the mRNA expression of all 3 proteins was strongly up‐regulated in MFN2 KD cells compared with control or DRP1 DN cells, indicating that the low basal and ER Ca2+ levels in MFN2 KD cells were accompanied by ER stress.
Because ER calcium stores appeared depleted in MFN2 KD cells, we additionally evaluated SOCE, or the capacity to activate Ca2+ influx into the cell from the extracellular environment as a mechanism to compensate the emptying of intracellular Ca2+ stores (57). SOCE is known to be regulated by mitochondria through mechanisms that involve active mitochondrial Ca2+ uptake and release (58–60). We measured SOCE in our cells by re‐adding extracellular Ca2+ to cells preincubated in Ca2+‐free medium and in which ER stores had been previously depleted by thapsigargin, as shown in Fig. 6 A. This promoted a rapid re‐entry of the ion into the cytosol, increasing Fura‐2 fluorescence ratios (Fig. 6 D). We found that uptake of SOCE into MFN2 KD cells was impaired, reaching lower maximal calcium when compared with control cells (Fig. 6 E) and occurring at slower rates (Fig. 6 F). This result is compatible with the depletion of ER Ca2+ stores we found previously. DRP1 DN cells, on the other hand, displayed maximal calcium replenishment similar to control cells (Fig. 6 E) but at significantly faster rates (~30% faster, Fig. 6 F). Taken together, these experiments demonstrate that regulating mitochondrial morphology has an expressive impact on different aspects of cellular physiologic Ca2+ handling.
DISCUSSION
We demonstrate here that inducing moderate changes in the morphology of the mitochondrial network, promoting either fission or fusion (Fig. 1), alters mitochondrial Ca2+ uptake and retention properties as well as cellular Ca2+ homeostasis and ER stress. Specifically, promoting mitochondrial fission through MFN2 KD enhances mitochon‐drial permeability transition (Fig. 2), possibly because of its effects of decreasing ΔΨ (Fig. 5), a known inducer of this process [see Arruda et al. (21) for a comprehensive review]. MFN2 KD also significantly changes mitochondrial Ca2+ homeostasis; it decreases both Ca2+ uptake rates and Ca2+ retention capacity in mitochondria (Fig. 2). Additionally, MFN2 KD has effects on cellular ion homeostasis, as it lowers basal Ca2+ levels and ER Ca2+ stores, activates ER stress and hampers SOCE after intracellular Ca2+ store depletion (Fig. 6). Although these last effects, seen in intact cells, may be related to MFN2's properties in mediating the interaction between mitochondria and the ER (5, 10, 61, 62), it is important to note that mitochondrial Ca2+ uptake assays conducted in permeabilized cells are independent of these interactions because Ca2+ is added directly to the extramitochondrial microenvironment and uptake by the ER is not quantitatively relevant (Fig. 2 B, D, E).
The changes observed were independent of alterations in MCU expression (Fig. 3), a result compatible with the finding that changes in MCU expression occur in cells derived from MFN2 knockout animals, but were not found in acute MFN2 knockdown cells such as our model (61). Interestingly, the Scorrano group (10, 62) has found that MFN2 knockout cells have higher ER calcium stores and higher mitochondrial Ca2+ uptake, although this was not consistently observed in other studies (61). The reasons for these differences may be the use of distinct cell types, the levels of MFN2 depletion (which in our case were <50%), and the fact that their cells were derived from knockout animals, which were found to have changes in MCU (61). Finally, it should be noted that these prior studies measured intramitochondrial calcium concentrations (10, 61, 62) but not uptake rates or total uptake capacity in mitochondria. Because mitochondrial volumes change in MFN2 KD cells, uptake rate and capacity can change despite equal intramitochondrial Ca2+ concentrations. Indeed, we suggest that the changes in mitochondrial Ca2+ homeostasis observed here are related to changes in mitochondrial matrix volumes, as supported by experiments promoting mitochondrial fusion.
Mitochondrial fusion in DRP1 DN cells (Fig. 2) or M1‐treated (fission‐inhibited) cells (Fig. 4) significantly enhances both mitochondrial Ca2+ uptake capacity and rates in a manner independent of changes in ΔΨ (Fig. 5). Although mitochondrial permeability transition may be responsible for the increments in uptake rates in DRP1 DN cells relative to control cells (uptake rates are equal in these cells in the presence of CsA, Fig. 2 E), it does not account for enhanced Ca2+ uptake capacity, which remains higher in more fused mitochondria even in the presence of a permeability transition inhibitor (Fig. 2 D). Indeed, enhanced Ca2+ uptake is probably attributable to mitochondrial morphologic changes themselves because these modify organellar matrix capacity, which is where the ions accumulate. Demonstrating that mitochondrial fusion also impacts cellular Ca2+ physiology, DRP1 DN cells had similar basal Ca2+ levels and ER Ca2+ stores but displayed enhanced SOCE rates relative to control cells (Fig. 6 D, F). Consistently, data published during the revision process of this manuscript (63) showed that a muscle‐specific DRP1 knockout mouse displayed unchanged ER calcium stores but increased mitochondrial Ca2+ uptake, although in this model, DRP1 disruption was accompanied by increased MCU expression.
This finding complements prior work showing that mitochondrial function, and specifically Ca2+ uptake and release, is determinant in SOCE‐mediated cellular Ca2+ store replenishing (58, 59). Importantly, it suggests that mitochondrial morphology may be an important physiologic regulator of SOCE, which was, to date, related to mitochondrial function through the use of nonphysiologic stimuli, such as uncouplers or direct inhibition of Ca2+ uptake and release pathways in these organelles (58–60). Interestingly, there is also evidence that the location of mitochondria near plasma membrane Ca2+ entry sites can be important in SOCE (64), a result compatible with our findings because the regulation of mitochondrial morphology also impacts mitochondrial transport and positioning in the cell (65).
In a more global sense, our results demonstrate a tight link between mitochondrial morphology and cellular and mitochondrial Ca2+ homeostasis. These findings are supported by prior experiments that indirectly suggest an association between mitochondrial morphology and Ca2+ uptake into the organelle. For example, Szabadkai et al. (66) showed that DRP1‐mediated mitochondrial fission disrupted mitochondrial networks and impacted on intraorganellar calcium wave propagation, indicating a role for mitochondrial plasticity in cell‐wide mitochondrial Ca2+ dissemination. Additionally, Lewis et al. (67) recently found that MFF‐mediated mitochondrial fission changed axonal Ca2+ homeostasis and impacted synaptic function due to changes in mitochondrial Ca2+ uptake, connecting this effect to mitochondrial mass in the axon. Both results can also be explained by a decrease in mitochondrial Ca2+ uptake rates and capacity secondary to mitochondrial fission, as seen in our present study. Our results are also in line with the work of Sebastián et al. (68), who found that MFN2 knockout mice presented elevated levels of ER stress markers, similar to our findings in MFN2 KD cells, although the authors did not connect these findings to Ca2+ changes.
Many central important biologic events involve simultaneous changes in mitochondrial morphology and in Ca2+ homeostasis, including immune activation (69, 70), differentiation (12, 71), insulin secretion (72, 73), and fatty acid metabolism (9, 74, 75), among others. It is tempting to speculate that at least part of the regulatory mechanisms in these processes involve changes in mitochondrial and cellular Ca2+ homeostasis promoted by the modulation of mitochondrial morphology we describe here.
AUTHOR CONTRIBUTIONS
A. J. Kowaltowski designed the research, performed the research, contributed new reagents or analytic tools, analyzed data, and wrote the paper; S. L. Menezes‐Filho designed the research, performed the research, contributed new reagents or analytic tools, and analyzed data; E. A. Assali performed the research; J. V. Cabral‐Costa performed research and analyzed data; P. Abreu performed the research and analyzed data; I.G.G. performed research and analyzed data; N. Miller analyzed the data and contributed new analytic tools; P. Nolasco, F. R. M. Laurindo, and A. Bruni‐Cardoso designed the research and contributed new reagents or analytic tools; and O. Shirihai designed the research, contributed new reagents or analytic tools, and wrote the manuscript.
Supporting information
Supplementary material
ACKNOWLEDGMENTS
The authors acknowledge Edson Alves Gomes and Camille Caldeira da Silva (both from Universidade de São Paulo) for their outstanding technical support. This work was funded by Fundação de Amparo à Pesquisa do Estado de São Paulo (FAPESP) CEPID Grants 2014–10492–0 and 2013/07937–8, CAPES (Coordenação de Aperfeiçoamento de Pessoal de Nível Superior Finance Code 001), Conselho Nacional de Pesquisa e Desenvolvimento (CNPq), the U.S. National Institutes of Health (NIH)/National Institute of Diabetes and Digestive and Kidney Diseases (NIDDK) Grants R01DK099618–02 and RO1DK56690, University of California, Los Angeles (UCLA) Department of Medicine Chair commitment and University of California, San Diego (UCSD)/UCLA Diabetes Research Center pilot grant, and NIH/NIDDK P30 DK063491. The funders had no role in study design, data collection and analysis, decision to publish, or preparation of the manuscript P.N. is supported by São Paulo Research Foundation (FAPESP) Fellowship 2014/24511–7. S.L.M.‐F. was a CAPES Ph.D. fellowship recipient. J.V.C.‐C. is supported by FAPESP Grant 2017/14713–0. P.A. is supported by FAPESP Grant 2016/18633–8. The authors declare no conflicts of interest.
Kowaltowski, A. J. , Menezes‐Filho, S. L. , Assali, E. A. , Gonçalves, I. G. , Cabral‐Costa, J. V. , Abreu, P. , Miller, N. , Nolasco, P. , Laurindo, F. R. M. , Bruni‐Cardoso, A. , Shirihai, O. Mitochondrial morphology regulates organellar Ca2+ uptake and changes cellular Ca2+ homeostasis. FASEB J. 33, 13176–13188 (2019). www.fasebj.org
This article includes supplemental data. Please visit http://www.fasebj.org to obtain this information.
Contributor Information
Alicia J. Kowaltowski, Email: alicia@iq.usp.br.
Orian S. Shirihai, Email: oshirihai@mednet.ucla.edu.
REFERENCES
- 1. Chan, D. C. (2006) Mitochondria: dynamic organelles in disease, aging, and development. Cell 125, 1241–1252 [DOI] [PubMed] [Google Scholar]
- 2. Westermann, B. (2010) Mitochondrial fusion and fission in cell life and death. Nat. Rev. Mol. Cell Biol. 11, 872–884 [DOI] [PubMed] [Google Scholar]
- 3. Liesa, M. , Palacín, M. , and Zorzano, A. (2009) Mitochondrial dynamics in mammalian health and disease. Physiol. Rev. 89, 799–845 [DOI] [PubMed] [Google Scholar]
- 4. Liesa, M. , and Shirihai, O. S. (2013) Mitochondrial dynamics in the regulation of nutrient utilization and energy expenditure. Cell Metab. 17, 491–506 [DOI] [PMC free article] [PubMed] [Google Scholar]
- 5. Pernas, L. , and Scorrano, L. (2016) Mito‐Morphosis: mitochondrial fusion, fission, and cristae remodeling as key mediators of cellular function. Annu. Rev. Physiol. 78, 505–531 [DOI] [PubMed] [Google Scholar]
- 6. Klecker, T. , Böckler, S. , and Westermann, B. (2014) Making connections: interorganelle contacts orchestrate mitochondrial behavior. Trends Cell Biol. 24, 537–545 [DOI] [PubMed] [Google Scholar]
- 7. Stotland, A. , and Gottlieb, R. A. (2015) Mitochondrial quality control: easy come, easy go. Biochim. Biophys. Acta 1853, 2802–2811 [DOI] [PMC free article] [PubMed] [Google Scholar]
- 8. Valm, A. M. , Cohen, S. , Legant, W. R. , Melunis, J. , Hershberg, U. , Wait, E. , Cohen, A. R. , Davidson, M. W. , Betzig, E. , and Lippincott‐Schwartz, J. (2017) Applying systems‐level spectral imaging and analysis to reveal the organelle interactome. Nature 546, 162–167 [DOI] [PMC free article] [PubMed] [Google Scholar]
- 9. Benador, I. Y. , Veliova, M. , Liesa, M. , and Shirihai, O. S. (2019) Mitochondria bound to lipid droplets: where mitochondrial dynamics regulate lipid storage and utilization. Cell Metab. 29, 827–835 [DOI] [PMC free article] [PubMed] [Google Scholar]
- 10. De Brito, O. M. , and Scorrano, L. (2008) Mitofusin 2 tethers endoplasmic reticulum to mitochondria. Nature 456, 605–610; erratum: 513, 266 [DOI] [PubMed] [Google Scholar]
- 11. Chen, Y. , and Dorn, G. W. II (2013) PINK1‐phosphorylated mitofusin 2 is a Parkin receptor for culling damaged mitochondria. Science 340, 471–475 [DOI] [PMC free article] [PubMed] [Google Scholar]
- 12. Forni, M. F. , Peloggia, J. , Trudeau, K. , Shirihai, O. , and Kowaltowski, A. J. (2016) Murine mesenchymal stem cell commitment to differentiation is regulated by mitochondrial dynamics. Stem Cells 34, 743–755 [DOI] [PMC free article] [PubMed] [Google Scholar]
- 13. Friedman, J. R. , Lackner, L. L. , West, M. , DiBenedetto, J. R. , Nunnari, J. , and Voeltz, G. K. (2011) ER tubules mark sites of mitochondrial division. Science 334, 358–362 [DOI] [PMC free article] [PubMed] [Google Scholar]
- 14. Chakrabarti, R. , Ji, W. K. , Stan, R. V. , de Juan Sanz, J. , Ryan, T. A. , and Higgs, H. N. (2018) INF2‐mediated actin polymerization at the ER stimulates mitochondrial calcium uptake, inner membrane constriction, and division. J. Cell Biol. 217, 251–268 [DOI] [PMC free article] [PubMed] [Google Scholar]
- 15. Rizzuto, R. , Pinton, P. , Carrington, W. , Fay, F. S. , Fogarty, K. E. , Lifshitz, L. M. , Tuft, R. A. , and Pozzan, T. (1998) Close contacts with the endoplasmic reticulum as determinants of mitochondrial Ca2+ responses. Science 280, 1763–1766 [DOI] [PubMed] [Google Scholar]
- 16. Csordás, G. , Renken, C. , Várnai, P. , Walter, L. , Weaver, D. , Buttle, K. F. , Balla, T. , Mannella, C. A. , and Hajnóczky, G. (2006) Structural and functional features and significance of the physical linkage between ER and mitochondria. J. Cell Biol. 174, 915–921 [DOI] [PMC free article] [PubMed] [Google Scholar]
- 17. Jackson, J. G. , and Robinson, M. B. (2015) Reciprocal regulation of mitochondrial dynamics and calcium signaling in astrocyte processes. J. Neurosci. 35, 15199–15213 [DOI] [PMC free article] [PubMed] [Google Scholar]
- 18. Wu, H. , Carvalho, P. , and Voeltz, G. K. (2018) Here, there, and everywhere: the importance of ER membrane contact sites. Science 361, eaan5835 [DOI] [PMC free article] [PubMed] [Google Scholar]
- 19. Clapham, D. E. (2007) Calcium signaling. Cell 131, 1047–1058 [DOI] [PubMed] [Google Scholar]
- 20. Gunter, T. E. , and Sheu, S. S. (2009) Characteristics and possible functions of mitochondrial Ca(2+) transport mechanisms. Biochim. Biophys. Acta 1787, 1291–1308 [DOI] [PMC free article] [PubMed] [Google Scholar]
- 21. Vercesi, A. E. , Castilho, R. F. , Kowaltowski, A. J. , de Oliveira, H. C. F. , de Souza‐Pinto, N. C. , Figueira, T. R. , and Busanello, E. N. B. (2018) Mitochondrial calcium transport and the redox nature of the calcium‐induced membrane permeability transition. Free Radic. Biol. Med. 129, 1–24 [DOI] [PubMed] [Google Scholar]
- 22. Arruda, A. P. , Pers, B. M. , Parlakgül, G. , Güney, E. , Inouye, K. , and Hotamisligil, G. S. (2014) Chronic enrichment of hepatic endoplasmic reticulum‐mitochondria contact leads to mitochondrial dysfunction in obesity. Nat. Med. 20, 1427–1435 [DOI] [PMC free article] [PubMed] [Google Scholar]
- 23. Arruda, A. P. , and Hotamisligil, G. S. (2015) Calcium homeostasis and organelle function in the pathogenesis of obesity and diabetes. Cell Metab. 22, 381–397 [DOI] [PMC free article] [PubMed] [Google Scholar]
- 24. Baughman, J. M. , Perocchi, F. , Girgis, H. S. , Plovanich, M. , Belcher‐Timme, C. A. , Sancak, Y. , Bao, X. R. , Strittmatter, L. , Goldberger, O. , Bogorad, R. L. , Koteliansky, V. , and Mootha, V. K. (2011) Integrative genomics identifies MCU as an essential component of the mitochondrial calcium uniporter. Nature 476, 341–345 [DOI] [PMC free article] [PubMed] [Google Scholar]
- 25. Duchen, M. R. (2000) Mitochondria and calcium: from cell signalling to cell death. J. Physiol. 529, 57–68 [DOI] [PMC free article] [PubMed] [Google Scholar]
- 26. Brookes, P. S. , Yoon, Y. , Robotham, J. L. , Anders, M. W. , and Sheu, S. S. (2004) Calcium, ATP, and ROS: a mitochondrial love‐hate triangle. Am. J. Physiol. Cell Physiol. 287, C817–C833 [DOI] [PubMed] [Google Scholar]
- 27. Murphy, E. , and Steenbergen, C. (2008) Mechanisms underlying acute protection from cardiac ischemia‐reperfusion injury. Physiol. Rev. 88, 581–609 [DOI] [PMC free article] [PubMed] [Google Scholar]
- 28. Nicholls, D. G. (2009) Mitochondrial calcium function and dysfunction in the central nervous system. Biochim. Biophys. Acta 1787, 1416–1424 [DOI] [PMC free article] [PubMed] [Google Scholar]
- 29. Figueira, T. R. , Barros, M. H. , Camargo, A. A. , Castilho, R. F. , Ferreira, J. C. , Kowaltowski, A. J. , Sluse, F. E. , Souza‐Pinto, N. C. , and Vercesi, A. E. (2013) Mitochondria as a source of reactive oxygen and nitrogen species: from molecular mechanisms to human health. Antioxid. Redox Signal. 18, 2029–2074 [DOI] [PubMed] [Google Scholar]
- 30. Biasutto, L. , Azzolini, M. , Szabò, I. , and Zoratti, M. (2016) The mitochondrial permeability transition pore in AD 2016: an update. Biochim. Biophys. Acta 1863, 2515–2530 [DOI] [PubMed] [Google Scholar]
- 31. Amigo, I. , Menezes‐Filho, S. L. , Luévano‐Martínez, L. A. , Chausse, B. , and Kowaltowski, A. J. (2017) Caloric restriction increases brain mitochondrial calcium retention capacity and protects against excitotoxicity. Aging Cell 16, 73–81 [DOI] [PMC free article] [PubMed] [Google Scholar]
- 32. Menezes‐Filho, S. L. , Amigo, I. , Prado, F. M. , Ferreira, N. C. , Koike, M. K. , Pinto, I. F. D. , Miyamoto, S. , Montero, E. F. S. , Medeiros, M. H. G. , and Kowaltowski, A. J. (2017) Caloric restriction protects livers from ischemia/reperfusion damage by preventing Ca2+‐induced mitochondrial permeability transition. Free Radic. Biol. Med. 110, 219–227 [DOI] [PubMed] [Google Scholar]
- 33. Menezes‐Filho, S. L. , Amigo, I. , Luévano‐Martínez, L. A. , and Kowaltowski, A. J. (2019) Fasting promotes functional changes in liver mitochondria. Biochim. Biophys. Acta Bioenerg. 1860, 129–135 [DOI] [PubMed] [Google Scholar]
- 34. Rambold, A. S. , Cohen, S. , and Lippincott‐Schwartz, J. (2015) Fatty acid trafficking in starved cells: regulation by lipid droplet lipolysis, autophagy, and mitochondrial fusion dynamics. Dev. Cell 32, 678–692 [DOI] [PMC free article] [PubMed] [Google Scholar]
- 35. Khraiwesh, H. , López‐Domínguez, J. A. , Fernández del Río, L. , Gutierrez‐Casado, E. , López‐Lluch, G. , Navas, P. , de Cabo, R. , Ramsey, J. J. , Burón, M. I. , Villalba, J. M. , and González‐Reyes, J. A. (2014) Mitochondrial ultrastructure and markers of dynamics in hepatocytes from aged, calorie restricted mice fed with different dietary fats. Exp. Gerontol. 56, 77–88 [DOI] [PMC free article] [PubMed] [Google Scholar]
- 36. Cerqueira, F. M. , Chausse, B. , Baranovski, B. M. , Liesa, M. , Lewis, E. C. , Shirihai, O. S. , and Kowaltowski, A. J. (2016) Diluted serum from calorie‐restricted animals promotes mitochondrial β‐cell adaptations and protect against glucolipotoxicity. FEBS J. 283, 822–833 [DOI] [PubMed] [Google Scholar]
- 37. Molina, A. J. , Wikstrom, J. D. , Stiles, L. , Las, G. , Mohamed, H. , Elorza, A. , Walzer, G. , Twig, G. , Katz, S. , Corkey, B. E. , and Shirihai, O. S. (2009) Mitochondrial networking protects beta‐cells from nutrient‐induced apoptosis. Diabetes 58, 2303–2315 [DOI] [PMC free article] [PubMed] [Google Scholar]
- 38. Alsabeeh, N. , Chausse, B. , Kakimoto, P. A. , Kowaltowski, A. J. , and Shirihai, O. (2018) Cell culture models of fatty acid overload: problems and solutions. Biochim. Biophys. Acta Mol. Cell Biol. Lipids 1863, 143–151 [DOI] [PMC free article] [PubMed] [Google Scholar]
- 39. Kowaltowski, A. J. , Cosso, R. G. , Campos, C. B. , and Fiskum, G. (2002) Effect of Bcl‐2 overexpression on mitochondrial structure and function. J. Biol. Chem. 277, 42802–42807 [DOI] [PubMed] [Google Scholar]
- 40. Bambrick, L. L. , Chandrasekaran, K. , Mehrabian, Z. , Wright, C. , Krueger, B. K. , and Fiskum, G. (2006) Cyclosporin A increases mitochondrial calcium uptake capacity in cortical astrocytes but not cerebellar granule neurons. J. Bioenerg. Biomembr. 38, 43–47 [DOI] [PMC free article] [PubMed] [Google Scholar]
- 41. Arruda, A. P. , Pers, B. M. , Parlakgül, G. , Güney, E. , Goh, T. , Cagampan, E. , Lee, G. Y. , Goncalves, R. L. , and Hotamisligil, G. S. (2017) Defective STIM‐mediated store operated Ca2+ entry in hepatocytes leads to metabolic dysfunction in obesity. eLife 6, e29968 [DOI] [PMC free article] [PubMed] [Google Scholar]
- 42. Nicot, N. , Hausman, J. F. , Hoffmann, L. , and Evers, D. (2005) Housekeeping gene selection for real‐time RT‐PCR normalization in potato during biotic and abiotic stress. J. Exp. Bot. 56, 2907–2914 [DOI] [PubMed] [Google Scholar]
- 43. Wang, D. , Wang, J. , Bonamy, G. M. , Meeusen, S. , Brusch, R. G. , Turk, C. , Yang, P. , and Schultz, P. G. (2012) A small molecule promotes mitochondrial fusion in mammalian cells. Angew. Chem. Int. Ed. Engl. 51, 9302–9305 [DOI] [PubMed] [Google Scholar]
- 44. Wikstrom, J. D. , Sereda, S. B. , Stiles, L. , Elorza, A. , Allister, E. M. , Neilson, A. , Ferrick, D. A. , Wheeler, M. B. , and Shirihai, O. S. (2012) A novel high‐throughput assay for islet respiration reveals uncoupling of rodent and human islets. PLoS One 7, e33023; erratum: 8 [DOI] [PMC free article] [PubMed] [Google Scholar]
- 45. Sin, J. , Andres, A. M. , Taylor, D. J. , Weston, T. , Hiraumi, Y. , Stotland, A. , Kim, B. J. , Huang, C. , Doran, K. S. , and Gottlieb, R. A. (2016) Mitophagy is required for mitochondrial biogenesis and myogenic differentiation of C2C12 myoblasts. Autophagy 12, 369–380 [DOI] [PMC free article] [PubMed] [Google Scholar]
- 46. Valente, A. J. , Maddalena, L. A. , Robb, E. L. , Moradi, F. , and Stuart, J. A. (2017) A simple ImageJ macro tool for analyzing mitochondrial network morphology in mammalian cell culture. Acta Histochem. 119, 315–326 [DOI] [PubMed] [Google Scholar]
- 47. Gutierrez‐Martin, Y. , Martin‐Romero, F. J. , and Henao, F. (2005) Store‐operated calcium entry in differentiated C2C12 skeletal muscle cells. Biochim. Biophys. Acta 1711, 33–40 [DOI] [PubMed] [Google Scholar]
- 48. Fiskum, G. , Craig, S. W. , Decker, G. L. , and Lehninger, A. L. (1980) The cytoskeleton of digitonin‐treated rat hepatocytes. Proc. Natl. Acad. Sci. USA 77, 3430–3434 [DOI] [PMC free article] [PubMed] [Google Scholar]
- 49. Cassidy‐Stone, A. , Chipuk, J. E. , Ingerman, E. , Song, C. , Yoo, C. , Kuwana, T. , Kurth, M. J. , Shaw, J. T. , Hinshaw, J. E. , Green, D. R. , and Nunnari, J. (2008) Chemical inhibition of the mitochondrial division dynamin reveals its role in Bax/Bak‐dependent mitochondrial outer membrane permeabilization. Dev. Cell 14, 193–204 [DOI] [PMC free article] [PubMed] [Google Scholar]
- 50. Bordt, E. A. , Clerc, P. , Roelofs, B. A. , Saladino, A. J. , Tretter, L. , Adam‐Vizi, V. , Cherok, E. , Khalil, A. , Yadava, N. , Ge, S. X. , Francis, T. C. , Kennedy, N. W. , Picton, L. K. , Kumar, T. , Uppuluri, S. , Miller, A. M. , Itoh, K. , Karbowski, M. , Sesaki, H. , Hill, R. B. , and Polster, B. M. (2017) The putative Drp1 inhibitor mdivi‐1 is a reversible mitochondrial complex I inhibitor that modulates reactive oxygen species. Dev. Cell 40, 583–594.e6 [DOI] [PMC free article] [PubMed] [Google Scholar]
- 51. Palty, R. , and Sekler, I. (2012) The mitochondrial Na(+)/Ca(2+) exchanger. Cell Calcium 52, 9–15 [DOI] [PubMed] [Google Scholar]
- 52. Akerman, K. E. , and Wikström, M. K. (1976) Safranine as a probe of the mitochondrial membrane potential. FEBS Lett. 68, 191–197 [DOI] [PubMed] [Google Scholar]
- 53. Kowaltowski, A. J. (2019) Strategies to detect mitochondrial oxidants. Redox Biol. 21, 101065 [DOI] [PMC free article] [PubMed] [Google Scholar]
- 54. Krebs, J. , Agellon, L. B. , and Michalak, M. (2015) Ca(2+) homeostasis and endoplasmic reticulum (ER) stress: an integrated view of calcium signaling. Biochem. Biophys. Res. Commun. 460, 114–121 [DOI] [PubMed] [Google Scholar]
- 55. Lee, A. S. (2005) The ER chaperone and signaling regulator GRP78/BiP as a monitor of endoplasmic reticulum stress. Methods 35, 373–381 [DOI] [PubMed] [Google Scholar]
- 56. Han, J. , Back, S. H. , Hur, J. , Lin, Y. H. , Gildersleeve, R. , Shan, J. , Yuan, C. L. , Krokowski, D. , Wang, S. , Hatzoglou, M. , Kilberg, M. S. , Sartor, M. A. , and Kaufman, R. J. (2013) ER‐stress‐induced transcriptional regulation increases protein synthesis leading to cell death. Nat. Cell Biol. 15, 481–490 [DOI] [PMC free article] [PubMed] [Google Scholar]
- 57. Parekh, A. B. , and Putney, J. W., Jr. (2005) Store‐operated calcium channels. Physiol. Rev. 85, 757–810 [DOI] [PubMed] [Google Scholar]
- 58. Malli, R. , and Graier, W. F. (2017) The role of mitochondria in the activation/maintenance of SOCE: the contribution of mitochondrial Ca2+ uptake, mitochondrial motility, and location to store‐operated Ca2+ entry. Adv. Exp. Med. Biol. 993, 297–319 [DOI] [PubMed] [Google Scholar]
- 59. Spät, A. , and Szanda, G. (2017) The role of mitochondria in the activation/maintenance of SOCE: store‐operated Ca2+ entry and mitochondria. Adv. Exp. Med. Biol. 993, 257–275 [DOI] [PubMed] [Google Scholar]
- 60. Ben‐Kasus Nissim, T. , Zhang, X. , Elazar, A. , Roy, S. , Stolwijk, J. A. , Zhou, Y. , Motiani, R. K. , Gueguinou, M. , Hempel, N. , Hershfinkel, M. , Gill, D. L. , Trebak, M. , and Sekler, I. (2017) Mitochondria control store‐operated Ca2+ entry through Na+ and redox signals. EMBO J. 36, 797–815 [DOI] [PMC free article] [PubMed] [Google Scholar]
- 61. Filadi, R. , Greotti, E. , Turacchio, G. , Luini, A. , Pozzan, T. , and Pizzo, P. (2015) Mitofusin 2 ablation increases endoplasmic reticulum‐mitochondria coupling. Proc. Natl. Acad. Sci. USA 112, E2174–E2181 [DOI] [PMC free article] [PubMed] [Google Scholar]
- 62. Naon, D. , Zaninello, M. , Giacomello, M. , Varanita, T. , Grespi, F. , Lakshminaranayan, S. , Serafini, A. , Semenzato, M. , Herkenne, S. , Hernández‐Alvarez, M. I. , Zorzano, A. , De Stefani, D. , Dorn, G. W. II , and Scorrano, L. (2016) Critical reappraisal confirms that mitofusin 2 is an endoplasmic reticulum‐mitochondria tether. Proc. Natl. Acad. Sci. USA 113, 11249–11254 [DOI] [PMC free article] [PubMed] [Google Scholar]
- 63. Favaro, G. , Romanello, V. , Varanita, T. , Andrea Desbats, M. , Morbidoni, V. , Tezze, C. , Albiero, M. , Canato, M. , Gherardi, G. , De Stefani, D. , Mammucari, C. , Blaauw, B. , Boncompagni, S. , Protasi, F. , Reggiani, C. , Scorrano, L. , Salviati, L. , and Sandri, M. (2019) DRP1‐mediated mitochondrial shape controls calcium homeostasis and muscle mass. Nat. Commun. 10, 2576 [DOI] [PMC free article] [PubMed] [Google Scholar]
- 64. Fonteriz, R. , Matesanz‐Isabel, J. , Arias‐Del‐Val, J. , Alvarez‐Illera, P. , Montero, M. , and Alvarez, J. (2016) Modulation of calcium entry by mitochondria. Adv. Exp. Med. Biol. 898, 405–421 [DOI] [PubMed] [Google Scholar]
- 65. Anesti, V. , and Scorrano, L. (2006) The relationship between mitochondrial shape and function and the cytoskeleton. Biochim. Biophys. Acta 1757, 692–699 [DOI] [PubMed] [Google Scholar]
- 66. Szabadkai, G. , Simoni, A. M. , Chami, M. , Wieckowski, M. R. , Youle, R. J. , and Rizzuto, R. (2004) Drp‐1‐dependent division of the mitochondrial network blocks intraorganellar Ca2+ waves and protects against Ca2+‐mediated apoptosis. Mol. Cell 16, 59–68 [DOI] [PubMed] [Google Scholar]
- 67. Lewis, T. L., Jr. , Kwon, S. K. , Lee, A. , Shaw, R. , and Polleux, F. (2018) MFF‐dependent mitochondrial fission regulates presynaptic release and axon branching by limiting axonal mitochondria size. Nat. Commun. 9, 5008 [DOI] [PMC free article] [PubMed] [Google Scholar]
- 68. Sebastián, D. , Hernández‐Alvarez, M. I. , Segalés, J. , Sorianello, E. , Muñoz, J. P. , Sala, D. , Waget, A. , Liesa, M. , Paz, J. C. , Gopalacharyulu, P. , Orešič, M. , Pich, S. , Burcelin, R. , Palacín, M. , and Zorzano, A. (2012) Mitofusin 2 (Mfn2) links mitochondrial and endoplasmic reticulum function with insulin signaling and is essential for normal glucose homeostasis. Proc. Natl. Acad. Sci. USA 109, 5523–5528 [DOI] [PMC free article] [PubMed] [Google Scholar]
- 69. Vig, M. , and Kinet, J. P. (2009) Calcium signaling in immune cells. Nat. Immunol. 10, 21–27; erratum: 223 [DOI] [PMC free article] [PubMed] [Google Scholar]
- 70. Baixauli, F. , Martín‐Cófreces, N. B. , Morlino, G. , Carrasco, Y. R. , Calabia‐Linares, C. , Veiga, E. , Serrador, J. M. , and Sánchez‐Madrid, F. (2011) The mitochondrial fission factor dynamin‐related protein 1 modulates T‐cell receptor signalling at the immune synapse. EMBO J. 30, 1238–1250 [DOI] [PMC free article] [PubMed] [Google Scholar]
- 71. Tonelli, F. M. , Santos, A. K. , Gomes, D. A. , da Silva, S. L. , Gomes, K. N. , Ladeira, L. O. , and Resende, R. R. (2012) Stem cells and calcium signaling. Adv. Exp. Med. Biol. 740, 891–916 [DOI] [PMC free article] [PubMed] [Google Scholar]
- 72. Flatt, P. R. , Boquist, L. , and Hellman, B. (1980) Calcium and pancreatic beta‐cell function. The mechanism of insulin secretion studied with the aid of lanthanum. Biochem. J. 190, 361–372 [DOI] [PMC free article] [PubMed] [Google Scholar]
- 73. Stiles, L. , and Shirihai, O. S. (2012) Mitochondrial dynamics and morphology in beta‐cells. Best Pract. Res. Clin. Endocrinol. Metab. 26, 725–738 [DOI] [PMC free article] [PubMed] [Google Scholar]
- 74. Otto, D. A. , and Ontko, J. A. (1978) Activation of mitochondrial fatty acid oxidation by calcium. Conversion to the energized state. J. Biol. Chem. 253, 789–799 [PubMed] [Google Scholar]
- 75. Rambold, A. S. , Kostelecky, B. , Elia, N. , and Lippincott‐Schwartz, J. (2011) Tubular network formation protects mitochondria from autophagosomal degradation during nutrient starvation. Proc. Natl. Acad. Sci. USA 108, 10190–10195 [DOI] [PMC free article] [PubMed] [Google Scholar]
Associated Data
This section collects any data citations, data availability statements, or supplementary materials included in this article.
Supplementary Materials
Supplementary material