

Abstract
Background
In patients with post-acute COVID-19 syndrome (PACS), abnormal gas-transfer and pulmonary vascular density have been reported, but such findings have not been related to each other or to symptoms and exercise limitation. The pathophysiologic drivers of PACS in patients previously infected with COVID-19 who were admitted to in-patient treatment in hospital (or ever-hospitalized patients) and never-hospitalized patients are not well understood.
Purpose
To determine the relationship of persistent symptoms and exercise limitation with xenon 129 (129Xe) MRI and CT pulmonary vascular measurements in individuals with PACS.
Materials and Methods
In this prospective study, patients with PACS aged 18–80 years with a positive polymerase chain reaction COVID-19 test were recruited from a quaternary-care COVID-19 clinic between April and October 2021. Participants with PACS underwent spirometry, diffusing capacity of the lung for carbon monoxide (DLco), 129Xe MRI, and chest CT. Healthy controls had no prior history of COVID-19 and underwent spirometry, DLco, and 129Xe MRI. The 129Xe MRI red blood cell (RBC) to alveolar-barrier signal ratio, RBC area under the receiver operating characteristic curve (AUC), CT volume of pulmonary vessels with cross-sectional area 5 mm2 or smaller (BV5), and total blood volume were quantified. St George’s Respiratory Questionnaire, International Physical Activity Questionnaire, and modified Borg Dyspnea Scale measured quality of life, exercise limitation, and dyspnea. Differences between groups were compared with use of Welch t-tests or Welch analysis of variance. Relationships were evaluated with use of Pearson (r) and Spearman (ρ) correlations.
Results
Forty participants were evaluated, including six controls (mean age ± SD, 35 years ± 15, three women) and 34 participants with PACS (mean age, 53 years ± 13, 18 women), of whom 22 were never hospitalized. The 129Xe MRI RBC:barrier ratio was lower in ever-hospitalized participants (P = .04) compared to controls. BV5 correlated with RBC AUC (ρ = .44, P = .03). The 129Xe MRI RBC:barrier ratio was related to DLco (r = .57, P = .002) and forced expiratory volume in 1 second (ρ = .35, P = .03); RBC AUC was related to dyspnea (ρ = −.35, P = .04) and International Physical Activity Questionnaire score (ρ = .45, P = .02).
Conclusion
Xenon 129 (129Xe) MRI measurements were lower in participants previously infected with COVID-19 who were admitted to in-patient treatment in hospital with post-acute COVID-19 syndrome, 34 weeks ± 25 after infection compared to controls. The 129Xe MRI measures were associated with CT pulmonary vascular density, diffusing capacity of the lung for carbon monoxide, exercise capacity, and dyspnea.
Clinical trial registration no.: NCT04584671
© RSNA, 2022
Online supplemental material is available for this article
See also the editorial by Wild and Collier in this issue.

Summary
In symptomatic individuals with post-acute COVID-19 syndrome, xenon 129 MRI gas exchange and CT vascular density measurements were abnormal and related to the diffusing capacity of the lung for carbon monoxide, the forced expiratory volume in 1 second, exercise limitation, and exertional dyspnea.
Key Results
■ In this prospective study of 34 individuals with post-acute COVID-19 syndrome (PACS) and six controls with no prior history of COVID-19, the xenon 129 (129Xe) MRI red blood cell (RBC) signal in participants previously infected with COVID-19 who were admitted to in-patient treatment in hospital (or ever-hospitalized) with PACS was less than in never-hospitalized (P = .01) and control participants (P = .046).
■ The 129Xe MRI RBC signal was related to CT pulmonary vascular density, DLco, exercise capacity, and dyspnea.
■ In ever-hospitalized versus never-hospitalized participants, the 129Xe MRI RBC area under the receiver operating characteristic curve was lower, but no quantitative CT differences were observed.
Introduction
The acute and post-acute phase of SARS-CoV-2 infection presents with a variety of symptoms (1) in patients who experienced mild infection (2) and those hospitalized with more severe infection who require hospital-based care (3). The prevalence of post-acute COVID-19 symptomatic findings, including dyspnea at rest and on exertion, tachypnea, fatigue, exercise limitation, muscle weakness, and cognition deficits, ranges from 20% (4) to 81% (3). Such symptoms have been described with the umbrella term “post-acute COVID-19 syndrome” (PACS), defined as persistent symptoms or sequelae at least 12 weeks after infection (5). Post-acute COVID-19 symptoms are difficult to treat because the literature has reported varying degrees of abnormality in spirometry (forced expiratory volume in 1 second [FEV1], 2%–20% below lower limit of normal) (6,7) and diffusing capacity of the lung for carbon monoxide (DLco) (22%–88% below lower limit of normal) (6,7) alongside various CT abnormalities, including ground-glass opacities (41%–89% present) (6,7), reticular patterns (0%–67% present) (6,7), and atelectasis (33% present) (7). A recent study showed that never-hospitalized patients also reported normal or nearly normal pulmonary function tests (6%–37% abnormal at 4-month follow-up) (8), and imaging was rarely available in these patients.
A recent CT pulmonary vascular investigation in hospitalized patients undergoing treatment has also suggested a shift in blood distribution from smaller to larger vessels (9), potentially due to microemboli and vascular remodeling affecting small-vessel resistance. Xenon 129 (129Xe) gas-transfer MRI provides an opportunity to probe capillary-level abnormalities by detecting inhaled 129Xe dissolved in the alveolar membrane (quantified as barrier area under the receiver operating characteristic curve [AUC]) and red blood cells (RBCs) (quantified as RBC AUC). The ratio of 129Xe uptake (RBC:barrier ratio) has been observed to reflect impaired gas transfer in obstructive and restrictive disease (10) and was also recently shown to detect low alveolar to RBC gas exchange in hospitalized patients with COVID-19 3 months after discharge (11,12). Although some long-term symptoms were reported in these patients, 129Xe MRI has not been performed in patients with PACS.
To our knowledge, most COVID-19 studies have been performed in individuals previously infected with COVID-19 who were admitted to in-patient treatment in hospital (hereafter, ever-hospitalized) (3,12) and report poor quality of life after discharge. One recent study investigated symptoms after infection in never-hospitalized patients (2). The most recent wave of COVID-19 infection has affected unprecedented numbers of people but with an apparently decreased rate of hospitalization due to less severe infection (13). Understanding the relationship between COVID-19 infectious severity and post-infection symptoms will be critical for health care planning as COVID-19 becomes endemic.
We hypothesized that long-haul COVID-19 symptoms in the presence of normal pulmonary function would be associated with abnormal 129Xe MRI gas exchange and CT pulmonary vascular density measurements and that such imaging measurements would differ in ever-hospitalized and never-hospitalized individuals with PACS. Hence, in individuals previously infected with COVID-19 (hereafter, ever–COVID-19 participants) with PACS, we aimed to determine the relationship of persistent symptoms and exercise limitation to 129Xe MRI and CT pulmonary vascular measurements.
Materials and Methods
Study Participants
We prospectively evaluated individuals 18–80 years of age who provided written informed consent to an ethics board (The Health Sciences Research Ethics Board: #113224) that was approved by Health Canada and registered protocol (ClinicalTrials.gov: NCT04584671). Study participants with a proven positive polymerase chain reaction COVID-19 test were prospectively recruited from a quaternary-care COVID-19 clinic between April 2021 and October 2021. Inclusion criteria consisted of being at least 18 years of age and younger than 80 years of age and having a documented case of COVID-19 infection (through positive reverse-transcription polymerase chain reaction testing) that resulted in symptoms after infection. Exclusion criteria consisted of contraindications to MRI (such as implants and severe claustrophobia), mental or legal incapacitation (inability to read or understand written material), inability to perform spirometry or plethysmography maneuvers, and pregnancy. Healthy controls aged at least 18 years and younger than 80 years with no prior history of COVID-19 or any other respiratory infection during the period of February 2020 to the study visit date were recruited as a convenience sample in June 2021. Controls were excluded if there were clinically relevant incidental findings.
Study Design
Figure 1 provides the study design, which consisted of visit 1 (3 months after positive COVID-19 test), an optional visit 2 (9 months after positive COVID-19 test), and visit 3 (15 months after positive COVID-19 test). Participants were administered salbutamol upon arrival at our center and 15 minutes later performed post-bronchodilator spirometry and DLco immediately before MRI. Research thoracic CT scans were acquired within 30 minutes of MRI examination, and then participants completed the 6-minute walk test and questionnaires (St George’s Respiratory Questionnaire [14], modified Medical Research Council Questionnaire, Chronic Obstructive Pulmonary Disease Assessment Test [15], post–COVID-19 Functional Status scale [16], International Physical Activity Questionnaire [17], and modified Borg Dyspnea Scale [18,19]). The 129Xe gas-exchange MRI scan was performed at either visit 1, 2, or 3. Oxygen saturation and heart rate were measured using a Nonin 8500 Series Handheld Pulse Oximeter (Nonin Medical) upon participant arrival as well as before and just after the 6-minute walk test. For participants with PACS, the research visit was 35 weeks ± 25 (range, 6–79 weeks) after COVID-19 infection with positive tests ranging from March 2020 to April 2021. Controls were evaluated in June 2021 after at least a single COVID-19 vaccine dose, and none had experienced symptomatic respiratory illness for the period of February 2020 up to and including the study visit date.
Figure 1:

Consolidated Standards of Reporting Trials flow diagram.
Pulmonary Function Tests
Pulmonary function tests were performed according to American Thoracic Society guidelines (20,21) with use of an ndd EasyOne Pro LAB system (ndd Medical Technologies). Post-bronchodilator measurements were performed 15 minutes after inhalation of 4 × 100 µg/inhalation salbutamol sulfate norflurane (Ivax Pharmaceuticals) with use of an AeroChamber (Trudell Medical International). Participants withheld inhaled medications before study visits according to American Thoracic Society guidelines (eg, short-acting β-agonists ≥6 hours, long-acting β-agonists ≥12 hours, and long-acting muscarinic antagonists ≥24 hours) (20). Questionnaires and the 6-minute walk test were self administered under supervision of study personnel.
129Xe MRI
Anatomic hydrogen 1 and 129Xe MRI scans were acquired with use of a 3.0-T scanner (Discovery MR750; GE Healthcare) as previously described (22). The 129Xe MRI scans were acquired with use of a flexible vest quadrature coil (Clinical MR Solutions). Gas-exchange 129Xe MRI examination and spectroscopy were performed, as described in Appendix E1 (online) (22), following coached inhalation and breath hold of a 1.0-L gas mixture (800 mL helium-4 [4He], 200 mL 129Xe for MR spectroscopy and 500 mL 4He, 500 mL 129Xe for MRI) from functional residual capacity. The 129Xe MR spectroscopy data were fit to three complex Lorentzian distributions to determine frequency and AUC. The RBC:barrier ratio was calculated as the ratio of RBC AUC to barrier AUC. Gas-transfer MRI data were reconstructed as previously described (22); additional detail is provided in Appendix E1 (online).
Thoracic CT
Within 30 minutes of MRI examination, CT scans were acquired post-bronchodilator after inhalation of 1.0 L of nitrogen from functional residual capacity, with use of a 64-slice Lightspeed VCT system (GE Healthcare; parameters = 64 × 0.625 collimation, 120 peak kilovoltage, 100 mA, tube rotation time = 500 msec, pitch = 1.25, standard reconstruction kernel, section thickness = 1.25 mm, field of view = 40 cm2), as previously described (22).
Pulmonary vascular measurements included total blood volume, volume of pulmonary blood vessels of 5 mm2 or smaller (BV5), between 5–10 mm2 (BV5–10), and greater than 10 mm2 (BV10), as detailed in Appendix E1 (online). CT data were qualitatively evaluated by a single chest CT radiologist (M.S.A., with >10 years of experience) for diagnostic and incidental findings. The qualitative reader was not blinded. CT data were also quantitatively evaluated by a single experienced observer (A.M.M., with 4 years of experience) who was blinded to participant identification and clinical measurements with use of automated software (Chest Imaging Platform, Brigham and Women’s Hospital) (23).
Data generated or analyzed during the study are available from the corresponding author by request and will be deposited at https://apilab.ca/our_code.html under data version 20220401.
Statistical Analysis
The 129Xe MRI signal intensity ratio of RBC to alveolar tissue barrier was the primary end point. SPSS (SPSS Statistics 27.0; IBM) was used for all statistical analyses. Data were tested for normality with use of Shapiro-Wilk tests, and nonparametric tests were performed for non-normally distributed data. Relationships were evaluated with use of the Pearson (r) and Spearman (ρ) correlations. Intergroup differences were tested with use of Welch t-tests for two-group or Welch analysis of variance for multi-group analyses. The Fischer exact tests were used for categorical variables. Results were considered statistically significant when the probability of making a type I error was less than 5% (P < .05).
Results
Participant Characteristics
As shown in Figure 1, of an initial 44 participants, data were acquired in 34 participants with PACS (mean age ± SD, 53 years ± 13; 18 women) and 10 control participants (mean age, 35 years ± 15; five men), of whom four controls were excluded due to clinically relevant incidental findings. Three control participants were excluded due to asymptomatic asthma, rheumatoid arthritis, and hypertensive crisis. Another participant was excluded due to an incidental finding that led to the diagnosis of a large, asymptomatic atrial septal defect (24).
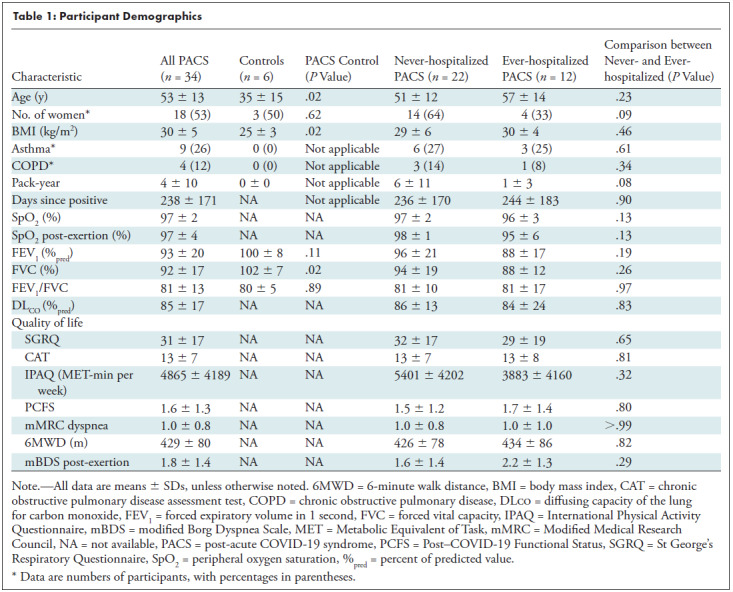
For participants with PACS, the research visit was 35 weeks ± 25 (range, 6–79 weeks) after COVID-19 infection, with positive tests ranging from March 2020 to April 2021. Participants who had never had COVID-19 were evaluated in June 2021 after at least a single COVID-19 vaccine dose, and none had experienced symptomatic respiratory illness for the period up to and including February 2020. Table 1 summarizes participant demographic data for never– and ever–COVID-19 participants with PACS, as well as never- and ever-hospitalized participants with PACS. Control participants were younger (P = .02) than participants with PACS (controls, 35 years ± 15; PACS, 53 years ± 13) and had a lower body mass index (controls, 25 kg/m2 ± 3; PACS, 30 kg/m2 ± 5; P = .02). Persistent symptoms that led to a diagnosis of PACS and follow-up by the London Health Sciences COVID-19 clinic are summarized in Table E1 (online). Most participants reported respiratory symptoms, including exertional dyspnea, as well as fatigue and brain fog. Among the ever-hospitalized patients with COVID-19, two were treated in the intensive care unit, and none required ventilation. Participant medications are summarized in Table E2 (online).
Table 1:
Participant Demographics
Qualitative MRI and CT Findings
Figures 2–4 shows representative 129Xe MRI ventilation, alveolar-capillary tissue barrier, RBC maps, and thoracic CT in a never–COVID-19 participant (Fig 2), a never-hospitalized participant with PACS (Fig 3), and an ever-hospitalized participant with PACS (Fig 4). In the never–COVID-19 control participant, there were homogeneous signal intensities for ventilation, alveolar-capillary tissue barrier, and RBC compartments. In the never- and ever-hospitalized participants with PACS, there were patchy alveolar-capillary tissue barriers and RBC signal intensity maps. As shown in Figure E1C (online), in some participants with abnormal CT BV5 per total blood volume, there was visual evidence of fewer small vessels and a greater density of larger vessels without a visually obvious change in total blood volume. A summary of CT radiologic findings is included in Table E3 (online). In never-hospitalized participants, the most common findings were nodules (eight of 22 participants, 36%), bronchiectasis (three of 22 participants, 14%), ground-glass opacity (four of 22 participants, 18%), and atelectasis (three of 22 participants, 14%). In ever-hospitalized participants, the CT findings were similar but with greater frequencies for ground-glass opacity (five of 12 participants, 42%) and consolidation (two of 12 participants, 17%).
Figure 2:

Xenon 129 (129Xe) gas-transfer MRI scans in a 30-year-old male control participant with red blood cell (RBC):barrier ratio = 0.52. (A) 129Xe ventilation MRI scan. (B) 129Xe barrier MRI scan. (C) 129Xe RBC MRI scan. Cyan represents 129Xe MRI ventilation (xenon in the gas compartment), green represents 129Xe barrier signal intensity (xenon in the barrier compartment), and magenta represents 129Xe RBC signal intensity (xenon in the RBC compartment).
Figure 4:
![Xenon 129 (129Xe) gas-transfer MRI and CT scans of pulmonary vessels in a 42-year-old male participant who had been previously infected with COVID-19 and admitted to in-patient treatment in hospital with post-acute COVID-19 syndrome (red blood cell [RBC]:barrier = 0.33 and CT blood volume in vessels with cross-sectional area ≤5 mm2 normalized to total blood volume = 54%). (A) 129Xe ventilation MRI scan. (B) 129Xe barrier MRI scan. (C) 129Xe RBC MRI scan. (D) CT vessel tree. Cyan represents 129Xe MRI ventilation (xenon in the gas compartment), green represents 129Xe barrier signal intensity (xenon in the barrier compartment), and magenta represents 129Xe RBC signal intensity (xenon in the RBC compartment).](https://www.ncbi.nlm.nih.gov/core/lw/2.0/html/tileshop_pmc/tileshop_pmc_inline.html?title=Click%20on%20image%20to%20zoom&p=PMC3&id=9619202_radiol.220492.fig4.jpg)
Xenon 129 (129Xe) gas-transfer MRI and CT scans of pulmonary vessels in a 42-year-old male participant who had been previously infected with COVID-19 and admitted to in-patient treatment in hospital with post-acute COVID-19 syndrome (red blood cell [RBC]:barrier = 0.33 and CT blood volume in vessels with cross-sectional area ≤5 mm2 normalized to total blood volume = 54%). (A) 129Xe ventilation MRI scan. (B) 129Xe barrier MRI scan. (C) 129Xe RBC MRI scan. (D) CT vessel tree. Cyan represents 129Xe MRI ventilation (xenon in the gas compartment), green represents 129Xe barrier signal intensity (xenon in the barrier compartment), and magenta represents 129Xe RBC signal intensity (xenon in the RBC compartment).
Figure 3:
![Xenon 129 (129Xe) gas-transfer MRI and CT scans of pulmonary vessels in a 59-year-old never-hospitalized female participant with post-acute COVID-19 syndrome (red blood cell [RBC]:barrier = 0.26 and CT blood volume in vessels with cross-sectional area ≤5 mm2 normalized to total blood volume = 62%). (A) 129Xe ventilation MRI scan. (B) 129Xe barrier MRI scan. (C) 129Xe RBC MRI scan. (D) CT vessel tree. Cyan represents 129Xe MRI ventilation (xenon in the gas compartment), green represents 129Xe barrier signal intensity (xenon in the barrier compartment), and magenta represents 129Xe RBC signal intensity (xenon in the RBC compartment).](https://www.ncbi.nlm.nih.gov/core/lw/2.0/html/tileshop_pmc/tileshop_pmc_inline.html?title=Click%20on%20image%20to%20zoom&p=PMC3&id=9619202_radiol.220492.fig3.jpg)
Xenon 129 (129Xe) gas-transfer MRI and CT scans of pulmonary vessels in a 59-year-old never-hospitalized female participant with post-acute COVID-19 syndrome (red blood cell [RBC]:barrier = 0.26 and CT blood volume in vessels with cross-sectional area ≤5 mm2 normalized to total blood volume = 62%). (A) 129Xe ventilation MRI scan. (B) 129Xe barrier MRI scan. (C) 129Xe RBC MRI scan. (D) CT vessel tree. Cyan represents 129Xe MRI ventilation (xenon in the gas compartment), green represents 129Xe barrier signal intensity (xenon in the barrier compartment), and magenta represents 129Xe RBC signal intensity (xenon in the RBC compartment).
Differences between Never- and Ever-hospitalized Participants
Table 2 shows the MRI (n = 34) and CT pulmonary vascular measurements (n = 24) by hospitalization status, and Figure 5 shows some of these measurements in box and whisker plots. Five CT segmentations were excluded from the evaluation because of segmentation artifacts in regions of CT consolidation and/or opacities in ever-hospitalized participants.
Table 2:
Imaging Measurements
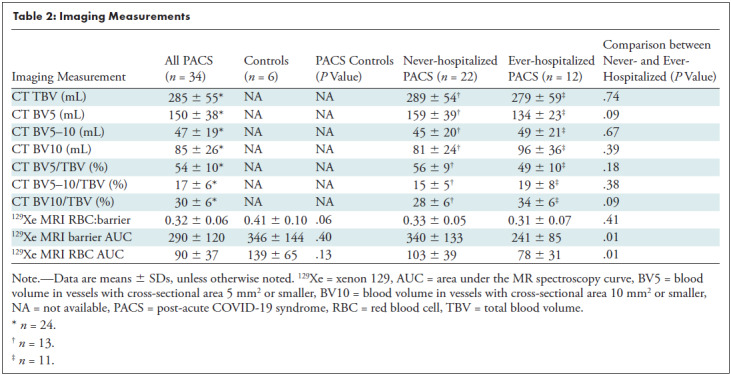
Figure 5:

Box and whisker plots show xenon 129 (129Xe) spectroscopy measurements for controls, never-hospitalized participants, and participants who had been previously infected with COVID-19 and admitted to in-patient treatment in hospital (or ever-hospitalized) with post-acute COVID-19 syndrome (PACS). Controls and never-hospitalized participants with PACS reported different 129Xe MR spectroscopy measurements. (A) Box and whisker plot shows the red blood cell (RBC):barrier for controls (0.41 ± 0.10) and ever-hospitalized participants with PACS (0.31 ± 0.07), P = .04. (B) Box and whisker plot shows the RBC area under the receiver operating characteristic curve (AUC) for controls (139 ± 65) and ever-hospitalized participants with PACS (78 ± 31) (P = .046), as well as never-hospitalized participants with PACS (103 ± 39) and ever-hospitalized participants with PACS (P = .01). (C) Box and whisker plot shows the barrier AUC for never-hospitalized participants with PACS (340 ± 133) and ever-hospitalized participants with PACS (241 ± 85), P = .01. Asterisks indicate significant differences, circles indicate measurements of individual control participants, squares indicate measurements of individual never-hospitalized participants with PACS, and triangles indicate measurements of individual ever-hospitalized participants with PACS.
As shown in Table 2, in all participants with PACS as compared with control participants, 129Xe MRI RBC:barrier ratio (0.32 ± 0.06 vs 0.41 ± 0.10, P = .06) trended toward a difference. The 129Xe MRI barrier AUC (340 ± 133 vs 241 ± 85, P = .01) and RBC AUC (103 ± 39 vs 78 ± 31, P = .01) measures were greater in never- as compared with ever-hospitalized participants. There was no difference in BV5 per total blood volume for never- (56 ± 9) and ever-hospitalized participants (49 ± 10, P = .14), although the trend observed was consistent with previous reports of vascular pruning in COVID-19 (9). Figure 5 shows differences in box and whisker plots by participant group for 129Xe MRI RBC:barrier ratio, RBC, and barrier AUC. Differences in RBC AUC were observed between never–COVID-19, never-hospitalized PACS, and ever-hospitalized PACS.
Relationships between Imaging Measurements, Symptoms, and Exercise Limitation
Figure 6 shows the relationships for CT and MRI measurements with one another and with symptoms and exercise limitation. Table E4 (online) shows all MRI and CT relationships with spirometry, DLco, and questionnaire and exercise data. Figure 4 shows that the 129Xe MRI RBC:barrier ratio was correlated with DLco (r = .57, P = .002) and FEV1 (ρ = 35, P = .03). The 129Xe MRI RBC AUC was correlated with CT BV5 (ρ = .44, P = .03), International Physical Activity Questionnaire score (ρ = .45, P = .02), post-exertional oxygen saturation (ρ = .37, P = .03), and after 6-minute walk test Borg dyspnea (ρ = –.35, P = .04) but not St George’s Respiratory Questionnaire score (r = –.15, P = .40). BV5 was also correlated with post-exertional oxygen saturation (ρ = .46, P = .03).
Figure 6:

Scatterplots show xenon 129 (129Xe) MR spectroscopy measurement relationships with pulmonary function and exercise measurements in participants with post-acute COVID-19 syndrome. (A) Scatterplot shows 129Xe gas-transfer red blood cell (RBC):barrier measurements were related to (r = .57, Holm-Bonferroni P = .002) diffusing capacity of the lung for carbon monoxide (DLco). (B) Scatterplot shows 129Xe MRI RBC area under the receiver operating characteristic curve (AUC) trended toward an association with CT blood volume in vessels with cross-sectional area of 5 mm2 or smaller (BV5) (ρ = .46, Holm-Bonferroni P = .06). (C) Scatterplot shows 129Xe MR RBC AUC was related to International Physical Activity Questionnaire (IPAQ) exercise capacity (ρ = .45, Holm-Bonferroni P = .02). (D) Scatterplot shows 129Xe MR RBC AUC was related to dyspnea measured by post-exertion modified Borg Dyspnea Scale (ρ = –.35, Holm-Bonferroni P = .04). SpO2 = oxygen saturation.
Table E4 (online) provides additional relationship data without statistical tests. Figure 7 shows proposed mechanisms underlying abnormal CT and MRI measurements.
Figure 7:

Illustrations show proposed mechanisms explaining relationships for xenon 129 (129Xe) MRI red blood cell (RBC) area under the receiver operating characteristic curve. (A) Gas exchange in a healthy individual occurs as xenon diffuses through the tissue barrier and attaches to RBCs. (B) Vasoconstrictive remodeling following infection reduces the available blood volume for 129Xe binding. (C) Changes to vascular resistance and flow patterns may result in redistributions of pulmonary blood through shunting away from 129Xe ventilated regions. (D) Thrombus or microembolism blocks capillary-level blood flow, preventing 129Xe uptake in RBC and redistributing blood upstream in the vasculature.
Discussion
Independent studies (11,12) have uncovered evidence of either MRI or CT pulmonary vascular abnormalities in previously hospitalized patients with COVID-19 who were recovered from infection but remained symptomatic. Here, we endeavored to determine if xenon 129 (129Xe) MRI abnormalities were present in never-hospitalized participants with post-acute COVID-19 syndrome (PACS) and to determine relationships between MRI and CT measurements with clinical and patient-centered measurements. We evaluated 40 participants, including 22 never-hospitalized participants and 12 participants previously infected with COVID-19 who were admitted to in-patient treatment in hospital (hereafter, ever-hospitalized) with PACS, 35 weeks ± 25 after COVID-19 infection and observed (a) different 129Xe MRI red blood cell (RBC):barrier ratio (0.31 ± 0.07 vs 0.41 ± 0.10; P = .04) and RBC area under the receiver operating characteristic curve (AUC) (90 ± 37 vs 139 ± 65; P = .046) in ever-hospitalized participants with PACS with normal spirometry (but abnormal St George’s Respiratory Questionnaire, International Physical Activity Questionnaire, and modified Medical Research Council results) as compared with controls, (b) differences in 129Xe MRI RBC (78 ± 31 vs 103 ± 39; P = .01) and barrier AUC (241 ± 85 vs 340 ± 133; P = .01) in ever- as compared with never-hospitalized participants, (c) relationships for MRI RBC:barrier ratio with diffusing capacity of the lung for carbon monoxide (r = .57, P = .002) and forced expiratory volume in 1 second (ρ = .35, P = .03), and (d) relationships for MRI RBC AUC with CT BV5 (ρ = .44, P = .03), International Physical Activity Questionnaire score (ρ = .45, P = .02), post-exertional oxygen saturation (ρ = .46, P = .03), and after 6-minute walk test dyspnea (ρ = ±.35, P = .04).
In all patients with COVID-19, mean spirometry values were normal, mean DLco was at the bottom of the normal range, and St George’s Respiratory Questionnaire, International Physical Activity Questionnaire, and modified Medical Research Council scores were abnormal. In addition, RBC:barrier ratio (controls, 0.41 ± 0.10; participants with ever–COVID-19, 0.32 ± 0.06; P = .06) trended toward a difference as compared with never–COVID-19 controls. As in previous studies (25), we used hospitalization status to dichotomize patients after having COVID-19 and detected MRI differences in never- and ever-hospitalized participants, including 129Xe MRI RBC and barrier AUC. Whereas the CT measurements in never-hospitalized participants were similar to never–COVID-19 values previously reported (BV5 per total blood volume = 56%, BV10 per total blood volume = 28%) (9), CT pulmonary vascular measurements in ever-hospitalized patients with COVID-19 were consistent with vascular pruning, similar to previous findings (9). CT evidence of “vascular pruning” has been hypothesized to be due to vasoconstrictive remodeling of the capillary systems and small blood vessels (9). While the capillaries are well beyond the spatial resolution of CT, histologic analyses (26) have indicated that capillary remodeling occurred in patients with chronic obstructive pulmonary disease when CT vascular pruning was also identified. In never-hospitalized patients, we observed 129Xe MRI but not CT abnormalities. Because MRI directly probes the function of the alveolar-capillary boundary, it may be more sensitive or more targeted than CT to microvascular abnormalities.
Together, the abnormal MRI and CT findings were consistent with abnormal gas exchange stemming from the alveolar tissue barrier and pulmonary vascular compartments. Similar to previous reports of post–COVID-19 coagulation and emboli (1), it is possible that we were measuring microembolic or microthrombotic obstruction of small capillaries, which explained the abnormal RBC signal. Other vascular changes, such as vascular injury, vascular remodeling, or shunting, may also be possible and has previously been hypothesized post–COVID-19 (5,9,25). Postmortem micro-CT imaging of COVID-19 infection supports these interpretations as abnormal alveolar-level structures and occluded capillaries were observed (27).
We observed relationships for 129Xe MRI RBC:barrier ratio with DLco and FEV1. While modestly low DLco is common in patients with PACS after a COVID-19 hospitalization (28), a pilot 129Xe MRI study unexpectedly did not find a DLco and MRI gas-transfer relationship (12). In contrast, here, we observed relationships for the 129Xe MRI RBC:barrier ratio with DLco and FEV1. The relationship with DLco was not unexpected because previous work showed these relationships in both obstructive and restrictive lung disease (29). RBC:barrier and FEV1 relationships have not previously been observed but could reflect underlying tissue changes in participants that also impact airway restriction. In our study, DLco was greater than 80% of predicted values in both never- and ever-hospitalized participants, and FEV1 was also normal, which together may suggest that the 129Xe MRI RBC:barrier ratio is highly sensitive to pulmonary gas-transfer abnormalities.
We also observed a moderate correlation between BV5 and RBC AUC. This finding supports a link between RBC gas uptake and small-vessel abnormalities in PACS. Microvascular remodeling, shunting, thrombi, microemboli, or some combination of these may play a role. Increased vascular resistance due to these structural modifications could also explain how such abnormalities are also visible throughout the vascular tree. Hemodynamic measurements were outside the scope of our study but may prove an important subject of future investigation into PACS mechanisms.
We were surprised to detect relationships for MRI RBC AUC with post-exertion oxygen saturation, exertional dyspnea (modified Borg Dyspnea Scale), and the International Physical Activity Questionnaire score. Similar to previous studies of patients after having COVID-19 (5,25,30), in our study, there were abnormal results for St George’s Respiratory Questionnaire (31 ± 17 vs 6 ± 9 in general population [31]), Chronic Obstructive Pulmonary Disease Assessment Test (13 ± 7, >90th percentile general population [32]), and modified Medical Research Council dyspnea (1.0 ± 0.7, >91st percentile general population [33]). While there were no relationships for MRI and CT measurements with St George’s Respiratory Questionnaire (which is validated for use in chronic obstructive pulmonary disease) (14), there was a correlation for International Physical Activity Questionnaire activity and MRI RBC AUC. Relationships between MRI, CT, pulmonary function, and symptoms suggest a physiologic mechanistic link. Abnormal gas transfer, demonstrated by the relationship between RBC:barrier and DLco, would lead to poor oxygenation and vascular changes, possibly reflected in the trend toward a relationship between post-exertion oxygen saturation and CT BV5. Vascular abnormality-driven desaturation could explain commonly reported symptoms in PACS, such as exercise limitation and dyspnea (3), which we observed to be related to RBC AUC. Pulmonary vascular abnormalities, including the low RBC signal intensity (which is a surrogate for abnormal oxygen uptake), may stem from vascular remodeling, where narrowed vessels reduced the available blood volume or eliminated it altogether in regions with vascular shunting or persistent microemboli. For example, in cadaveric COVID-19 lungs, there was histologic evidence of severe endothelial damage and distorted, elongated vessels alongside microemboli (34). Shunting has been observed during infection in patients with COVID-19 (35), and perfusion of damaged or unventilated alveoli would also reduce RBC signal intensity in the lung. These potential mechanisms are supported by the relationship between the MRI RBC:barrier ratio and DLco and an RBC AUC relationship with oxygen saturation. Microvascular changes in flow and resistance could have upstream effects on the vasculature and may explain blood redistribution observed here and in other studies (9). The relationship between RBC AUC, dyspnea scores, and exercise capacity measured by the International Physical Activity Questionnaire help explain dyspnea and exercise impairment in some patients after COVID-19 as pulmonary vascular gas-exchange dysfunction.
In our study, the range of follow-up was quite wide (6–79 weeks post-positive test), with most COVID-19 testing at our center performed approximately 1 week after infection. While post-acute infectious symptoms were potentially possible, the emerging literature now describes the timelines for clinically relevant post–COVID-19 symptoms that include 4–6 weeks after infection. For example, the Centers for Disease Control and Prevention coined the term post–COVID-19 condition as “a wide range of new, returning, or ongoing health problems people can experience four or more weeks after first being infected with the virus that causes COVID-19” (36). The World Health Organization also describes the post–COVID-19 condition, typically 3 months from the onset of COVID-19 (37). As an alternative that blends both consensus definitions, the National Institute for Health and Care Excellence (38) coined the term “long COVID-19” as signs and symptoms that continue or develop following the acute infectious phase of COVID-19, which includes both ongoing symptomatic COVID-19 and post– COVID-19 syndrome all greater than 4 weeks after infection (5). Hence, our understanding and these definitions are still quite fluid. Given these definitions, the ever–COVID-19 participants evaluated in our study can be considered as having PACS or long COVID-19, based on their symptoms and timeframe since symptomatic infection.
We recognize a number of study limitations. For example, the relatively small sample size of the control and PACS subgroups certainly limits the generalizability of our findings. Our study was not powered based on 129Xe MRI spectroscopy measurements, so our results must be considered exploratory and hypothesis generating. To provide a transparent snapshot of our results with the COVID-19 research community, we provided data in Appendix E1 (online) without statistical tests so that other centers may use our results to help generate sample sizes for long-term follow-up studies.
Other limitations were that: (a) CT was not performed in the control subgroup, which prevented CT comparisons across all three subgroups; (b) all participants were referred from a COVID-19 clinic focusing on long-haul symptoms and, therefore, recruitment was likely biased toward symptomatic individuals seeking some form of explanation or intervention; (c) participants with PACS were older than the controls (53 years ± 13 vs 35 years ± 15). To our knowledge, the effect of age on 129Xe gas-exchange biomarkers has not been reported. However, it is possible that similar to age-related changes observed for DLco (39), age may also influence MRI gas-transfer measurements; (d) COVID-19 antibody testing was not performed to verify COVID-19 infection status in the never–COVID-19 volunteers, so while unlikely, it is possible that some may have previously experienced an asymptomatic infection before the study; (e) the mean RBC:barrier ratio estimated for the control subgroup was lower than previous reports (11,12), and this means that the differences detected for patients with COVID-19 may be conservative underestimates; (f) 129Xe gas-exchange MRI scan was performed on either Visit 1, 2, or 3, which broadened the time after COVID-19 infection to 35 weeks ± 25. As shown in Figure E2 (online), there was no bias over time toward improved gas exchange, but nevertheless, it will be important to evaluate those participants who received MRI scans at visit 1 for potential longitudinal differences; and finally, (g) MRI scan heterogeneity was not evaluated quantitatively in our study, and we note that previous 129Xe MRI COVID-19 investigations (11,12) also reported the RBC:barrier ratio, which makes comparisons with our study possible. Unfortunately, gas-exchange imaging was not technically implemented at our center until our COVID-19 study was already underway for a year, and in these participants, MR spectroscopy was implemented first for our study.
Larger studies aimed at identifying mechanistic relationships between dyspnea and other symptoms with xenon 129 (129Xe) MRI abnormalities are complex to undertake in participants with PACS. To our knowledge, the findings of abnormal 129Xe MRI gas-exchange measurements in never-hospitalized patients with COVID-19 and the relationships between 129Xe MRI and CT pulmonary vascular measurements have not been previously established in the literature. In our study, both CT and 129Xe MRI suggest temporally persistent pulmonary vascular density and gas-transfer abnormalities that were related to exercise limitation and exertional dyspnea. We observed abnormal 129Xe MRI gas-exchange measurements in never-hospitalized participants with COVID-19 and some 129Xe MRI measurements were worse in individuals previously infected with COVID-19 who were admitted to in-patient treatment in hospital compared to controls. We also detected relationships between 129Xe MRI and CT pulmonary vascular measurements that point to persisting pulmonary vascular abnormalities, including vessel density and gas-transfer abnormalities that were related to exercise limitation and exertional dyspnea. Furthermore, future studies will seek to determine if pulmonary vascular abnormalities can act as a predictor of long-term post-acute COVID-19 syndrome (PACS) outcomes and if abnormal gas-exchange measures can predict recovery. Pulmonary vascular pathologic conditions play a role in PACS regardless of COVID-19 severity.
Acknowledgments
Acknowledgments
The authors acknowledge the support of the London Health Sciences Centre COVID-19 clinic and Middlesex-London Health Unit (which provided all COVID-19 testing and reporting) as well as the participants who consented to this 2-year longitudinal study.
Supported by the Ministry of Health and Long-Term Care. A.M.M. supported by a Natural Sciences and Engineering Council (Canada) doctoral scholarship. G.P., M.K., and S.S. supported by the Canada Research Chair Program.
Data sharing: Data generated or analyzed during the study are available from the corresponding author by request.
Disclosures of conflicts of interest: A.M.M. No relevant relationships. M.J.M. No relevant relationships. H.K.K. No relevant relationships. J.L. No relevant relationships. V.D. No relevant relationships. E.B. No relevant relationships. B.D. Patents related to hyperpolarized 129Xe MRI methods are licensed to Polarean Imaging; board member at Polarean Imaging; stock and stock options in Polarean Imaging. S.S. Investigator-initiated study with Cyclomedica; consulting fees from Arrowhead Pharmaceuticals; payment or honoraria from AstraZeneca, Novartis, and Polarean. G.E.S. No relevant relationships. M.K. No relevant relationships. M.S.A. No relevant relationships. Y.S. No relevant relationships. V.G. No relevant relationships. A.O. No relevant relationships. M.A. No relevant relationships. I.D. No relevant relationships. J.M.N. Educational grant from AstraZeneca; payment or honoraria from AstraZeneca, Vertex, Horizontal Therapeutics, and Valeo Pharma. G.P. Ontario Rapid Response grant; consulting fees from Polarean Imaging; payment or honoraria from AstraZeneca; member of Board of Governors for Western University, and member of the Institute Advisory Board, Institute of Circulatory and Respiratory Health, and Canadian Institutes of Health Research.
Abbreviations:
- AUC
- area under the receiver operating characteristic curve
- BV5
- blood volume in vessels with cross-sectional area 5 mm2 or smaller
- DLco
- diffusing capacity of the lung for carbon monoxide
- FEV1
- forced expiratory volume in 1 second
- PACS
- post-acute COVID-19 syndrome
- RBC
- red blood cell
References
- 1. Nurek M , Rayner C , Freyer A , et al . Recommendations for the recognition, diagnosis, and management of long COVID: a Delphi study . Br J Gen Pract 2021. ; 71 ( 712 ): e815 – e825 . [DOI] [PMC free article] [PubMed] [Google Scholar]
- 2. Estiri H , Strasser ZH , Brat GA , et al . Evolving phenotypes of non-hospitalized patients that indicate long COVID . BMC Med 2021. ; 19 ( 1 ): 249 . [DOI] [PMC free article] [PubMed] [Google Scholar]
- 3. Fernández-de-Las-Peñas C , Palacios-Ceña D , Gómez-Mayordomo V , et al . Long-term post-COVID symptoms and associated risk factors in previously hospitalized patients: A multicenter study . J Infect 2021. ; 83 ( 2 ): 237 – 279 . [DOI] [PMC free article] [PubMed] [Google Scholar]
- 4. Sandmann FG , Tessier E , Lacy J , et al . Long-term health-related quality of life in non-hospitalised COVID-19 cases with confirmed SARS-CoV-2 infection in England: Longitudinal analysis and cross-sectional comparison with controls . Clin Infect Dis 2022. . 10.1093/cid/ciac151. Published online March 5, 2022 . [DOI] [PMC free article] [PubMed]
- 5. Nalbandian A , Sehgal K , Gupta A , et al . Post-acute COVID-19 syndrome . Nat Med 2021. ; 27 ( 4 ): 601 – 615 . [DOI] [PMC free article] [PubMed] [Google Scholar]
- 6. Huang C , Huang L , Wang Y , et al . 6-month consequences of COVID-19 in patients discharged from hospital: a cohort study . Lancet 2021. ; 397 ( 10270 ): 220 – 232 . [DOI] [PMC free article] [PubMed] [Google Scholar]
- 7. van Gassel RJJ , Bels JLM , Raafs A , et al . High Prevalence of Pulmonary Sequelae at 3 Months after Hospital Discharge in Mechanically Ventilated Survivors of COVID-19 . Am J Respir Crit Care Med 2021. ; 203 ( 3 ): 371 – 374 . [DOI] [PMC free article] [PubMed] [Google Scholar]
- 8. Munker D , Veit T , Barton J , et al . Pulmonary function impairment of asymptomatic and persistently symptomatic patients 4 months after COVID-19 according to disease severity . Infection 2022. ; 50 ( 1 ): 157 – 168 . [DOI] [PMC free article] [PubMed] [Google Scholar]
- 9. Lins M , Vandevenne J , Thillai M , et al . Assessment of Small Pulmonary Blood Vessels in COVID-19 Patients Using HRCT . Acad Radiol 2020. ; 27 ( 10 ): 1449 – 1455 . [DOI] [PMC free article] [PubMed] [Google Scholar]
- 10. Wang Z , Bier EA , Swaminathan A , et al . Diverse cardiopulmonary diseases are associated with distinct xenon magnetic resonance imaging signatures . Eur Respir J 2019. ; 54 ( 6 ): 1900831 . [DOI] [PMC free article] [PubMed] [Google Scholar]
- 11. Li H , Zhao X , Wang Y , et al . Damaged lung gas exchange function of discharged COVID-19 patients detected by hyperpolarized 129Xe MRI . Sci Adv 2021. ; 7 ( 1 ): eabc8180 . [DOI] [PMC free article] [PubMed] [Google Scholar]
- 12. Grist JT , Chen M , Collier GJ , et al . Hyperpolarized 129Xe MRI Abnormalities in Dyspneic Patients 3 Months after COVID-19 Pneumonia: Preliminary Results . Radiology 2021. ; 301 ( 1 ): E353 – E360 . [DOI] [PMC free article] [PubMed] [Google Scholar]
- 13. Maslo C , Friedland R , Toubkin M , Laubscher A , Akaloo T , Kama B . Characteristics and Outcomes of Hospitalized Patients in South Africa During the COVID-19 Omicron Wave Compared With Previous Waves . JAMA 2022. ; 327 ( 6 ): 583 – 584 . [DOI] [PMC free article] [PubMed] [Google Scholar]
- 14. Jones PW , Quirk FH , Baveystock CM , Littlejohns P . A self-complete measure of health status for chronic airflow limitation. The St. George’s Respiratory Questionnaire . Am Rev Respir Dis 1992. ; 145 ( 6 ): 1321 – 1327 . [DOI] [PubMed] [Google Scholar]
- 15. Jones PW , Harding G , Berry P , Wiklund I , Chen WH , Kline Leidy N . Development and first validation of the COPD Assessment Test . Eur Respir J 2009. ; 34 ( 3 ): 648 – 654 . [DOI] [PubMed] [Google Scholar]
- 16. Klok FA , Boon GJAM , Barco S , et al . The Post-COVID-19 Functional Status scale: a tool to measure functional status over time after COVID-19 . Eur Respir J 2020. ; 56 ( 1 ): 2001494 . [DOI] [PMC free article] [PubMed] [Google Scholar]
- 17. Craig CL , Marshall AL , Sjöström M , et al . International physical activity questionnaire: 12-country reliability and validity . Med Sci Sports Exerc 2003. ; 35 ( 8 ): 1381 – 1395 . [DOI] [PubMed] [Google Scholar]
- 18. Borg GAV . Psychophysical bases of perceived exertion . Med Sci Sports Exerc 1982. ; 14 ( 5 ): 377 – 381 . [PubMed] [Google Scholar]
- 19. Enright PL . The six-minute walk test . Respir Care 2003. ; 48 ( 8 ): 783 – 785 . [PubMed] [Google Scholar]
- 20. Miller MR , Hankinson J , Brusasco V , et al . Standardisation of spirometry . Eur Respir J 2005. ; 26 ( 2 ): 319 – 338 . [DOI] [PubMed] [Google Scholar]
- 21. Graham BL , Brusasco V , Burgos F , et al . 2017 ERS/ATS standards for single-breath carbon monoxide uptake in the lung . Eur Respir J 2017. ; 49 ( 1 ): 1600016 . [DOI] [PubMed] [Google Scholar]
- 22. Svenningsen S , Kirby M , Starr D , et al . Hyperpolarized (3) He and (129) Xe MRI: differences in asthma before bronchodilation . J Magn Reson Imaging 2013. ; 38 ( 6 ): 1521 – 1530 . [DOI] [PubMed] [Google Scholar]
- 23. Estepar RSJ , Ross JC , Krissian K , Schultz T , Washko GR , Kindlmann GL . Computational Vascular Morphometry for the Assessment of Pulmonary Vascular Disease Based on Scale-Space Particles . In: 2012 9th IEEE International Symposium on Biomedical Imaging (ISBI) , Barcelona, Spain . May 2–5, 2012 . Piscataway, NJ: : IEEE; , 2012. ; 1479 – 1482 . [DOI] [PMC free article] [PubMed] [Google Scholar]
- 24. Matheson AM , Cunningham RSP , Bier E , et al . Hyperpolarized 129Xe Pulmonary MRI and Asymptomatic Atrial Septal Defect . Chest 2022. ; 161 ( 4 ): e199 – e202 . [DOI] [PubMed] [Google Scholar]
- 25. McFann K , Baxter BA , LaVergne SM , et al . Quality of Life (QoL) Is Reduced in Those with Severe COVID-19 Disease, Post-Acute Sequelae of COVID-19, and Hospitalization in United States Adults from Northern Colorado . Int J Environ Res Public Health 2021. ; 18 ( 21 ): 11048 . [DOI] [PMC free article] [PubMed] [Google Scholar]
- 26. Rahaghi FN , Argemí G , Nardelli P , et al . Pulmonary vascular density: comparison of findings on computed tomography imaging with histology . Eur Respir J 2019. ; 54 ( 2 ): 1900370 . [DOI] [PMC free article] [PubMed] [Google Scholar]
- 27. Walsh CL , Tafforeau P , Wagner WL , et al . Imaging intact human organs with local resolution of cellular structures using hierarchical phase-contrast tomography . Nat Methods 2021. ; 18 ( 12 ): 1532 – 1541 . [DOI] [PMC free article] [PubMed] [Google Scholar]
- 28. Méndez R , Latorre A , González-Jiménez P , et al . Reduced Diffusion Capacity in COVID-19 Survivors . Ann Am Thorac Soc 2021. ; 18 ( 7 ): 1253 – 1255 . [DOI] [PMC free article] [PubMed] [Google Scholar]
- 29. Wang Z , Rankine L , Bier EA , et al . Using hyperpolarized 129Xe gas-exchange MRI to model the regional airspace, membrane, and capillary contributions to diffusing capacity . J Appl Physiol 2021. ; 130 ( 5 ): 1398 – 1409 . [DOI] [PMC free article] [PubMed] [Google Scholar]
- 30. Townsend L , Dowds J , O’Brien K , et al . Persistent Poor Health after COVID-19 Is Not Associated with Respiratory Complications or Initial Disease Severity . Ann Am Thorac Soc 2021. ; 18 ( 6 ): 997 – 1003 . [DOI] [PMC free article] [PubMed] [Google Scholar]
- 31. Ferrer M , Villasante C , Alonso J , et al . Interpretation of quality of life scores from the St George’s Respiratory Questionnaire . Eur Respir J 2002. ; 19 ( 3 ): 405 – 413 . [DOI] [PubMed] [Google Scholar]
- 32. Pinto LM , Gupta N , Tan W , et al . Derivation of normative data for the COPD assessment test (CAT) . Respir Res 2014. ; 15 ( 1 ): 68 . [DOI] [PMC free article] [PubMed] [Google Scholar]
- 33. Currow DC , Plummer JL , Crockett A , Abernethy AP . A community population survey of prevalence and severity of dyspnea in adults . J Pain Symptom Manage 2009. ; 38 ( 4 ): 533 – 545 . [DOI] [PubMed] [Google Scholar]
- 34. Ackermann M , Verleden SE , Kuehnel M , et al . Pulmonary Vascular Endothelialitis, Thrombosis, and Angiogenesis in Covid-19 . N Engl J Med 2020. ; 383 ( 2 ): 120 – 128 . [DOI] [PMC free article] [PubMed] [Google Scholar]
- 35. Brito-Azevedo A , Pinto EC , de Cata Preta Corrêa GA , Bouskela E . SARS-CoV-2 infection causes pulmonary shunt by vasodilatation . J Med Virol 2021. ; 93 ( 1 ): 573 – 575 . [DOI] [PMC free article] [PubMed] [Google Scholar]
- 36. Post-COVID Conditions: Centers for Disease Control and Prevention . https://www.cdc.gov/coronavirus/2019-ncov/long-term-effects/index.html. Updated September 16, 2021. Accessed January 26, 2022 .
- 37. Soriano JB , Murthy S , Marshall JC , Relan P , Diaz JV ; WHO Clinical Case Definition Working Group on Post-COVID-19 Condition . A clinical case definition of post-COVID-19 condition by a Delphi consensus . Lancet Infect Dis 2022. ; 22 ( 4 ): e102 – e107 . [DOI] [PMC free article] [PubMed] [Google Scholar]
- 38. National Institute of Health and Care Excellence . COVID-19 Rapid Guideline: Managing COVID-19 . London, England: : National Institute of Health and Care Excellence; , 2021. . [PubMed] [Google Scholar]
- 39. Stanojevic S , Graham BL , Cooper BG , et al . Official ERS technical standards: Global Lung Function Initiative reference values for the carbon monoxide transfer factor for Caucasians . Eur Respir J 2017. ; 50 ( 3 ): 1700010 . [DOI] [PubMed] [Google Scholar]