Abstract
Background and Objectives
The anti-CD20 antibody ofatumumab is an efficacious therapy for multiple sclerosis (MS) through depletion of B cells. The purpose of this study was to examine the derivative effects of B cell depletion on the peripheral immune system and a direct treatment effect on T cells expressing CD20.
Methods
Frequency and absolute numbers of peripheral leukocytes of treatment-naive patients with relapsing-remitting MS (RRMS) and patients treated with ofatumumab for a mean of 482 days were assessed in this observational study by flow cytometry. In addition, effector function and CNS migration of T cells using a human in vitro blood-brain barrier (BBB) assay were analyzed.
Results
This study showed that ofatumumab treatment of patients with RRMS increased the control of effector T cells and decreased T cell autoreactivity. It also showed that ofatumumab reduced the level of peripheral CD20+ T cells and that the observed decrease in CNS-migratory capacity of T cells was caused by the depletion of CD20+ T cells. Finally, our study pointed out a bias in the measurement of CD20+ cells due to a steric hindrance between the treatment antibody and the flow cytometry antibody.
Discussion
The substantial ofatumumab-induced alteration in the T cell compartment including a severely decreased CNS-migratory capacity of T cells could partly be attributed to the depletion of CD20+ T cells. Therefore, we propose that depletion of CD20+ T cells contributes to the positive treatment effect of ofatumumab and suggests that ofatumumab therapy should be considered a B cell and CD20+ T cell depletion therapy.
Classification of Evidence
This study provides Class IV evidence that compared with treatment-naive patients, ofatumumab treatment of patients with RRMS decreases peripheral CD20+ T cells, increases effector T cell control, and decreases T cell autoreactivity.
Multiple sclerosis (MS) is an inflammatory and demyelinating disease of the CNS.1 The immunopathogenesis of MS is complex and involves cells of both the innate and adaptive immune system including monocytes,2 NK cells,3 dendritic cells (DCs),4 B cells,5,6 and CD4+ and CD8+ T cells.7 In the periphery, disease has been associated with a redistribution of CD4+ T cells with an increased frequency of inflammatory effector T cells8,9 and a reduction in either effector function or incidence of regulatory T cells10,11 shifting the balance from control to inflammation. A similar shift is observed in the ratio between T follicular helper (Tfh) cells and T follicular regulatory (Tfr) cells in favor of Tfh cells.12 Furthermore, the suppressive function of Tfr cells in patients with MS is decreased.13 Abnormalities in the B cell compartment of patients with MS include an increased production of proinflammatory cytokines14-17 and a reduced suppressive function of regulatory B cells.18-21 These changes disrupt the natural balance between the T- and B cell compartment with potential increased activation of T cells by B cell–produced cytokines and antigen presentation and vice versa by increased B cell activation and antibody production by Tfh cells. In the CNS, disease activity has been associated with increased recruitment of inflammatory CD4+ and CD8+ T cells as well as B cell recruitment and immunoglobulin production.6 CNS-infiltrating B and T cells are involved in blood-brain barrier (BBB) disruption, demyelination, activation of glial cells,22,23 and the formation of lymphoid follicle–like structures in chronically inflamed CNS.5
To control disease progression in patients with MS, numerous therapies to dampen immune responses have therefore been developed. Therapy-based antibodies targeting the CD20 molecule on the surface of B cells have proven highly efficacious.24-30 The anti-CD20 antibody armamentarium for MS includes the 3 antibodies rituximab, ocrelizumab, and ofatumumab. Binding of these anti-CD20 antibodies to their target cells induces cell death through antibody-dependent cellular cytotoxicity and complement-dependent cellular cytotoxicity. Although the goal of anti-CD20 antibody therapies is depletion of peripheral B cells, studies have indicated that targeting the B cell compartment also affects the dynamics of the T cell population.31-33 In addition to this inevitable T cell effect caused by the diminished B:T cell interaction following depletion of B cells, a direct effect on the T cell population may play a role in the positive treatment effect of anti-CD20 antibody therapies through depletion of the smaller T cell population expressing intermediate levels of CD20.
The effect of anti-CD20 antibody therapies on the B cell compartment has been investigated in numerous studies; however, the importance of the treatment effect on the T cell population has not been thoroughly analyzed. To clarify the treatment effect on T cells, we therefore investigated ofatumumab-induced changes in the T cell compartment and analyzed a possible bias in the detection of CD20 expression on the surface of both B and T cells from treated patients, using commercially available anti-CD20 antibodies. The primary research question addressed in this study is as follows: what are the effects of ofatumumab treatment on the T cell population of patients with relapsing-remitting MS (RRMS)?
Methods
Study Population
In this case-control observational study, we included 20 treatment-naive patients with RRMS (mean age = 35 years, SD = 7; male/female = 2/18) and 16 patients treated with ofatumumab (Arzerra) (mean age = 42 years, SD = 11; male/female = 2/14) for a mean of 482 days (range 190–778 days); time since last infusion was 116 days (mean; range 9–120 days). The treatment regimen included a first infusion of 300 mg ofatumumab IV and a second infusion of 300 mg given 2 weeks after the first. Thereafter, the patients were given 600 mg every 6th month. Off-label IV ofatumumab was used,34 and the study was performed from September 2016 to December 2017. Of the ofatumumab-treated patients, 4 previously received fingolimod, 7 natalizumab, and 5 dimethyl fumarate. All untreated patients were treatment naive except one, who previously received teriflunomide. All patients were diagnosed with RRMS based on the 2010 revised McDonald criteria.35,36 There was no significant difference in age (p = 0.093) or sex (p = 0.79) distribution between the 2 groups. The relapse frequency (number of relapses within the last year) of the untreated patients was 1.0 (median; range 0–2) and 0.0 (median; range 0–2) of the ofatumumab-treated patients. Disease severity (Expanded Disability Status Scale score) was 1.75 (median; range 0–3.5) of the untreated patients and 3.75 (median; range 1.5–7.0) of the ofatumumab-treated patients.
Standard Protocol Approvals, Registrations, and Patient Consents
All participants gave informed written consent to participation. The study was approved by the regional scientific ethics committee (protocol number H-16047666).
Flow Cytometric Analysis of Freshly Isolated Peripheral Blood Mononuclear Cells
From 20 treatment-naive patients and 16 ofatumumab-treated patients, venous blood was collected, and peripheral blood mononuclear cells (PBMCs) were isolated by density-gradient centrifugation using Lymphoprep (Axis-Shield, Oslo, Norway) and washed twice in cold phosphate buffered saline/2 mM ethylenediaminetetraacetic acid. PBMCs were instantly incubated with Fc receptor blocking reagent (Miltenyi Biotec, Bergisch Gladbach, Germany) to prevent nonspecific Ab binding and thereafter stained in phosphate buffered saline/2% fetal bovine serum/0.02% NaN3 with a combination of fluorochrome-conjugated Ab against (conjugate; clone) CD3 (FITC, APC, APC/Cy7, PE/Cy7, and PerCP/Cy5.5; UCHT1), CD8 (BV605; RPA-T8), CD11c (PE/Cy7; Bu15), CD14 (BV605; M5E2), CD16 (BV421; 3G8), CD20 (PE/Cy7; 2H7), CD25 (PE; M-A251), CD49d (BV605; 9F10), CD127 (BV421; A019D5), CXCR3 (BV421; G025H7), CXCR5 (APC; J252D4), CCR6 (PerCP/Cy5.5; G034E3), and PD-1 (BV605; EH12), all from BioLegend (CA), CD56 (PE/Cy7; CMSSB) from eBioscience (Thermo Fisher, MA), BDCA-2 (FITC; AC144) from Miltenyi Biotec (Bergisch Gladbach, Germany), and CD4 (APC/AF750; S3.5) and CD19 (APC/AF750; SJ25-C1) from Invitrogen (MA). Isotype-matched controls were used to correct for nonspecific Ab binding and spectral overlap, where appropriate. TruCount staining of whole blood to measure absolute cell count was performed using BD Multitest 6-color TBNK Reagent according to the manufacturer (BD Biosciences, CA). Data were acquired on a FACS Canto II flow cytometer (BD Biosciences), and data analysis was performed using the software FlowJo (TreeStar, OR).
Intracellular Staining of CD20
Following cell surface staining of PBMCs using fluorochrome-conjugated Ab against CD3 (APC; UCHT1), CD19 (APC/Cy7; HIB19), and CD20 (PE/Cy7; 2H7), all from BioLegend, cells were fixed at 37°C for 15 minutes using Fixation Buffer (BioLegend) followed by permeabilization for 60 minutes at −20°C using True-Phos Permeabilization Buffer (BioLegend). Background staining was then reduced by incubation at RT for 10 minutes with mouse serum (Dako Agilent, CA) followed by 30-minute incubation at RT with either an anti-CD20 antibody recognizing the intracellular part of CD20 (FITC, L26; eBiosciences Thermo Fisher) or a corresponding isotype antibody. Data were acquired on a FACS Canto II flow cytometer, and data analysis was performed using the software FlowJo.
Cytokine Production by T Cells
To measure cytokine production by T cells, PBMCs from 12 treatment-naive patients and 8 ofatumumab-treated patients were thawed and either stimulated for 6 hours with Dynabeads Human T-Activator CD3/CD28 beads (Gibco, Waltham, MA) at a bead:cell ratio of 1:3 or for 48 hours with 30 μg/mL myelin basic protein (MBP; HyTest, Turku, Finland) and 10 μg/mL myelin oligodendrocyte glycoprotein, MOG (AnaSpec Inc, CA). For the last 6 hours of the stimulation periods, 5 μg/mL brefeldin A (Sigma-Aldrich, MO) was added to the cell cultures. The cells were thereafter stained with fluorochrome-conjugated Ab against TCRαβ (BV605, APC; IP26), CD4 (BV421; OKT4), and CD8 (APC/Cy7; RPA-T8), all from BioLegend, and then fixed for 20 minutes at RT using Fixation buffer and washed twice in Permeabilization Wash Buffer, both from BioLegend. Finally, cells were intracellularly stained with fluorochrome-conjugated Ab against IFN-γ (PerCP/Cy5.5, PE/Cy7; B27), GM-CSF (APC, PE; BVD2-21C11), IL-17 (AF88, PerCP/Cy5.5; BL168), TNFα (AF488; Mab11), or corresponding isotype controls, all from BioLegend. Data were acquired on a FACS Canto II flow cytometer, and data analysis was performed using the software FlowJo.
In Vitro BBB Assay
The membrane of transwell inserts (CellQuart 12-well cell culture inserts with 3.0-μm pore polyester membrane; SABEU, Northeim, Germany) was coated on both sides with 20 μg/mL human fibronectin (Sigma, Merck, MO) at 37°C, 5% CO2 for 2 hours. Thereafter, the fibronectin was removed, and inserts were left to dry for 45 minutes. The inserts were inverted, and 106,000 human brain astrocytes (95,000 astrocytes/cm2; Gibco, Thermo Fisher) in astrocyte medium (Gibco, Thermo Fisher) were added to the external side of the membrane. After 3-hour incubation at 37°C, 5% CO2 astrocyte medium was added to wells of 12-well plates, and the inserts were reverted into normal position and placed in the well. Astrocyte medium was then added to the upper compartment of the inserts, and the astrocytes were incubated for 3 days at 37°C, 5% CO2. All astrocyte medium was removed, and 106,000 human brain microvascular endothelial cells (HBMECs; 95,000 HBMEC/cm2; PELOBiotech, Martinsried, Germany) in HBMEC medium (PELOBiotech) were added to the upper compartment. HBMEC medium was added to the wells and incubated for additionally 2 days at 37°C, 5% CO2. In this way, astrocytes grew into a monolayer on the external side and HBMECs into a monolayer on the internal side of the transwell insert. The quality of the coculture was monitored by measuring the transendothelial electrical resistance (TEER value). Transmigration experiments were performed when high, stable resistance measurements indicated a confluent cell layer; i.e., a TEER value of 40 Ω × cm2 when background was subtracted.
To induce inflammation of the BBB, 100 U/mL TNFα and IFN-γ (R&D Systems, MN) was added to the upper compartment 24 hours before performing the migration assay. Thereafter, the supernatant was discarded, and 700,000 purified T cells in Roswell Park Memorial Institute medium (RPMI) (Gibco, Thermo Fisher) were transferred to the upper compartment from 12 treatment-naive patients or 11 ofatumumab-treated patients. The T cells were purified from PBMCs using a human T cell isolation kit from Stem Cell Technologies (Vancouver, Canada). To the lower compartment, RPMI supplemented with B-27 (Gibco, Thermo Fisher) was added with or without 1,000 ng/mL CXCL10 (R&D systems) and 1,000 ng/mL CXCL13 (BioLegend) and incubated for 5 hours at 37°C, 5% CO2. As a control, 700,000 T cells were also added to 1 well at the lower compartment. After migration, a standardized amount of Flow-Count Fluorospheres (Beckman Coulter, CA) was added to the lower compartment of each well. Migrated cells plus Flow-Count Fluorospheres were harvested and stained for flow cytometry as described above using fluorochrome-conjugated Ab against CD3 (AF488; UCHT1), CD4 (PerCP; SK3), CD8 (BV421; RPA-T8), and CD20 (PE/Cy7; 2H7), all from BioLegend, and the number and percent of migrated cells were calculated:
 |
 |
CD20 Antibody Steric Hindrance Assay
PBMCs were incubated with an increasing amount of ofatumumab, rituximab, or ocrelizumab ranging from 0 to 320 μg/mL for 25 minutes. As a control, PBMCs were also incubated with the same concentrations of the unstained anti-CD20 antibody used for flow cytometry. Thereafter, cells were stained for flow cytometry using the fluorochrome-conjugated Ab against CD3 (APC; UCHT1), CD19 (APC/Cy7; HIB19), and CD20 (PE/Cy7; 2H7), all from BioLegend, and a blocking effect was analyzed on a FACS Canto II.
Statistical Analysis
For analysis of sex differences between groups, a χ2 test was performed. For comparison of age and cell populations between groups, the Mann-Whitney U test was applied. Correlations were assessed using Spearman rank correlation analysis. A significance level <0.05 was considered statistically significant. The study was exploratory and descriptive, and correction for multiple comparisons was not feasible.
STROBE Guidelines
For this article, the STROBE reporting guidelines for observational studies were used.37
Data Availability
Data are available in an anonymized form and can be shared by request form any qualified investigator. Sharing requires approval of a data transfer agreement by the Danish Data Protection Agency.
Results
Ofatumumab Efficiently Depletes Peripheral B Cells in Patients With MS
To investigate the effect of ofatumumab treatment on the peripheral pool of immune cells in patients with RRMS, we analyzed freshly isolated PBMCs from 16 patients treated with ofatumumab for a mean of 482 days (range 190–778 days) and 20 treatment-naive patients by flow cytometry.
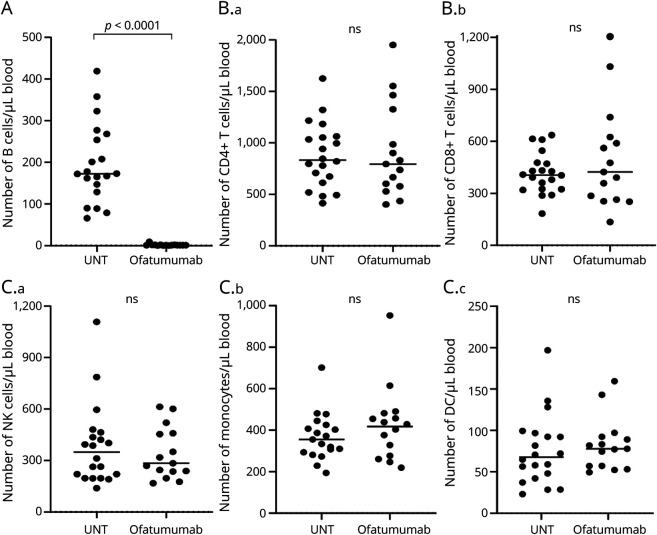
As expected, this showed an efficient depletion of CD19+ B cells following ofatumumab treatment (p < 0.0001; Figure 1A). In contrast, no change in absolute counts of CD4+ and CD8+ T cells (Figure 1B), or of NK cells, monocytes, and DCs, was observed (Figure 1C).
Figure 1. Ofatumumab Efficiently Depletes Peripheral B Cells in Patients With MS.
(A–C) Absolute numbers of CD19+ B cells (A), CD4+ T cells and CD8+ T cells (B.a–B.b), and CD56+ NK cells, CD14+ monocytes, and dendritic cells, DCs (C.a–C.d), in the blood of 20 treatment-naive patients with RRMS (UNT) and 16 ofatumumab-treated patients. The mean value is 429 shown for all groups analyzed. MS = multiple sclerosis; RRMS = relapsing-remitting MS.
Ofatumumab Does Not Influence the Frequency or Number of DCs or NK Cell Subpopulations
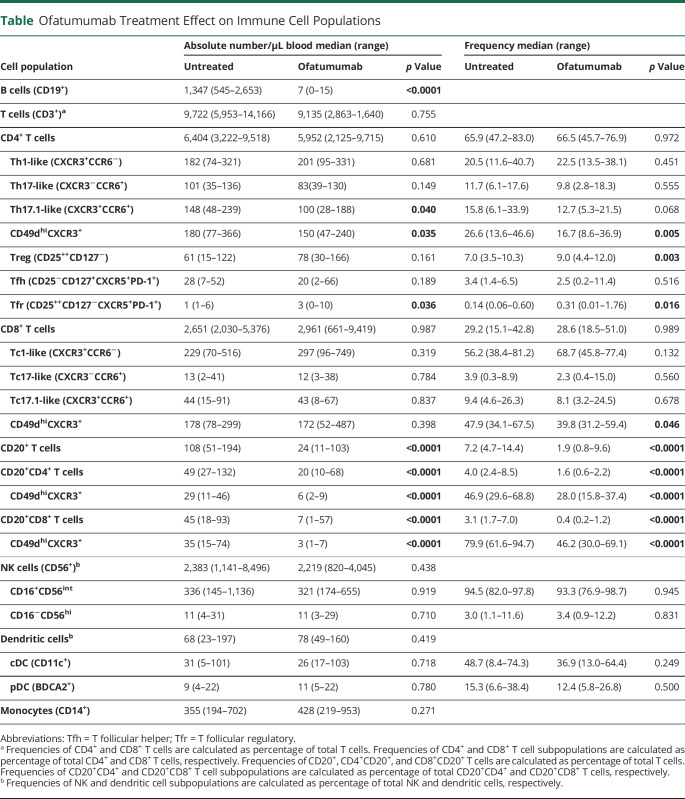
No difference in the frequency or absolute number of CD3−CD19−CD56− conventional DCs cDC (CD11c+) or plasmacytoid DC pDC (BDCA2+) was found between untreated and ofatumumab-treated patients with MS (Table). Measuring NK cell subpopulations also did not show any differences in the frequency or absolute number of the 2 subpopulations' CD16+CD56int or CD16−CD56hi NK cells between groups (Table).
Table.
Ofatumumab Treatment Effect on Immune Cell Populations
Ofatumumab Increases the Control of Effector T Cells in Patients With MS
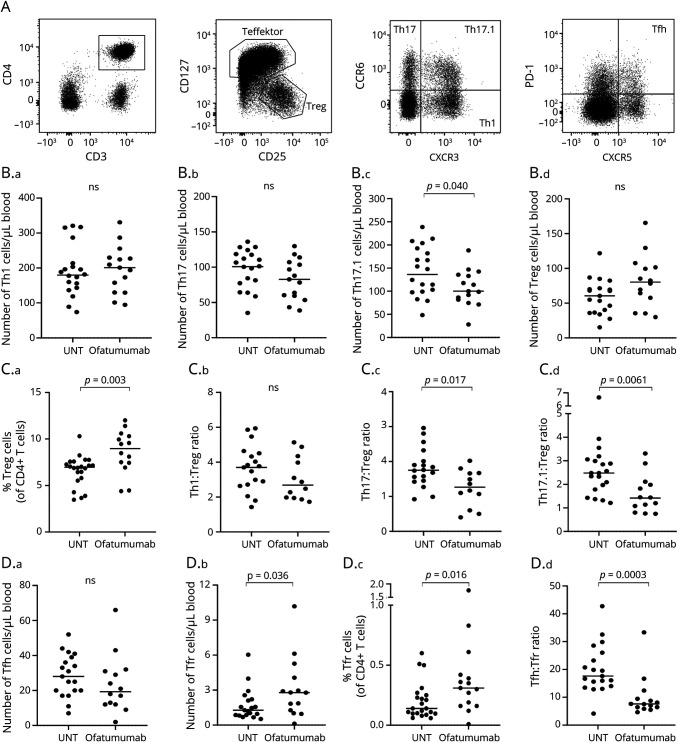
To analyze the effect of ofatumumab on T cell subpopulations, we measured the frequency and absolute number of the proinflammatory CD4+ T cell effector (CD25−CD127+) subpopulations Th1-like (CXCR3+CCR6−), Th17-like (CXCR3−CCR6+), and Th17.1-like (CXCR3+CCR6+); see Figure 2A for gating examples. Except for a decrease in the number of Th17.1 cells from ofatumumab-treated patients (p = 0.040), no changes were found (Figure 2B and Table). Analyzing CD4+ T regulatory (Treg) cells (CD25+CD127−) showed an increase in the frequency of Treg cells in the blood of ofatumumab-treated patients (p = 0.003; Figure 2C) and furthermore a reduced Th17:Treg and Th17.1:Treg cell ratio (p = 0.017, p = 0.0061; Figure 2C). Analyzing Tfh cells (CD25−CD127+CXCR5+PD-1+) and Tfr cells (CD25+CD127−CXCR5+PD-1+) showed an increased number and frequency of Tfr cells (p = 0.036, p = 0.016; Figure 2D) as well as a decrease in the Tfh:Thr ratio (p = 0.0003; Figure 2D) in the blood of ofatumumab-treated patients. Overall, this suggests that ofatumumab induces an environment of increased control of effector T cells. No change in the CD8+ T cell effector subpopulations Tc1-like (CXCR3+CCR6−), Tc17-like (CXCR3−CCR6+), and Tc17.1-like (CXCR3+CCR6+) (Table) or the Tc1:Treg, Tc17:Treg, Tc17.1:Treg ratios was found.
Figure 2. Ofatumumab Increases the Control of Effector T Cells in Patients With MS.
(A) Flow cytometry dot plot example of gating strategies. CD4+ effector T cells were defined as CD25−CD127+ and further subdivided into Th-like cells according to CXCR3 and CCR6 expression or CXCR5+PD-1+ Tfh cells. CD4+ regulatory T cells were defined as CD25+CD127− and further subdivided into Tfr cells according to expression of CXCR5 and PD-1. (B.a–d) Absolute number of Th1-like cells (B.a), Th17-like cells (B.b), Th17.1-like cells (B.c) and Treg cells (B.d), and (C.a–d) frequency of Treg cells in the blood of 20 treatment-naive patients with RRMS (untreated [UNT]) and 16 ofatumumab-treated patients. (C.a–d) Ratios between Treg cells (C.a) and Th1-like cells (C.b), Th17-like cells (C.c), and Th17.1-like cells (C.d) of UNT and ofatumumab-treated patients with RRMS. (D.a–d) Absolute number and frequency of Tfh cells (D.a) and Tfr cells (D.b) and the ratio between Tfh (D.c) and Tfr (D.d) cells. All ratios are calculated using the absolute cell counts. The mean value is shown for all groups analyzed. MS = multiple sclerosis; RRMS = relapsing-remitting MS.
Ofatumumab Decreases T Cell Reactivity in Patients With MS
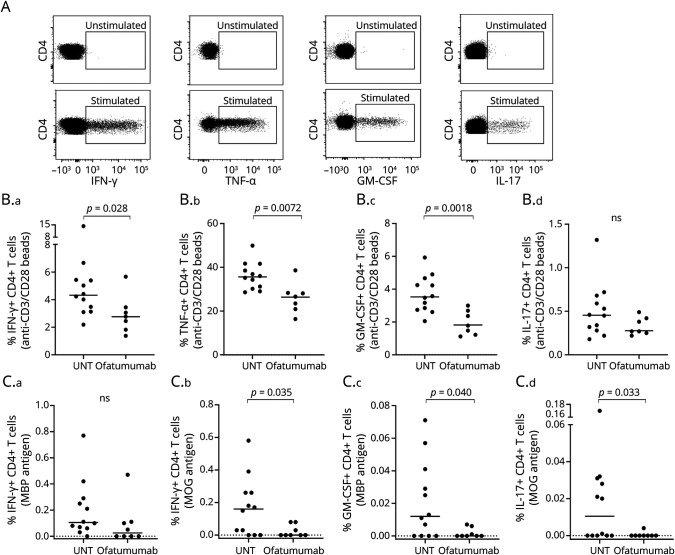
We next analyzed T cell reactivity and production of proinflammatory cytokines. For this, PBMCs were stimulated for 6 hours with a polyclonal stimulus (anti-CD3/CD28 beads), and the production of IFN-γ, TNFα, GM-CSF, and IL-17 was measured by flow cytometry; see Figure 3A for gating examples. This showed a decreased capacity of CD4+ T cells from ofatumumab-treated patients to produce IFN-γ (p = 0.028), TNFα (p = 0.0072), and GM-CSF (p = 0.0018; Figure 3B). To determine the reactivity of T cells toward myelin antigens presented by antigen-presenting cells (APCs) following ofatumumab treatment, PBMCs from untreated and ofatumumab-treated patients were stimulated for 48 hours with MBP and myelin oligodendrocyte glycoprotein (MOG), and the production of IFN-γ, GM-CSF, and IL-17 was measured. This showed a decrease in CD4+ T cells from ofatumumab-treated patients producing IFN-γ (p = 0.035; MOG antigen), GM-CSF (p = 0.040; MBP antigen), and IL-17 (p = 0.033; MOG antigen) (Figure 3C).
Figure 3. Ofatumumab Decreases T Cell Reactivity in Patients With MS.
(A) Flow cytometry dot plot examples of IFN-γ, TNFα, GM-CSF, and IL-17 production in T cells stimulated with anti-CD3/CD28 beads. (B.a–d) Frequency of CD4+ T cells producing IFN-γ (B.a), TNFα (B.b), GM-CSF (B.c), and IL-17 (B.d) in response to anti-CD3/CD28 beads in untreated (UNT) and ofatumumab-treated patients with RRMS. (C.a–d) Frequency of CD4+ T cells producing IFN-γ (C.a–b), GM-CSF (C.c), and IL-17 (C.d) in response to myelin basic protein, MBP, or MOG. The mean value is shown for all groups analyzed. MBP = myelin basic protein; MOG = myelin oligodendrocyte glycoprotein; MS = multiple sclerosis; RRMS = relapsing-remitting MS.
Ofatumumab Reduces the Level of Peripheral CD20+ T Cells in Patients With MS
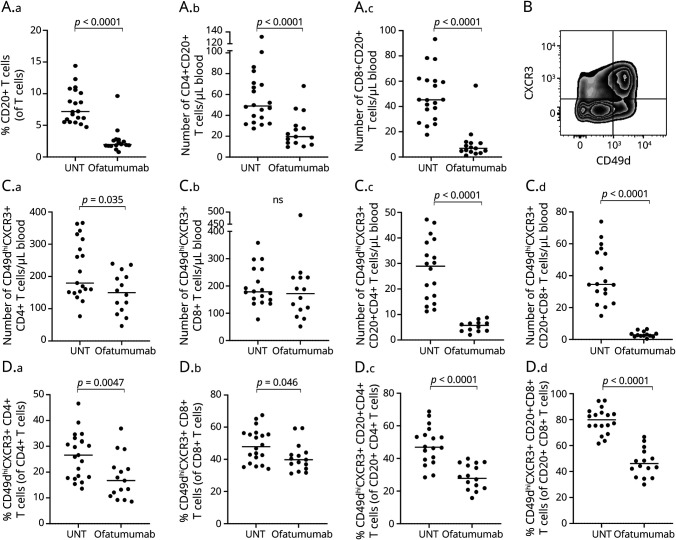
Besides B cells, a small population of T cells express CD20 on their cellular surface although at lower levels than found on B cells.38 Analyzing a possible depletion of these CD20+ T cells following ofatumumab treatment showed a reduction both in the frequency and absolute number of CD4+ (p < 0.0001) and CD8+ (p < 0.0001) CD20+ T cells (Figure 4A and Table). Also, we did not find a correlation between the number of CD20+ T cells and time since last treatment (p = 0.97, rs = 0.01).
Figure 4. CD20+ T Cell Depletion and Expression of Migration Markers in T Cells From Patients With MS.
(A.a–c) Frequency of CD20+ T cells (A.a) and absolute numbers of CD4+CD20+ T cells (A.b) and CD8+CD20+ T cells (A.c) in untreated (UNT) and ofatumumab-treated patients with RRMS. (B) Flow cytometry dot plot example of the gating strategy used to define CD49dhiCXCR3+ T cells. (C.a–d, D.a–d) Absolute number and frequency of CD49dhiCXCR3+ CD4+ T cells, CD8+ T cells, CD4+CD20+ T cells, and CD8+CD20+ T cells in untreated (UNT) and ofatumumab-treated patients with RRMS. The mean value is shown for all groups analyzed. MS = multiple sclerosis; RRMS = relapsing-remitting MS.
Ofatumumab Decreases Migration of CD20+ T Cells in Patients With MS
Migration of peripheral T cells to the CNS is central to the pathogenesis of MS, a process in which expression of the chemokine receptor CXCR3 and adhesion molecule VLA-4 (CD49d) on the T cell surface is essential; see Figure 4B for gating example. Measuring the absolute number and frequency of peripheral T cells and CD20+ T cells expressing CXCR3 and a high level of CD49d showed a great reduction in both numbers and frequency of CXCR3+CD49dhi T cells in the CD20+ population from patients treated with ofatumumab (p < 0.0001, CD4+CD20+ T cells; p < 0.0001, CD8+CD20+ T cells), an effect not as strongly found in the broad T cell population (Figure 4, C–D).
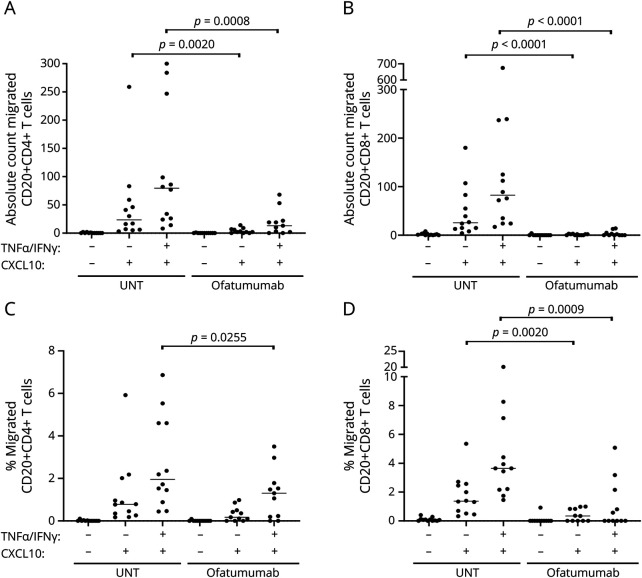
To further investigate the CNS-migratory potential of peripheral T cells from patients with MS treated with ofatumumab, we applied purified T cells to an in vitro BBB assay based on a coculture of primary human astrocytes and primary HBMECs grown in a Boyden chamber. In the setup applied, T cells were challenged with both a noninflamed and an inflamed BBB (prestimulated for 24 hours with TNFα and IFN-γ), and the chemokine CXCL10 was used as a chemoattractant. This showed no difference in absolute numbers or frequencies of migrated CD4+ and CD8+ T cells between treatment-naive and ofatumumab-treated patients with MS (eFigure 1A–D, links.lww.com/NXI/A725). In contrast, the migration of CD20+CD4+ T cells and CD20+CD8+ T cells from ofatumumab-treated patients was severely reduced both in absolute numbers and frequencies, particularly when challenged with the inflamed BBB (Figure 5, A–D).
Figure 5. Ofatumumab Reduces In Vitro Migration of CD20+ T Cells in Patients With MS.
Absolute number (A and B) and frequency (C and D) of CD4+CD20+ T cells and CD8+CD20+ T cells migrated across an in vitro human BBB either noninflamed (−TNFα/IFN-γ) or inflamed (+TNFα/IFN-γ) and either with or without a chemoattractant (+/− CXCL10) applied to the assay. Compared are cells from untreated (UNT) and ofatumumab-treated patients with RRMS. The mean value is shown for all groups analyzed. BBB = blood-brain barrier; MS = multiple sclerosis; RRMS = relapsing-remitting MS.
Bias in the Measurement of CD20+ Cells Due to Steric Hindrance Between the Treatment Antibody and the Flow Cytometry Detection Antibody
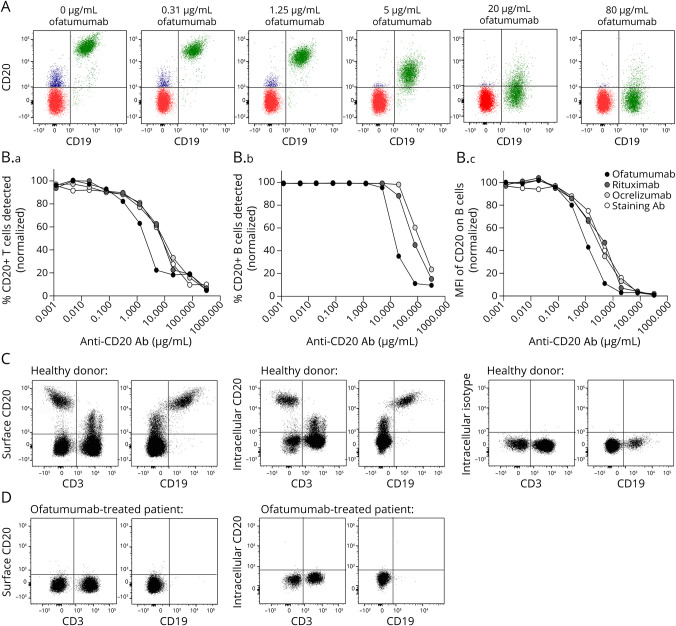
When CD20 on the surface of B and T cells is measured by flow cytometry, a possible blocking effect and hence a false-negative reading may be applied by the ofatumumab antibody. To analyze a possible steric hindrance effect between the treatment antibody bound to the cells and the flow cytometry antibody used for detection, we incubated PBMCs from healthy donors in an increasing concentration of the 3 commonly used therapeutic anti-CD20 antibodies; ofatumumab, ocrelizumab, and rituximab. Thereafter, PBMCs were stained for flow cytometry using the commercially available CD20 antibody clone 2H7. As shown in Figure 6, a blocking effect of CD20 on the surface of T cells preincubated with either of the 3 treatment antibodies is observed above antibody concentrations of 0.1 μg/mL and above 1–10 μg/mL for detection of CD20 on the surface of B cells (Figure 6B). The difference in detection threshold between T and B cells is likely due to their respective surface expression levels of CD20 (Figure 6A).
Figure 6. Bias in the Measurement of CD20+ Cells in Patients Treated With Ofatumumab.
(A) Flow cytometry overlay dot plots showing CD20+ B cells in green and CD20+ T cells in blue when cells were preincubated with 0–80 μg/mL ofatumumab. (B.a–c) Graphs showing the frequency and mean fluorescence intensity (MFI) of CD20+ T cells and CD20+ B cells detected by the anti-CD20 flow cytometry antibody after the cells were preincubated with either of the 3 treatment anti-CD20 antibodies ofatumumab, rituximab, and ocrelizumab. Normalized values are depicted. (C) Flow cytometry dot plot example of a healthy donor showing detection of CD20 on CD3+ T and CD19+ B cells using an anti-CD20 flow cytometry antibody targeting a surface epitope of CD20, clone 2H7, or an intracellular epitope of CD20, clone L26. An intracellular isotype control for staining was included. (D) Flow cytometry dot plot example of an ofatumumab-treated patient showing detection of CD20 using the anti-CD20 antibody targeting the surface epitope or intracellular epitope of CD20.
To verify that the reduced numbers of CD20+ T cells following ofatumumab therapy was due to depletion of the T cells and not to the bias of a possible steric hindrance between antibodies, we used a CD20+ antibody recognizing the intracellular part of the CD20 molecule (clone L26), hence being independent of a possible blocking effect of the extracellular part of CD20. Performing this analysis confirmed that CD20+ T cells are depleted in patients treated with ofatumumab (Figure 6, C–D).
Classification of Evidence
This study provides Class IV evidence that compared with treatment-naive patients, ofatumumab treatment of patients with RRMS decreases peripheral CD20+ T cells, increases effector T cell control, and decreases T cell autoreactivity.
Discussion
In this study, we investigated the effect of the anti-CD20 antibody therapy ofatumumab on peripheral immune cell populations in patients with RRMS. Anti-CD20 antibody therapies are developed to target peripheral B cells; in concordance, we confirmed an efficient depletion of the B cell population in patients treated with ofatumumab. CD20-targeting therapies reduce clinical relapses and MRI lesion activity,24,25,27,29,34,39 highlighting the importance of B cells in the immunopathogenesis of RRMS. However, the immune system is a complex network of interacting cells; depletion of one cell population inevitably affects the dynamics of the entire network. Investigating possible derivative effects of B cell depletion showed no change in absolute numbers of NK cells, DCs, or their subpopulations following ofatumumab treatment. In contrast, we found a substantial ofatumumab-induced alteration in the T cell compartment.
The pathogenesis of RRMS has been associated with a skewing in the T effector cell:T regulatory cell ratio in favor of loss of T effector cell control. In the current study, we showed that ofatumumab therapy primarily decreased the ratio between Th17.1-like and Treg cells and between Tfh and Tfr cells, reflecting a possible gain of T cell control. Th17.1-like cells have an enhanced potential to infiltrate the CNS where they produce high amounts of IFN-γ and GM-CSF9; furthermore, they have been associated with clinical disease activity in patients with RRMS.9 An imbalance between Tfh and Tfr cells as observed in patients with RRMS may increase activation of B cells and promote increased antibody production.12,40 Suppression of Th17.1-like cells and Tfh cells therefore may be beneficial for patients with RRMS and likely contribute to the positive treatment effect observed using anti-CD20 antibody therapies.
The effector function of proinflammatory T cells in the pathogenesis of MS includes production of proinflammatory cytokines. In accordance with a previous finding in patients with RRMS treated with the anti-CD20 antibody ublituximab,32 our study found a decreased frequency of CD4+ T cells producing IFN-γ, TNFα, GM-CSF, and IL-17. These observations indicate that ofatumumab therapy also has a positive effect on proinflammatory T cells through suppression of their effector function; these observations may reflect a direct effect of ofatumumab on proinflammatory T cells or the increased Treg cell control of effector T cells.
In addition to a possible derivative effect of B cell depletion on the activation and function of T cells in patients treated with anti-CD20 antibody therapies, previous studies have shown a direct effect of the anti-CD20 antibody therapies rituximab,41-43 ocrelizumab,33,44 and ublituximab32 on the T cell compartment through depletion of T cells expressing CD20. In concordance, we found that ofatumumab efficiently reduced the number and frequency of peripheral CD4+CD20+ and CD8+CD20+ T cells, with an almost complete depletion of CD8+CD20+ T cells as also observed in a previous study of rituximab.41 Previous findings show that the frequency of peripheral CD20+ T cells is increased in patients with RRMS,38,41 that CD20+ T cells are enriched in the CSF38 and present in white mater lesions of patients with MS,45 have a high reactivity to CNS antigens,38 are enriched in the myelin-specific CD8+ T cell population,46 and are associated with MS disease severity.38 Treatment-induced depletion of CD20+ T cells, in addition to the depletion of B cells, is therefore likely to contribute to the positive treatment effect of ofatumumab.
We have previously shown that CD20+ T cells are the main T cell population that produces IFN-γ, TNFα, and GM-CSF and that the majority of CD8+CD20+ T cells produce all 3 cytokines.38 The observation in the current study of a reduced frequency of T cells producing IFN-γ, TNFα, and GM-CSF may therefore in part be a direct consequence of ofatumumab-induced depletion of CD20+ T cells.
In patients with RRMS, activated pathogenic T and B cells migrate to the CNS where they induce inflammation and nervous tissue damage.6 To investigate the effect of ofatumumab on T cell migration, we measured the expression of the chemokine receptor CXCR3 and adhesion molecule VLA-4 (CD49d) involved in transmigration through the BBB. This only showed a small decrease in CXCR3+CD49dhi expression on T cells in general but a highly significant decrease on both CD4+CD20+ and CD8+CD20+ T cells. In line with this observation, we found that migration of CD20+ T cells, but not the general T cell population, through an in vitro BBB was also significantly suppressed. These data suggest that the CNS migration potential of the few CD20+ T cells left in the blood of ofatumumab-treated patients is severely compromised.
One important consideration when measuring CD20+ T cells is the possibility of a steric hindrance between the therapeutic antibody bound to the blood cells of the patient and the anti-CD20 antibody used for detection of the population by flow cytometry. This possible bias can affect measurement of both CD20+ T cells and B cells if CD20 is used to identify B cells. Examining this possibility showed that ofatumumab, rituximab, and ocrelizumab could block the binding of the anti-CD20 flow cytometry detection antibody on both T and B cells with the risk of a false-negative result. As the concentration of CD20 on the surface of B cells is far higher than on T cells, the blocking effect becomes evident on B cells at treatment antibody concentrations above 1–10 μg/mL and on T cells as low as 0.1 μg/mL. Studies of the pharmacokinetics of ocrelizumab indicate that mean maximum serum concentrations of ocrelizumab range from 131 to 213 μg/mL, and trough concentrations range from a mean of 0.6–1.0 μg/mL but may be as high as 12 μg/mL.47 Because both ocrelizumab and ofatumumab are IgG1 antibodies, they presumably have similar pharmacokinetics, and hence, the serum concentration measurements of ocrelizumab likely also apply to ofatumumab. To ensure that the observed decrease in numbers of CD20+ T cells measured in our current study was not caused by the blocking effect, we used an anti-CD20 antibody detecting the intracellular part of CD20, hence being independent of a possible blocking effect on the cell surface. This analysis confirmed that CD20+ T cells are indeed depleted in patients treated with ofatumumab. In addition, we did not find a correlation between the number of CD20+ T cells and days since last treatment, suggesting that CD20+ T cells can be detected even at the higher serum concentrations of ofatumumab found shortly after infusion.
Our study is subject to the limitation of a sample size as ofatumumab therapy in its IV formulation was withdrawn from the market. This excluded the possibility of a larger number of patients or inclusion of a replication cohort. Although only 16 ofatumumab-treated patients were included, our explorative study was thoroughly conducted and identified significant and potentially important mechanisms by which ofatumumab exerts its immunomodulatory effect. However, a larger subject cohort might have revealed additional effects and would have allowed for correction for multiple testing to reduce the risk of type I statistical errors. Another weakness of the study is the cross-sectional design. A prospective study with pretreatment and serial sampling on treatment as well as complementary MRI and CSF studies would yield additional important information regarding the mechanism of action of anti-CD20 therapy.
Altogether, our study demonstrates that ofatumumab treatment recovers the control of effector T cells and reduces the effector function of T cells and their migratory potential to the CNS. We also found that suppression of T effector cells was particularly pronounced in the T cell population expressing CD20. Considering the importance of CD20+ T cells in the pathogenesis of RRMS, the high efficacy of the anti-CD20 antibody therapies in reducing disease activity in patients with RRMS is likely to be mediated both by the depletion of B cells and derivative effects hereof and to the depletion of T cells expressing CD20. This suggestion is strengthened by a recent rituximab study in an experimental autoimmune encephalomyelitis (EAE) mouse model showing that rituximab was most effective in controlling EAE when the treatment induced a marked T cell depletion.48 Therefore, anti-CD20 antibody therapies may be classified as a B and T cell subset depletion therapy.
Acknowledgment
The authors acknowledge Lisbeth Stolpe for her excellent technical assistance.
Glossary
- BBB
blood-brain barrier
- DC
dendritic cell
- HBMEC
human brain microvascular endothelial cell
- MBP
myelin basic protein
- MOG
myelin oligodendrocyte glycoprotein
- MS
multiple sclerosis
- PBMC
peripheral blood mononuclear cell
- RRMS
relapsing-remitting MS
- TEER
transendothelial electrical resistance
- Tfh
T follicular helper
- Tfr
T follicular regulatory
Appendix. Authors
Contributor Information
Rikke Holm Hansen, Email: rikke.holm.hansen@regionh.dk.
Camilla Højgaard, Email: camillahoejgaard@gmail.com.
Cecilie Ammitzbøll, Email: cecilie.ammitzboell@regionh.dk.
Heinz Wiendl, Email: heinz.wiendl@ukmuenster.de.
Finn Sellebjerg, Email: sellebjerg@dadlnet.dk.
Study Funding
This work was supported by the Aase and Ejnar Danielsen Foundation, Læge Sofus Carl Emil Friis and Wife Olga Friis' Grant, the Jascha Foundation, the Toyota Foundation, the A.P. Møller Foundation, the Foundation for Research in Neurology, and the Research Board at Copenhagen University Hospital, Rigshospitalet.
Disclosure
Marina R. von Essen, Rikke H. Hansen, Camilla Højgaard, and Cecilie Ammitzbøll declare no conflict of interest. Finn Sellebjerg has served on scientific advisory boards for, served as consultant for, received support for congress participation, or received speaker honoraria from Alexion, Biogen, Bristol Myers Squibb, H. Lundbeck A/S, Merck, Novartis, Roche, and Sanofi Genzyme. His laboratory has received research support from Biogen, Merck, Novartis, Roche, and Sanofi Genzyme. Heinz Wiendl has received honoraria for acting as consultant or member of Scientific Advisory Boards from Actelion, Argenx, Biogen, Bristol Myers Squibb, EMD Serono, Genzyme, Idorsia, IGES, Immunic, Immunovant, Janssen, Johnson & Johnson, Merck Serono, Novartis, Roche Pharma AG, Sanofi-Aventis, and UCB as well as speaker honoraria and travel support from Alexion, Biogen, Biologix, Cognomed, F. Hoffmann-La Roche Ltd., Gemeinnützige Hertie-Stiftung, Merck, Novartis, Roche Pharma AG, Genzyme, TEVA, WebMD Global, Novartis, Roche, Sanofi, the Swiss MS Society, and UCB. Go to Neurology.org/NN for full disclosures.
References
- 1.Reich DS, Lucchinetti CF, Calabresi PA. Multiple sclerosis. N Engl J Med. 2018;378(2):169-180. [DOI] [PMC free article] [PubMed] [Google Scholar]
- 2.Giladi A, Wagner LK, Li H, et al. . Cxcl10(+) monocytes define a pathogenic subset in the central nervous system during autoimmune neuroinflammation. Nat Immunol. 2020;21(5):525-534. [DOI] [PubMed] [Google Scholar]
- 3.Mimpen M, Smolders J, Hupperts R, Damoiseaux J. Natural killer cells in multiple sclerosis: a review. Immunol Lett. 2020;222:1-11. [DOI] [PubMed] [Google Scholar]
- 4.Nuyts AH, Lee WP, Bashir-Dar R, Berneman ZN, Cools N. Dendritic cells in multiple sclerosis: key players in the immunopathogenesis, key players for new cellular immunotherapies? Mult Scler. 2013;19(8):995-1002. [DOI] [PubMed] [Google Scholar]
- 5.Cencioni MT, Mattoscio M, Magliozzi R, Bar-Or A, Muraro PA. B cells in multiple sclerosis–from targeted depletion to immune reconstitution therapies. Nat Rev Neurol. 2021;17(7):399-414. [DOI] [PubMed] [Google Scholar]
- 6.van Langelaar J, Rijvers L, Smolders J, van Luijn MM. B and T Cells driving multiple sclerosis: identity, mechanisms and potential triggers. Front Immunol. 2020;11:760. [DOI] [PMC free article] [PubMed] [Google Scholar]
- 7.Kaskow BJ, Baecher-Allan C. Effector T cells in multiple sclerosis. Cold Spring Harb Perspect Med. 2018;8(4):a029025. [DOI] [PMC free article] [PubMed] [Google Scholar]
- 8.Kalra S, Lowndes C, Durant L, et al. Th17 cells increase in RRMS as well as in SPMS, whereas various other phenotypes of Th17 increase in RRMS only. Mult Scler J Exp Transl Clin. 2020;6(1):2055217319899695. [DOI] [PMC free article] [PubMed] [Google Scholar]
- 9.van Langelaar J, van der Vuurst de Vries RM, Janssen M, et al. . T helper 17.1 cells associate with multiple sclerosis disease activity: perspectives for early intervention. Brain. 2018;141(5):1334-1349. [DOI] [PubMed] [Google Scholar]
- 10.Bar-Or A, Li R. Cellular immunology of relapsing multiple sclerosis: interactions, checks, and balances. Lancet Neurol. 2021;20(6):470-483. [DOI] [PubMed] [Google Scholar]
- 11.Kimura K. Regulatory T cells in multiple sclerosis. Clin Exp Neuroimmunol. 2020;11:148-155. [Google Scholar]
- 12.Puthenparampil M, Zito A, Pantano G, et al. Peripheral imbalanced TFH/TFR ratio correlates with intrathecal IgG synthesis in multiple sclerosis at clinical onset. Mult Scler. 2019;25(7):918-926. [DOI] [PubMed] [Google Scholar]
- 13.Dhaeze T, Peelen E, Hombrouck A, et al. Circulating follicular regulatory T cells are defective in multiple sclerosis. J Immunol. 2015;195(3):832-840. [DOI] [PubMed] [Google Scholar]
- 14.McWilliam O, Sellebjerg F, Marquart HV, von Essen MR. B cells from patients with multiple sclerosis have a pathogenic phenotype and increased LTalpha and TGFbeta1 response. J Neuroimmunol. 2018;324:157-164. [DOI] [PubMed] [Google Scholar]
- 15.Duddy M, Niino M, Adatia F, et al. Distinct effector cytokine profiles of memory and naive human B cell subsets and implication in multiple sclerosis. J Immunol. 2007;178(10):6092-6099. [DOI] [PubMed] [Google Scholar]
- 16.Bar-Or A, Fawaz L, Fan B, et al. . Abnormal B-cell cytokine responses a trigger of T-cell-mediated disease in MS?. Ann Neurol. 2010;67(4):452-461. [DOI] [PubMed] [Google Scholar]
- 17.Li R, Rezk A, Miyazaki Y, et al. Proinflammatory GM-CSF-producing B cells in multiple sclerosis and B cell depletion therapy. Sci Transl Med. 2015;7(310):310ra166. [DOI] [PubMed] [Google Scholar]
- 18.Cencioni MT, Ali R, Nicholas R, Muraro PA. Defective CD19+CD24(hi)CD38(hi) transitional B-cell function in patients with relapsing-remitting MS. Mult Scler. 2021;27(8):1187-1197. [DOI] [PubMed] [Google Scholar]
- 19.Knippenberg S, Peelen E, Smolders J, et al. . Reduction in IL-10 producing B cells (Breg) in multiple sclerosis is accompanied by a reduced naive/memory Breg ratio during a relapse but not in remission. J Neuroimmunol. 2011;239(1-2):80-86. [DOI] [PubMed] [Google Scholar]
- 20.Kim Y, Kim G, Shin HJ, et al. Restoration of regulatory B cell deficiency following alemtuzumab therapy in patients with relapsing multiple sclerosis. J Neuroinflammation. 2018;15(1):300. [DOI] [PMC free article] [PubMed] [Google Scholar]
- 21.Okada Y, Ochi H, Fujii C, et al. Signaling via toll-like receptor 4 and CD40 in B cells plays a regulatory role in the pathogenesis of multiple sclerosis through interleukin-10 production. J Autoimmun. 2018;88:103-113. [DOI] [PubMed] [Google Scholar]
- 22.Brück W. The pathology of multiple sclerosis is the result of focal inflammatory demyelination with axonal damage. J Neurol. 2005;252(suppl 5):v3-v9. [DOI] [PubMed] [Google Scholar]
- 23.Zéphir H. Progress in understanding the pathophysiology of multiple sclerosis. Rev Neurol (Paris). 2018;174(6):358-363. [DOI] [PubMed] [Google Scholar]
- 24.Hauser SL, Waubant E, Arnold DL, et al. B cell depletion with rituximab in relapsing-remitting multiple sclerosis. N Engl J Med. 2008;358(7):676-688. [DOI] [PubMed] [Google Scholar]
- 25.Bar-Or A, Calabresi PA, Arnold D, et al. . Rituximab in relapsing-remitting multiple sclerosis: a 72-week, open-label, phase I trial. Ann Neurol. 2008;63(3):395-400. [DOI] [PubMed] [Google Scholar]
- 26.Hawker K, O'Connor P, Freedman MS, et al. Rituximab in patients with primary progressive multiple sclerosis: results of a randomized double-blind placebo-controlled multicenter trial. Ann Neurol. 2009;66(4):460-471. [DOI] [PubMed] [Google Scholar]
- 27.Kappos L, Li D, Calabresi PA, et al. Ocrelizumab in relapsing-remitting multiple sclerosis: a phase 2, randomised, placebo-controlled, multicentre trial. Lancet. 2011;378(9805):1779-1787. [DOI] [PubMed] [Google Scholar]
- 28.Montalban X, Hauser SL, Kappos L, et al. Ocrelizumab versus placebo in primary progressive multiple sclerosis. N Engl J Med. 2017;376(3):209-220. [DOI] [PubMed] [Google Scholar]
- 29.Hauser SL, Bar-Or A, Comi G, et al. Ocrelizumab versus interferon beta-1a in relapsing multiple sclerosis. N Engl J Med. 2017;376(3):221-234. [DOI] [PubMed] [Google Scholar]
- 30.Fox E, Lovett-Racke AE, Gormley M, et al. A phase 2 multicenter study of ublituximab, a novel glycoengineered anti-CD20 monoclonal antibody, in patients with relapsing forms of multiple sclerosis. Mult Scler. 2021;27(3):420-429. [DOI] [PMC free article] [PubMed] [Google Scholar]
- 31.Cross AH, Stark JL, Lauber J, Ramsbottom MJ, Lyons JA. Rituximab reduces B cells and T cells in cerebrospinal fluid of multiple sclerosis patients. J Neuroimmunol. 2006;180(1-2):63-70. [DOI] [PMC free article] [PubMed] [Google Scholar]
- 32.Lovett-Racke AE, Yang Y, Liu Y, et al. . B cell depletion changes the immune cell profile in multiple sclerosis patients: one-year report. J Neuroimmunol. 2021;359:577676. [DOI] [PubMed] [Google Scholar]
- 33.Fernández-Velasco JI, Kuhle J, Monreal E, et al. . Effect of ocrelizumab in blood leukocytes of patients with primary progressive MS. Neurol Neuroimmunol Neuroinflamm. 2021;8(2):e940. [DOI] [PMC free article] [PubMed] [Google Scholar]
- 34.Sorensen PS, Lisby S, Grove R, et al. Safety and efficacy of ofatumumab in relapsing-remitting multiple sclerosis: a phase 2 study. Neurology. 2014;82(7):573-581. [DOI] [PubMed] [Google Scholar]
- 35.Polman CH, Reingold SC, Banwell B, et al. Diagnostic criteria for multiple sclerosis: 2010 revisions to the McDonald criteria. Ann Neurol. 2011;69(2):292-302. [DOI] [PMC free article] [PubMed] [Google Scholar]
- 36.McDonald WI, Compston A, Edan G, et al. Recommended diagnostic criteria for multiple sclerosis: guidelines from the International Panel on the diagnosis of multiple sclerosis. Ann Neurol. 2001;50(1):121-127. [DOI] [PubMed] [Google Scholar]
- 37.von Elm E, Altman DG, Egger M, Pocock SJ, Gøtzsche PC, Vandenbroucke JP. The Strengthening the Reporting of Observational Studies in Epidemiology (STROBE) statement: guidelines for reporting observational studies. Lancet. 2007;370(9596):1453-1457. [DOI] [PubMed] [Google Scholar]
- 38.von Essen MR, Ammitzboll C, Hansen RH, et al. . Proinflammatory CD20+ T cells in the pathogenesis of multiple sclerosis. Brain. 2019;142(1):120-132. [DOI] [PubMed] [Google Scholar]
- 39.Bar-Or A, Grove RA, Austin DJ, et al. . Subcutaneous ofatumumab in patients with relapsing-remitting multiple sclerosis: the MIRROR study. Neurology. 2018;90(20):e1805–e1814. [DOI] [PMC free article] [PubMed] [Google Scholar]
- 40.Morita R, Schmitt N, Bentebibel SE, et al. . Human blood CXCR5(+)CD4(+) T cells are counterparts of T follicular cells and contain specific subsets that differentially support antibody secretion. Immunity. 2011;34(1):108-121. [DOI] [PMC free article] [PubMed] [Google Scholar]
- 41.Palanichamy A, Jahn S, Nickles D, et al. Rituximab efficiently depletes increased CD20-expressing T cells in multiple sclerosis patients. J Immunol. 2014;193(2):580-586. [DOI] [PMC free article] [PubMed] [Google Scholar]
- 42.Wilk E, Witte T, Marquardt N, et al. . Depletion of functionally active CD20+ T cells by rituximab treatment. Arthritis Rheum. 2009;60(12):3563-3571. [DOI] [PubMed] [Google Scholar]
- 43.Quendt C, Ochs J, Häusser-Kinzel S, Häusler D, Weber MS. Proinflammatory CD20(+) T cells are differentially affected by multiple sclerosis therapeutics. Ann Neurol. 2021;90(5):834-839. [DOI] [PubMed] [Google Scholar]
- 44.Gingele S, Jacobus TL, Konen FF, et al. Ocrelizumab depletes CD20⁺ T cells in multiple sclerosis patients. Cells. 2018;8(1):12. [DOI] [PMC free article] [PubMed] [Google Scholar]
- 45.Hsiao CC, Fransen NL, van den Bosch AMR, et al. . White matter lesions in multiple sclerosis are enriched for CD20(dim) CD8(+) tissue-resident memory T cells. Eur J Immunol. 2021;51(2):483-486. [DOI] [PubMed] [Google Scholar]
- 46.Sabatino JJ Jr, Wilson MR, Calabresi PA, Hauser SL, Schneck JP, Zamvil SS. Anti-CD20 therapy depletes activated myelin-specific CD8(+) T cells in multiple sclerosis. Proc Natl Acad Sci U S A. 2019;116(51):25800-25807. [DOI] [PMC free article] [PubMed] [Google Scholar]
- 47.EMA. Assessment Report Ocrevus. International Non-proprietary Name: Ocrelizumab. Procedure No. EMEA/H/C/004043/000; 2017. Accessed September 27, 2021.ema.europa.eu/en/documents/assessment-report/ocrevus-epar-public-assessment-report_en.pdf. [Google Scholar]
- 48.Weber MS, Prod'homme T, Patarroyo JC, et al. B cell activation influences T-cell polarization and outcome of anti-CD20 B-cell depletion in central nervous system autoimmunity. Ann Neurol. 2010;68(3):369-383. [DOI] [PMC free article] [PubMed] [Google Scholar]
Associated Data
This section collects any data citations, data availability statements, or supplementary materials included in this article.
Data Availability Statement
Data are available in an anonymized form and can be shared by request form any qualified investigator. Sharing requires approval of a data transfer agreement by the Danish Data Protection Agency.


