Abstract
Background
CT manifestations of SARS-CoV-2 may differ among variants.
Purpose
To compare the chest CT findings of SARS-CoV-2 between the Delta and Omicron variants.
Materials and Methods
This retrospective study collected consecutive baseline chest CT images of hospitalized patients with SARS-CoV-2 from a secondary referral hospital when the Delta and Omicron variants were predominant. Two radiologists categorized CT images according to the RSNA classification system for COVID-19 and visually graded pneumonia extent. Pneumonia, pleural effusion, and intrapulmonary vessels were segmented and quantified on CT images using a priori–developed neural networks, followed by reader confirmation. Multivariable logistic and linear regression analyses were performed to examine the associations between the variants and CT category, distribution, severity, and peripheral vascularity.
Results
In total, 88 patients with the Delta variant (mean age, 67 years ± 15 [SD]; 46 men) and 88 patients with the Omicron variant (mean age, 62 years ± 19; 51 men) were included. Omicron was associated with less frequent, typical peripheral bilateral ground-glass opacity (32% [28 of 88] vs 57% [50 of 88], P = .001), more frequent peribronchovascular predilection (38% [25 of 66] vs 7% [five of 71], P < .001), lower visual pneumonia extent (5.4 ± 6.0 vs 7.7 ± 6.6, P = .02), similar pneumonia volume (5% ± 1 vs 7% ± 11, P = .14), and a higher proportion of vessels with a cross-sectional area smaller than 5 mm2 relative to the total pulmonary blood volume (BV5%; 48% ± 11 vs 44% ± 8; P = .004). In adjusted analyses, Omicron was associated with a nontypical appearance (odds ratio, 0.34; P = .006), peribronchovascular predilection (odds ratio, 9.2; P < .001), and higher BV5% (β = 3.8; P = .01) but similar visual pneumonia extent (P = .17) and pneumonia volume (P = .67) relative to the Delta variant.
Conclusion
At chest CT, the Omicron SARS-COV-2 variant showed nontypical peribronchovascular pneumonia and less pulmonary vascular involvement than did the Delta variant in hospitalized patients with similar disease severity.
© RSNA, 2022
Summary
The Omicron SARS-CoV2 variant showed more frequent nontypical CT findings (peribronchovascular predilection, less pulmonary vascular involvement) than did the Delta variant in hospitalized patients with COVID-19 disease with comparable CT severity.
Key Results
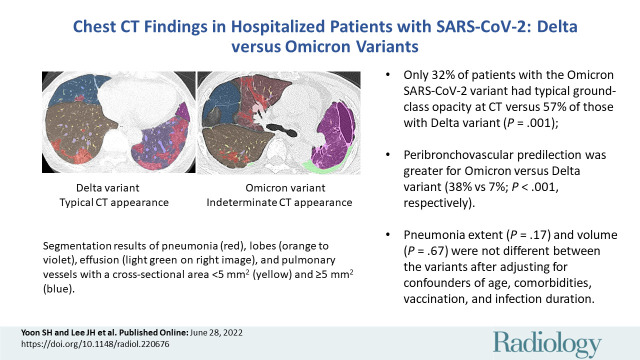
■ Only 32% of patients with the Omicron SARS-CoV-2 variant had typical CT appearances versus 57% of those with the Delta variant (P = .001).
■ Peribronchovascular predilection was greater for the Omicron variant versus the Delta variant (38% vs 7%; P < .001).
■ Pneumonia extent (P = .17) and volume (P = .67) did not differ between variants after adjustment for confounders of age, comorbidities, vaccination, and infection duration.
Introduction
Since the COVID-19 pandemic began, SARS-CoV-2 has evolved through genetic mutations during viral replication (1,2). Several variants of SARS-CoV-2 have been reported worldwide throughout the pandemic, and some variants are classified as variants of concern due to increased transmissibility, disease severity, or evasiveness of treatments and vaccines (3). The Delta and Omicron variants are the two latest variants of concern (4,5).
The Delta variant was first identified in India in October 2020 and became the globally dominant strain in June 2021. This variant of concern has mutations that make it highly transmissible (>60% higher transmissibility than the previous variant), less responsive to antibodies and treatment (ie, reduced neutralization by antibodies generated against previous infection or vaccination), and more likely to cause adverse outcomes (eg, severe diesease, hospitalization, death) (6). Indeed, the Delta variant caused the second wave of India's pandemic and subsequent waves in other countries (7). The Omicron variant, which was first reported in November 2021 in South Africa, was designated as another variant of concern and has become the dominant strain after the Delta variant in most countries. Although the Omicron variant has up to 3.7 times higher transmissibility than the Delta variant, it is regarded as less virulent in terms of the rate of hospitalization, intensive care unit admissions, and mortality (8–10).
Chest CT plays a key role in the diagnosis, detection of complications, and potential prognostication in patients with COVID-19 (11,12). Previous studies have investigated differences between these two contiguously emerging dominant variants, with a focus on their spike proteins, diagnostic tests, clinical characteristics, transmissibility, and outcomes (9,10,13). However, it remains underexplored whether the CT findings of COVID-19 differ among variants. This study aimed to compare the chest CT findings of COVID-19 between the Delta and Omicron variants.
Materials and Methods
The institutional review board approved this retrospective study and waived informed consent (SGPAIK 2022–03–009).
Study Sample
This study was conducted at one of the secondary referral hospitals for the care of patients with mild to moderate COVID-19, which operated 30 beds for COVID-19. Inclusion criteria corresponded to patients with (a) polymerase chain reaction assay–proven SARS-CoV-2, (b) mild (no requirement for oxygen treatment) to moderate (a necessity for oxygen treatment with nasal prong or facial mask) COVID-19 severity at admission, and (c) risk factors for progression (Appendix E1 [online]). We excluded (a) patients who required care in the intensive care unit or ventilator support at admission, (b) pregnant patients, and (c) patients who chose not to undergo CT.
The hospital routinely performed baseline CT for hospitalized patients. We collected consecutive baseline CT images in November 2021 and February 2022 (Fig E1) when the Delta and Omicron variants were predominant in Korea, accounting for 99% and 97% of cases, respectively (14). All chest CT scans were obtained at full inspiration using CT scanners with at least 24 channels (Appendix E1 [online]).
We collected clinical and laboratory information, including infection duration at the time of CT (ie, days from symptom onset to CT) (15). The composite outcome was the occurrence of any of the following events: oxygen ventilation, intensive care unit admission, or death.
Visual CT Analysis
The randomly assigned baseline CT scans were independently evaluated by two board-certified thoracic radiologists (S.H.Y., J.H.L.; 17 and 10 years of clinical experience in thoracic imaging, respectively). They were aware that patients were infected with SARS-CoV-2 but were blinded to other clinical information, including the variant and dates of CT examinations. Disagreement between the two radiologists was resolved by consensus.
CT images of COVID-19 pneumonia were classified into the following four categories according to the RSNA Expert Consensus Document, which was developed during the first wave of SARS-CoV2 infections (16): typical appearance, indeterminate appearance, atypical appearance, and negative for COVID-19 pneumonia (Appendix E1 [online]). For example, typical features of COVID-19 pneumonia include ground-glass opacities (GGOs) with or without consolidation in a peripheral, posterior, and diffuse or lower lung zone distribution and with a round appearance or a crazy paving pattern. Bronchial wall thickening, mucoid impactions, and nodules (tree-in-bud and centrilobular nodules), which are commonly seen in infections, are not typically observed.
Pneumonia extent was visually assessed using a scale of 0–5 for each of the five lung lobes (17): a score of 0 indicated no involvement; a score of 1, less than 5% involvement; a score of 2, 5%–25% involvement; a score of 3, 26%–49% involvement; a score of 4, 50%–75% involvement; and a score of 5, more than 75% involvement. The total CT score was the sum of the individual lobar scores and ranged from 0 (no involvement) to 25 (maximum involvement). The radiologists also assessed pneumonia density, predilected distribution (bronchovascular vs subpleural), lymphadenopathy, and pleural effusion (Appendix E1 [online]).
Quantitative CT Analysis
The CT images were processed using commercially available segmentation software (MEDIP PRO, version 2.0.0.0; MEDICALIP) using a priori–developed deep neural networks to segment the lung (18); COVID-19 pneumonia (19); pulmonary lobes and fissures and pulmonary vessels (20); and pleural effusion (https://cris.nih.go.kr/cris/search/detailSearch.do/20687). The networks were updated with 3DnnU-Net (21), and the Dice similarity scores for those structures were 0.99 (lung), 0.84 (COVID-19), 0.98 (lobes), 0.91 (vessels), and 0.90 (effusion) in internal data sets.
A chest radiologist (S.H.Y.) reviewed and confirmed the segmentation masks. If any corrections were required, an imaging technician manually adjusted the masks under the instruction of the radiologist. The radiologist and technician were blinded to any clinical information other than the fact that the patients had COVID-19. The volume (in milliliters) of the segmented lung parenchymal and pneumonia masks was quantified to determine the proportion of COVID-19 pneumonia in the entire lung parenchyma and each lobe. The mean CT attenuation of COVID-19 was also calculated and converted into pneumonia weight (in grams) using an equation based on the CT attenuation and pneumonia volume (22). BV5% was calculated as the percentage of blood volume in intrapulmonary vessels with a cross-sectional area of less than 5 mm2 relative to the total pulmonary blood volume (20). Lower BV5% reflected endothelial dysfunction and loss of microvasculature in COVID-19 (23,24). The volume of pleural effusion was quantified in milliliters, if present.
Statistical Analyses
Categorical variables were compared using the Fisher exact test and the χ2 test, and continuous variables were compared using the t test or Mann–Whitney U test. Interreader agreements for visual assessment and total CT score were evaluated using the Cohen κ and intraclass correlation coefficient, respectively.
We examined the correlation between visual CT extent and pneumonia volume using the Pearson correlation coefficient. Multivariable logistic regression analysis was performed to examine the association of the variants with CT category and peribronchovascular predilection. Multivariable linear regression analyses were performed to examine the relationships between the variants and visual CT extent, pneumonia percentage, and weight, with the same adjustment. Multivariable Cox regression analyses were conducted to evaluate the association between the variants and the composite outcome. All multivariable analyses were conducted using an input function of confounders (Appendix E1 [online]). Infection duration was classified into five categories: 1, presymptomatic; 2, 0–2 days; 3, 3–5 days; 4, 6–11 days; and 5, more than 11 days (15).
Statistical analyses were conducted using SPSS software, version 25.0 (IBM), and a two-sided P value less than .05 indicated a significant difference.
Results
Clinical Characteristics of the Study Sample
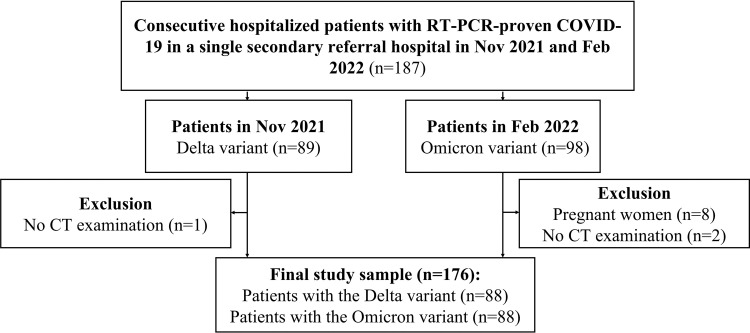
Of 187 patients hospitalized with SARS-CoV-2, 11 were excluded because of pregnancy (n = 8) or reluctance to undergo CT (n = 3). The final study sampled consisted of 176 patients. Of these, 88 had the Delta variant (46 men, 42 women; mean age, 67 years ± 15 [SD]) and 88 had the Omicron variant (51 men, 37 women; mean age, 62 years ± 19). No patients reported previous infection with SARS-CoV-2. A flow diagram is given in Figure 1, and the clinical characteristics of this study sample are listed in Table 1.
Figure 1:
Flowchart of patient inclusion. RT-PCR = real-time reverse-transcription polymerase chain reaction.
Table 1:
Clinical Characteristics of Patients with COVID-19 according to Variant
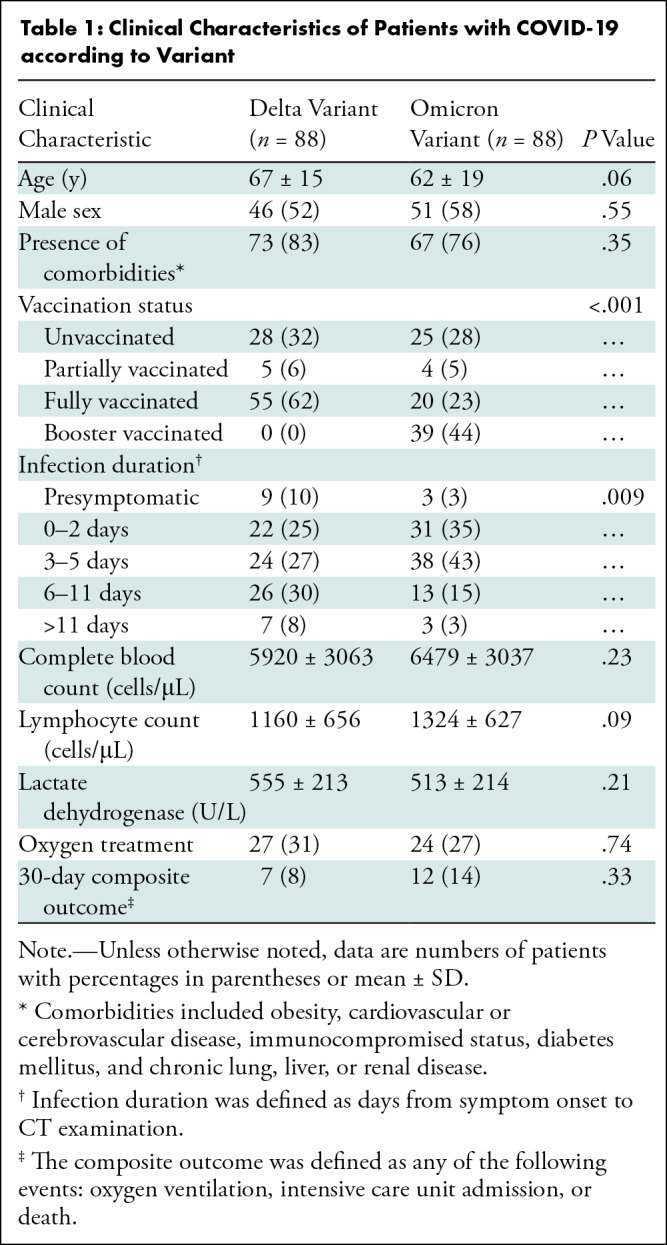
Patients with the Omicron variant had higher levels of vaccination than did those with the Delta variant (unvaccinated, 28% [25 of 88] vs 32% [28 of 88]; partially vaccinated, 5% [four of 88] vs 6% [five of 88]; fully vaccinated: 23% [20 of 88] vs 62% [55 of 88]; booster vaccinated: 44% [39 of 88] vs 0% [0 of 88]; P < .001). The interval between symptom onset and CT was shorter in patients with the Omicron variant than in those with the Delta variant (mean, 3.9 days ± 3.2 vs 5.5 days ± 4.5; P = .01) in symptomatic patients. Other clinical characteristics, including age, sex, comorbidities, the proportion of asymptomatic patients at the time of CT, white blood cell count, lymphocyte count, lactate dehydrogenase level, proportion of patients requiring oxygen treatment, and proportion of unfavorable outcomes, showed no difference between the two variants (P > .05 for all) (Table 1).
Visual Assessment and Quantitative Assessment
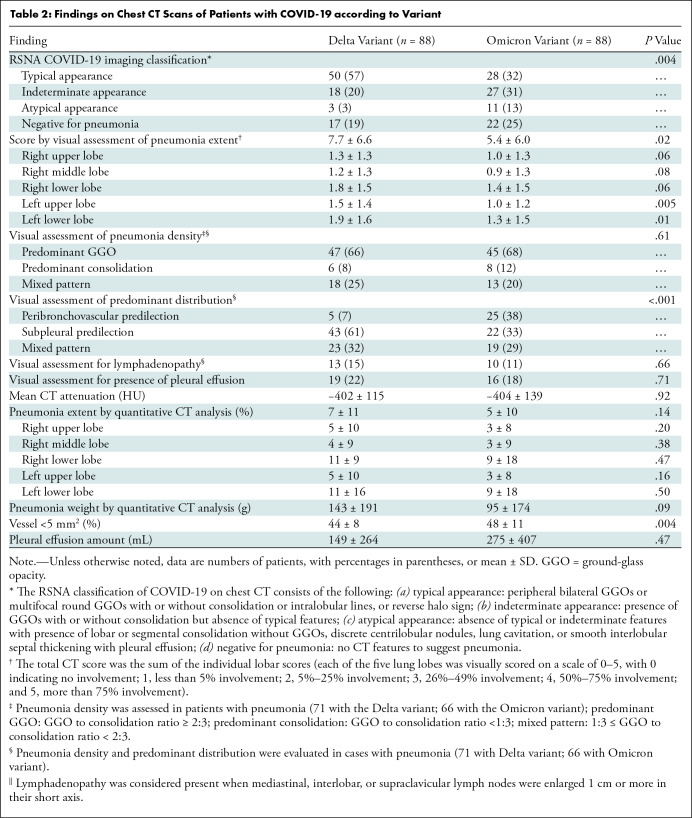
The CT findings of the Omicron and Delta variants are described in Table 2. In terms of the RSNA COVID-19 imaging classification, the Omicron and Delta variants had different appearances (the proportions of typical appearance, indeterminate appearance, atypical appearance, and negative for pneumonia were 32% [28 of 88], 31% [27 of 88], 13% [11 of 88], and 25% [22 of 88], respectively, in patients with the Omicron variant and 57% [50 of 88], 20% [18 of 88], 3% [three of 88], and 19% [17 of 88], respectively, in patients with the Delta variant; P = .004). When appearance was dichotomized as typical or nontypical, patients with the Omicron variant had the typical CT appearance of COVID-19 pneumonia less frequently than did those with the Delta variant (32% [28 of 88] vs 57% [50 of 88], P = .001). The visual score of pneumonia extent was lower in patients with the Omicron variant (mean score, 5.4 ± 6.0) than in those with the Delta variant (mean score, 7.7 ± 6.6; P = .02). However, no evidence of differences was found between the two variants in the CT findings of visual assessment of pneumonia density (predominant GGO, predominant consolidation, and mixed pattern: 68% [45 of 66], 12% [eight of 66], and 20% [13 of 66], respectively, in the Omicron variant group vs 66% [47 of 71], 8% [six of 71], and 25% [18 of 71], respectively, in the Delta variant group; P = .61), the presence of lymphadenopathy (11% [10 of 88] vs 15% [13 of 88]; P = .66), or pleural effusion (18% [16 of 88] vs 22% [19 of 88]; P = .71).
Table 2:
Findings on Chest CT Scans of Patients with COVID-19 according to Variant
In regard to interreader agreement for visual assessment of CT findings of the two variants, Cohen κ coefficients ranged from 0.51 to 0.81, with the highest value of 0.81 (95% CI: 0.74, 0.88) being for RSNA COVID-19 imaging classification and the lowest value of 0.51 (95% CI: 0.41, 0.61) being for pneumonia density. The intraclass correlation coefficient for pneumonia extent was 0.98 (95% CI: 0.98, 0.99).
In the quantitative CT analysis, patients with the Omicron variant had a higher BV5% than did those with the Delta variant (mean, 48% ± 11 vs 44% ± 8; P = .004). The mean CT attenuation (−404 HU ± 139 vs −402 HU ± 115; P = .92), quantitative analysis of pneumonia extent (5% ± 10 vs 7% ± 11, P = .14), pneumonia weight (95 g ± 174 vs 143 g ± 191, P = .09), and pleural effusion amount (275 mL ± 407 vs 149 mL ± 264, P = .47) showed no evidence of differences between the two variants (Figs 2–5). The Pearson correlation coefficient between visual pneumonia extent and pneumonia volume was 0.84.
Figure 2:
Chest CT images in a 66-year-old woman with the Delta variant of COVID-19 with a typical CT appearance. (A, C) Unenhanced axial CT images show peripheral bilateral ground-glass opacities with some intralobular lines predominantly involving both lower lobes. (B, D) Segmentation overlay images show the segmentation results of pneumonia (red), lobes (orange to violet), and pulmonary vessels, with a cross-sectional area less than 5 mm2 (yellow) or 5 mm2 or greater (blue). The visual CT score was 12 points, and the pneumonia volume was 9%.
Figure 5:
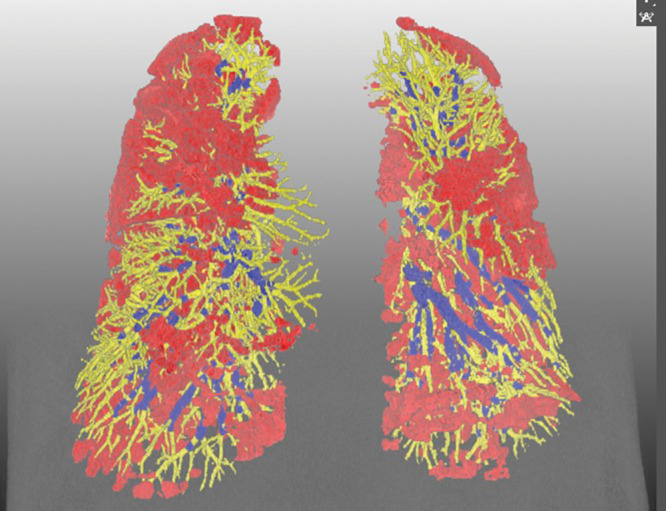
Representative three-dimensional chest CT image in a 52-year-old man with the Omicron variant of COVID-19 shows pneumonia evenly affecting lungs (pneumonia volume, 17.5%) and a preserved percentage of blood volume in intrapulmonary vessels, with a cross-sectional area less than 5 mm2 relative to the total pulmonary blood volume (51.5%). Blue vessels have a cross-sectional area of 5 mm2 or greater, and yellow vessels have a cross-sectional area less than 5 mm2. Red indicates COVID-19 pneumonia.
Figure 3:
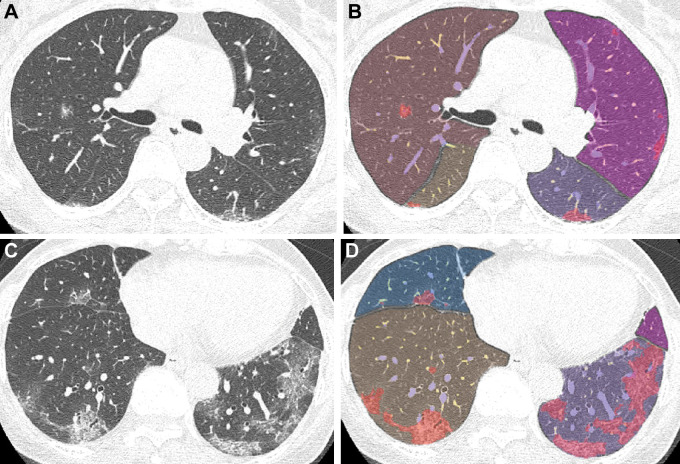
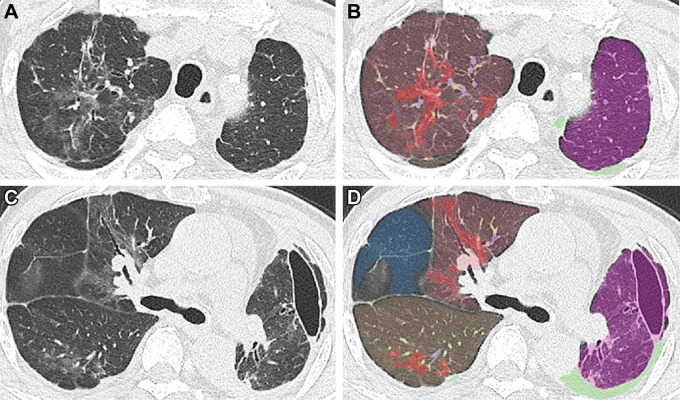
Chest CT images in a 77-year-old man with the Omicron variant of COVID-19 with indeterminate CT appearance. (A, C) Unenhanced axial CT images show unilateral peribronchovascular ground-glass opacities without intralobular lines or an apicobasal predilection. (B, D) Segmentation overlay images show the segmentation results of pneumonia (red), lobes (orange to violet), effusion (light green), and pulmonary vessels with a cross-sectional area less than 5 mm2 (yellow) and 5 mm2 or greater (blue). The visual CT score was 13 points, and the pneumonia volume was 8%. A focal ground-glass opacity in the lateral portion of D was not included in the pneumonia mask because it was the minor fissure between the right upper and middle lobes.
Figure 4:
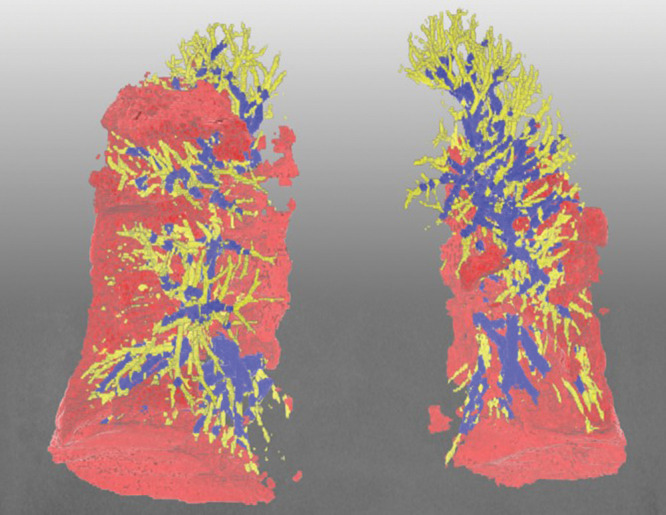
Representative three-dimensional chest CT image in an 88-year-old woman with the Delta variant of COVID-19 shows lower-lobe–predominant pneumonia (pneumonia volume, 14.7%) and a lower percentage of blood volume in intrapulmonary vessels, with a cross-sectional area less than 5 mm2 relative to the total pulmonary blood volume (34.6%). Blue vessels have a cross-sectional area of 5 mm2 or greater, and yellow vessels have a cross-sectional area less than 5 mm2. Red indicates COVID-19 pneumonia.
Uni- and Multivariable Analyses for Effect of Omicron Variant Compared with Delta Variant
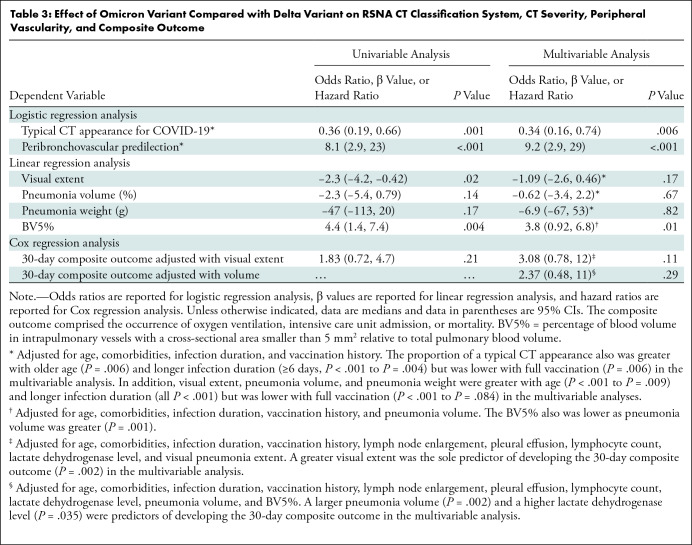
In the univariable analyses, patients with the Omicron variant had a lower frequency of a typical CT appearance (odds ratio, 0.36; P = .001), a more frequent peribronchovascular predilection (odds ratio, 8.0; P < .001), lower visual pneumonia extent (β = −2.3; P = .02), and greater BV5% (β = 4.4; P = .004) than patients with the Delta variant, whereas pneumonia volume (β = −2.3; P = .14), pneumonia weight (β = −47; P = .17), and 30-day composite outcomes were similar between the variants (hazard ratio, 1.8; P = .21) (Table 3).
Table 3:
Effect of Omicron Variant Compared with Delta Variant on RSNA CT Classification System, CT Severity, Peripheral Vascularity, and Composite Outcome
After adjustment for confounders, multivariable analyses enabled us to confirm that patients with the Omicron variant less frequently had a typical CT appearance (odds ratio, 0.34; 95% CI: 0.16, 0.74; P = .006), more frequently had a peribronchovascular predilection (odds ratio, 9.2; 95% CI: 2.9, 28; P < .001), and had a greater BV5% (β = 3.8; 95% CI: 0.92, 6.8; P = .01) relative to those with the Delta variant. After adjustment, there was no evidence of differences between the Omicron and Delta variants regarding visual pneumonia extent (β = −1.09, P = .17), pneumonia volume (β = −0.62, P = .67), pneumonia weight (β = −6.9, P = .82), and 30-day composite outcomes (hazard ratio, 3.1; P = .11; hazard ratio, 2.4; P = .29).
Significant confounders were identified in the multivariable analyses: The proportion of patients with a typical CT appearance was also greater with age (P = .006) and an infection duration of 6 days or longer (P < .001 to P = .004), whereas it was lower with full vaccination status (P = .006). The visual extent, pneumonia volume, and pneumonia weight also were greater with age (P < .001 to P = .009) and a longer infection duration (P < .001 for all) but were lower with full vaccination (P < .001 to P = .08). The BV5% was lower as pneumonia volume was greater (P = .001). CT severity was predictive of developing the 30-day composite outcome regardless of whether it was assessed visually or quantitatively (P = .002 for both).
Discussion
The CT manifestations of COVID-19 among different variants remain underexplored. We found that the Omicron variant was associated with a smaller proportion of patients with a typical CT appearance (32% [28 of 88] vs 57% [50 of 88], P = .001), a larger proportion of patients with peribronchovascular pneumonia (38% [25 of 66] vs 7% [five of 71], P < .001), a lower visual pneumonia extent (5.4 ± 6.0 vs 7.7 ± 6.6, P = .02), similar pneumonia volume (5% ± 10 vs 7% ± 11, P = .14), and a higher proportion of vessels with a cross-sectional area smaller than 5 mm2 relative to the total pulmonary blood volume (BV5%) (48% ± 11 vs 44% ± 8, P = .004). After adjustment for confounders, including age, comorbidities, vaccination status, and infection duration, the Omicron variant was associated with a nontypical appearance (odds ratio, 0.34; P = .006), peribronchovascular predilection (odds ratio, 9.2; P < .001), and higher BV5% (β = 3.8, P = .01) but not with visual pneumonia extent (β = −1.09, P = .17) or pneumonia volume (β = −0.62, P = .67).
The frequency of a typical CT appearance has been reported to vary from 17% to 53% depending on the site and clinical indication (25–28), but our study sample with either variant underwent chest CT at the same site and for the same indications. Similar proportions of patients with either variant were unvaccinated or partially vaccinated, and these patients might be more likely to have a typical CT appearance (29). The odds of patients with the Omicron variant having a typical CT appearance and peribronchovascular predilection remained significant, even after adjustment for these confounders. The Omicron variant replicates better in the bronchi but worse in the lung parenchyma (13), and these characteristics may hinder infection with the Omicron variant from having a typical CT appearance when pneumonia is established in the lung parenchyma, while promoting peribronchovascular predilection.
BV5%, which reflects peripheral pulmonary volume and accounts for the majority of pulmonary blood volume (30), is lower in patients with SARS-CoV-2 than in healthy individuals and patients with acute respiratory distress syndrome (23,24). Furthermore, a lower BV5% was identified as a predictor of adverse clinical outcomes in COVID-19 (31). This characteristic reduction of BV5% in COVID-19 could result from SARS-CoV-2–induced vasoconstriction or microthrombi of small-caliber vessels (24). Indeed, SARS-CoV-2 inflames small vessels, provokes thrombi (32,33), and leads to frequent in situ pulmonary thrombosis, especially in patients with a severe case (34). Interestingly, early observations suggested that the Omicron variant might have a lower thrombosis rate than previous variants (35). This potentially provides support for the possibility that Omicron might involve fewer pulmonary vessels, in line with there being less involvement of the lower respiratory system.
Lower BV5% and CT vascular engorgement seem to result from the same vascular abnormalities of COVID-19 but manifest at different pulmonary vascular calibers. The cross-sectional vessel area of BV5% corresponds to a vascular diameter smaller than 1.26 mm, given the equation for a circle. These peripheral minute vessels had vasoconstriction or thrombosis but are too small to be visually assessed at CT. Meanwhile, vascular engorgement in patients with COVID-19 was typically observed in segmental or subsegmental vessels. The diameters were 3–4 mm or larger, corresponding to a cross-sectional vessel area of 28–50 mm2 or larger. Vascular engorgement can reflect vascular dilatation or thrombosis proximal to SARS-CoV2–affected microvessels. Taken together, modern CT provided a multilevel analysis for revealing pulmonary vascular disease in patients with COVID-19 from impaired perfusion (vascular manifestation below a millimeter), lower peripheral BV5% (vascular manifestation around a millimeter), and proximally engorged vascular changes (vascular manifestation over a millimeter).
Our study had limitations. This study was retrospective and only included relatively few hospitalized patients. In addition, patient inclusion was conducted without calculating the sample size. Participants did not undergo testing to confirm the SARS-CoV-2 variant. Third, the clinical severity of hospitalized patients might not have been identical between variants, and the number of COVID-19 cases remained low in November 2021, when the Delta variant predominated, but soared in February 2022 with the Omicron variant. Fourth, the pulmonary vessels could not be segmented in consolidation areas on noncontrast CT images because the neural network and radiologist could not trace the vessels within consolidations. Fifth, we did not adjust for the multiplicity of tests in our analyses.
In conclusion, the Omicron variant showed more frequent nontypical peribronchovascular pneumonia and less pulmonary vascular involvement than did the Delta variant in hospitalized patients with comparable CT severity. The CT characteristics of Omicron may hamper radiologists from promptly recognizing COVID-19 on CT images when incidentally encountered, and this finding raises an alarm regarding the need to evaluate whether CT findings remain consistent or change when new variants appear.
Acknowledgments
Acknowledgments
The authors gratefully acknowledge the expert biostatistician, Myoung-Jin Jang (Seoul National University Hospital Medical Research Collaborating Center), for the review of statistical analysis and Andrew Dombrowski, PhD (Compecs), for his assistance in improving the use of English in this article.
S.H.Y. and J.H.L. contributed equally to this article.
Supported by the Korea Medical Device Development Fund, which is funded by the Korean government (the Ministry of Science and ICT, South Korea; the Ministry of Trade Industry and Energy; the Ministry of Health and Welfare, Republic of Korea; and the Ministry of Food and Drug Safety) (project no. 202011A03).
Disclosures of conflicts of interest: S.H.Y. Chief medical officer of and holds stock in Medical IP. J.H.L. No relevant relationships. B.N.K. No relevant relationships.
Abbreviations:
- BV5%
- percentage of blood volume in intrapulmonary vessels with a cross-sectional area smaller than 5 mm2 relative to the total pulmonary blood volume
- GGO
- ground-glass opacity
References
- 1. Walensky RP , Walke HT , Fauci AS . SARS-CoV-2 variants of concern in the United States-challenges and opportunities . JAMA 2021. ; 325 ( 11 ): 1037 – 1038 . [DOI] [PMC free article] [PubMed] [Google Scholar]
- 2. Tao K , Tzou PL , Nouhin J , et al . The biological and clinical significance of emerging SARS-CoV-2 variants . Nat Rev Genet 2021. ; 22 ( 12 ): 757 – 773 . [DOI] [PMC free article] [PubMed] [Google Scholar]
- 3. Harvey WT , Carabelli AM , Jackson B , et al . SARS-CoV-2 variants, spike mutations and immune escape . Nat Rev Microbiol 2021. ; 19 ( 7 ): 409 – 424 . [DOI] [PMC free article] [PubMed] [Google Scholar]
- 4. Lopez Bernal J , Andrews N , Gower C , et al . Effectiveness of Covid-19 vaccines against the B.1.617.2 (Delta) Variant . N Engl J Med 2021. ; 385 ( 7 ): 585 – 594 . [DOI] [PMC free article] [PubMed] [Google Scholar]
- 5. Del Rio C , Malani PN , Omer SB . Confronting the delta variant of SARS-CoV-2, summer 2021 . JAMA 2021. ; 326 ( 11 ): 1001 – 1002 . [DOI] [PubMed] [Google Scholar]
- 6. Li B , Deng A , Li K , et al . Viral infection and transmission in a large, well-traced outbreak caused by the SARS-CoV-2 Delta variant . Nat Commun 2022. ; 13 ( 1 ): 460 . [DOI] [PMC free article] [PubMed] [Google Scholar]
- 7. Butt AA , Dargham SR , Chemaitelly H , et al . Severity of illness in persons infected with the SARS-CoV-2 delta variant vs beta variant in Qatar . JAMA Intern Med 2022. ; 182 ( 2 ): 197 – 205 . [DOI] [PMC free article] [PubMed] [Google Scholar]
- 8. Iuliano AD , Brunkard JM , Boehmer TK , et al . Trends in disease severity and health care utilization during the early omicron variant period compared with previous SARS-CoV-2 high transmission periods - United States, December 2020-January 2022 . MMWR Morb Mortal Wkly Rep 2022. ; 71 ( 4 ): 146 – 152 . [DOI] [PMC free article] [PubMed] [Google Scholar]
- 9. Ulloa AC , Buchan SA , Daneman N , Brown KA . Estimates of SARS-CoV-2 omicron variant severity in Ontario, Canada . JAMA 2022. ; 327 ( 13 ): 1286 – 1288 . [DOI] [PMC free article] [PubMed] [Google Scholar]
- 10. Wolter N , Jassat W , Walaza S , et al . Early assessment of the clinical severity of the SARS-CoV-2 omicron variant in South Africa: a data linkage study . Lancet 2022. ; 399 ( 10323 ): 437 – 446 . [DOI] [PMC free article] [PubMed] [Google Scholar]
- 11. Rubin GD , Ryerson CJ , Haramati LB , et al . The role of chest imaging in patient management during the COVID-19 pandemic: a multinational consensus statement from the Fleischner Society . Radiology 2020. ; 296 ( 1 ): 172 – 180 . [DOI] [PMC free article] [PubMed] [Google Scholar]
- 12. Kwee TC , Kwee RM . Chest CT in COVID-19: what the radiologist needs to know . RadioGraphics 2020. ; 40 ( 7 ): 1848 – 1865 . [DOI] [PMC free article] [PubMed] [Google Scholar]
- 13. Hui KPY , Ho JCW , Cheung MC , et al . SARS-CoV-2 Omicron variant replication in human bronchus and lung ex vivo . Nature 2022. ; 603 ( 7902 ): 715 – 720 . [DOI] [PubMed] [Google Scholar]
- 14. Korea COVID-19 update. Korea Disease Control and Prevention Agency . https://www.kdca.go.kr/board/board.es?mid=a20501010000&bid=20501010015. Accessed March 21, 2022 .
- 15. Bernheim A , Mei X , Huang M , et al . Chest CT findings in coronavirus disease-19 (COVID-19): relationship to duration of infection . Radiology 2020. ; 295 ( 3 ): 200463 . [DOI] [PMC free article] [PubMed] [Google Scholar]
- 16. Simpson S , Kay FU , Abbara S , et al . Radiological Society of North America expert consensus document on reporting chest CT findings related to COVID-19: endorsed by the Society of Thoracic Radiology, the American College of Radiology, and RSNA . Radiol Cardiothorac Imaging 2020. ; 2 ( 2 ): e200152 . [DOI] [PMC free article] [PubMed] [Google Scholar]
- 17. Wang Y , Dong C , Hu Y , et al . Temporal changes of CT findings in 90 patients with COVID-19 pneumonia: a longitudinal study . Radiology 2020. ; 296 ( 2 ): E55 – E64 . [DOI] [PMC free article] [PubMed] [Google Scholar]
- 18. Yoo SJ , Yoon SH , Lee JH , et al . Automated lung segmentation on chest computed tomography images with extensive lung parenchymal abnormalities using a deep neural network . Korean J Radiol 2021. ; 22 ( 3 ): 476 – 488 . [DOI] [PMC free article] [PubMed] [Google Scholar]
- 19. Yoo SJ , Qi X , Inui S , et al . Deep learning-based automatic CT quantification of coronavirus disease 2019 pneumonia: an international collaborative study . J Comput Assist Tomogr 2022. ; 46 ( 3 ): 413 – 422 . [DOI] [PubMed] [Google Scholar]
- 20. Nam JG , Witanto JN , Park SJ , Yoo SJ , Goo JM , Yoon SH . Automatic pulmonary vessel segmentation on noncontrast chest CT: deep learning algorithm developed using spatiotemporally matched virtual noncontrast images and low-keV contrast-enhanced vessel maps . Eur Radiol 2021. ; 31 ( 12 ): 9012 – 9021 . [DOI] [PMC free article] [PubMed] [Google Scholar]
- 21. Isensee F , Jaeger PF , Kohl SAA , Petersen J , Maier-Hein KH . nnU-Net: a self-configuring method for deep learning-based biomedical image segmentation . Nat Methods 2021. ; 18 ( 2 ): 203 – 211 . [DOI] [PubMed] [Google Scholar]
- 22. Choi H , Qi X , Yoon SH , et al . Extension of coronavirus disease 2019 on chest CT and implications for chest radiographic interpretation . Radiol Cardiothorac Imaging 2020. ; 2 ( 2 ): e200107 [Published correction appears in Radiol Cardiothorac Imaging 2020;2(2):e204001.] . [DOI] [PMC free article] [PubMed] [Google Scholar]
- 23. Lins M , Vandevenne J , Thillai M , et al . Assessment of small pulmonary blood vessels in COVID-19 patients using HRCT . Acad Radiol 2020. ; 27 ( 10 ): 1449 – 1455 . [DOI] [PMC free article] [PubMed] [Google Scholar]
- 24. Thillai M , Patvardhan C , Swietlik EM , et al . Functional respiratory imaging identifies redistribution of pulmonary blood flow in patients with COVID-19 . Thorax 2021. ; 76 ( 2 ): 182 – 184 . [DOI] [PubMed] [Google Scholar]
- 25. de Jaegere TMH , Krdzalic J , Fasen BACM , Kwee RM ; COVID-19 CT Investigators South-East Netherlands (CISEN) study group. Radiological Society of North America chest CT classification system for reporting COVID-19 pneumonia: interobserver variability and correlation with reverse-transcription polymerase chain reaction . Radiol Cardiothorac Imaging 2020. ; 2 ( 3 ): e200213 . [DOI] [PMC free article] [PubMed] [Google Scholar]
- 26. Inui S , Kurokawa R , Nakai Y , et al . Comparison of Chest CT grading systems in coronavirus disease 2019 (COVID-19) pneumonia . Radiol Cardiothorac Imaging 2020. ; 2 ( 6 ): e200492 . [DOI] [PMC free article] [PubMed] [Google Scholar]
- 27. Miranda Magalhães Santos JM , Paula Alves Fonseca A , Pinheiro Zarattini Anastacio E , Formagio Minenelli F , Furtado de Albuquerque Cavalcanti C , Borges da Silva Teles G . Initial results of the use of a standardized diagnostic criteria for chest computed tomography findings in coronavirus disease 2019 . J Comput Assist Tomogr 2020. ; 44 ( 5 ): 647 – 651 . [DOI] [PubMed] [Google Scholar]
- 28. Hammer MM . Real-world diagnostic performance of RSNA consensus reporting guidelines for findings related to COVID-19 on chest CT . AJR Am J Roentgenol 2022. ; 218 ( 1 ): 75 – 76 . [DOI] [PubMed] [Google Scholar]
- 29. Lee JE , Hwang M , Kim YH , et al . Imaging and clinical features of COVID-19 breakthrough infections: a multicenter study . Radiology 2022. ; 303 ( 3 ): 682 – 692 . [DOI] [PMC free article] [PubMed] [Google Scholar]
- 30. Estépar RS , Kinney GL , Black-Shinn JL , et al . Computed tomographic measures of pulmonary vascular morphology in smokers and their clinical implications . Am J Respir Crit Care Med 2013. ; 188 ( 2 ): 231 – 239 . [DOI] [PMC free article] [PubMed] [Google Scholar]
- 31. Morris MF , Pershad Y , Kang P , et al . Altered pulmonary blood volume distribution as a biomarker for predicting outcomes in COVID-19 disease . Eur Respir J 2021. ; 58 ( 3 ): 2004133 . [DOI] [PMC free article] [PubMed] [Google Scholar]
- 32. Halawa S , Pullamsetti SS , Bangham CRM , et al . Potential long-term effects of SARS-CoV-2 infection on the pulmonary vasculature: a global perspective . Nat Rev Cardiol 2022. ; 19 ( 5 ): 314 – 331 . [DOI] [PMC free article] [PubMed] [Google Scholar]
- 33. Ackermann M , Verleden SE , Kuehnel M , et al . Pulmonary vascular endothelialitis, thrombosis, and angiogenesis in Covid-19 . N Engl J Med 2020. ; 383 ( 2 ): 120 – 128 . [DOI] [PMC free article] [PubMed] [Google Scholar]
- 34. Suh YJ , Hong H , Ohana M , et al . Pulmonary embolism and deep vein thrombosis in COVID-19: a systematic review and meta-analysis . Radiology 2021. ; 298 ( 2 ): E70 – E80 . [DOI] [PMC free article] [PubMed] [Google Scholar]
- 35. Wilkinson E . Covid-19: We have good treatments for omicron, but questions remain, say doctors . BMJ 2022. ; 376 : o61 . [DOI] [PubMed] [Google Scholar]


