Abstract
A set of three sucrose-regulated transcriptional fusions was constructed. Fusions p61RYTIR, p61RYlac, and p61RYice contain the scrR sucrose repressor gene and the promoterless gfp, lacZ, and inaZ reporter genes, respectively, fused to the scrY promoter from Salmonella enterica serovar Typhimurium. Cells of Erwinia herbicola containing these fusions are induced only in media amended with sucrose, fructose, or sorbose. While a large variation in sucrose-dependent reporter gene activity was observed in cells harboring all gene fusions, fusions to the inaZ reporter gene yielded a much wider range of activity and were responsive to lower levels of sucrose than either lacZ or gfp. The lacZ reporter gene was found to be more efficient than gfp, requiring approximately 300-fold fewer cells for a detectable response over all concentrations of sucrose. Similarly, inaZ was found to be more efficient than lacZ, requiring 30-fold fewer cells at 1.45 μM sucrose and 6,100-fold fewer cells at 29 mM sucrose for a quantifiable response. The fluorescence of individual cells containing p61RYTIR was quantified following epifluorescence microscopy in order to relate the fluorescence exhibited by populations of cells in batch cultures with that of individual cells in such cultures. While the mean fluorescence intensity of a population of individual cells increased with increasing concentrations of sucrose, a wide range of fluorescence intensity was seen among individual cells. For most cultures the distribution of fluorescence intensity among individual cells was log-normally distributed, but cells grown in intermediate concentrations of sucrose exhibited two distinct populations of cells, one having relatively low fluorescence and another with much higher fluorescence. When cells were inoculated onto bean leaves, whole-cell ice nucleation and gfp-based biological sensors for sucrose each indicated that the average concentration of sucrose on moist leaf surfaces was about 20 μM. Importantly, the variation in green fluorescent protein fluorescence of biosensor cells on leaves suggested that large spatial variations in sugar availability occur on leaves.
Many reporter genes have been described for use in estimating rates of transcription of target genes in prokaryotic systems. Some of the more common reporter genes include lacZ, luxAB, and gusA. Others, such as inaZ or gfp, are not as widely used or have only recently been described (for a general review, see reference 22). Generally, reporter genes are used in transcriptional fusions to measure the transcriptional activity of a particular promoter or gene under various environmental or physiological conditions or, when fused to a constitutively expressed promoter, can be used as marker genes in in situ studies. For example, the gene (gfp) encoding the green fluorescent protein (GFP) (6) has been used primarily as a marker gene in which a transcriptional fusion to a strong constitutive promoter is introduced into a bacterial or eukaryotic cell, conferring a fluorescent phenotype that can be used as a tag in localization studies in situ. GFP has also been used to provide a qualitative measure of gene expression (6, 9, 15, 39). Unlike other reporter genes, such as lacZ or gusA, gfp has not been widely used to quantify promoter strength.
As an increasing number of reports describing reporter gene systems are published, limitations have been discovered. Not all reporter genes can be used under all circumstances. For example, LuxAB-dependent bioluminescence and GFP fluorescence require the presence of molecular oxygen (5, 12). Therefore, studies using either of these two reporter genes under anaerobic conditions would not be possible. LuxAB bioluminescence also requires the flavin mononucleotide FMNH2. Thus, estimates of the transcriptional activity of luxAB fusions are strongly influenced by levels of metabolic activity; cell activity must be high enough that the concentrations of FMNH2 are not limiting. For this reason, a common use of lux gene fusions is an indirect assessment of the metabolic state of cells constitutively expressing the lux operon (10, 27). Additionally, the usefulness of lacZ fusions in studies involving eukaryotic cells is limited by the high background level caused by the presence of both bacterial and eukaryotic β-galactosidases (22), as well as pigments or particulate material which interferes with enzymatic assays. For use in environmental studies in situ, where the population size of an environmental microorganism will often be very low compared to that in laboratory studies, the efficiency of the reporter gene is also an important issue. If a large number of cells is required to yield a detectable enzymatic activity, as in the case of lacZ-encoded β-galactosidase, it may not be possible to use such reporter genes for environmental studies.
Reporter genes also differ in their utility in detecting transcriptional activity at the population or individual-cell level. lacZ and inaZ transcriptional fusions are generally used to determine gene expression and gene regulation in a population of cells, since the activity of individual cells is not easily measured. Ice nucleation events, in particular, cannot be attributable to individual cells in a population. Recently, several studies using gfp fusions have illustrated the capacity to detect the transcriptional activity of single cells harboring such gene fusions (2, 38). Microscopes equipped with charge-coupled devices can be used to quantify the fluorescence of individual cells. Likewise, cells differing in fluorescence can be differentiated using a fluorescence-activated cell sorter (2, 38).
Carbon compounds have been shown to be the most limiting resource on plants (40). Several common sugars, including sucrose, are among the most abundant carbon sources on leaves (28). While sugars are depleted on plants during colonization by bacteria, some sugars apparently remain after colonization ceases (28). Thus, the interactions of microbes with plants with regard to nutrition are apparently complex, and new tools are needed to better understand such interactions.
In this report, we describe the construction of three sucrose-regulated transcriptional fusions, p61RYTIR, p61RYlac, and p61RYice, which contain the gfp, lacZ, and inaZ reporter genes, respectively, fused to a sucrose-responsive promoter. These fusions have been mobilized into Erwinia herbicola strain 299R, a common epiphytic bacterium capable of exploiting plant surfaces and of producing the plant hormone indole-3-acetic acid (4), to create a set of whole-cell biosensors that can be used to estimate the concentrations of sucrose in the cell environment. These biosensors have also been used to compare, for the first time, the relative efficiencies of these reporter genes. The transcriptional activity exhibited by a population of cells will also be correlated with measurements of fluorescence in cells harboring GFP fusions.
MATERIALS AND METHODS
Construction of the sucrose promoter and control plasmids p61RYTIR, p61RYlac, p61RYice, and pKT-bla.
The scrY promoter from pMU3001 (7) was amplified using oligonucleotides SCRPCR4 (5′-GGGAATTCTCAACCGTCAGTTTTAATCC-3′) and SCRPCR5 (5′-GGGGATCCTGCTGTTGGCATCCCAAAAG-3′). PCR was carried out for 30 cycles of 1 min at 95°C, 2 min at 56°C, and 3 min at 72°C. The PCR product was then digested with EcoRI and BamHI and cloned into the multiple cloning site of pVSP61 (24) to create the plasmid p61Y. The sucrose repressor gene, scrR, was first cloned as a BamHI-SphI fragment from pRSL26–1, a scrA::Ω derivative of pJOE637 (34), into pGFP (Clontech, Palo Alto, Calif.) to create the plasmid pSCRR. A 1.9-kb BamHI-HindIII fragment from this plasmid was then cloned into p61Y to create the plasmid p61RY, which has a unique BamHI site between PscrY and scrR. In order to construct the sucrose promoter-reporter gene fusion plasmids, the inaZ and lacZYA genes had to be subcloned to generate BamHI sites on both ends of the reporter genes. A 3.7-kb EcoRI fragment from pTn3-Spice (20) was cloned into pUC1813 (18) to create pUC1813ice (D. Roberts, unpublished data). To construct pUC1813lac, the 5-kb fragment containing lacZYA was isolated from BamHI- and StuI-restricted pRS551 (37). This fragment was filled in with DNA polymerase (Klenow fragment) and cloned into SmaI-digested pUC1813. BamHI fragments from pGreenTIR (29), pUC1813ice, and pUC1813lac were cloned into the unique BamHI site of p61RY to create the plasmids p61RYTIR, p61RYice, and p61RYlac, respectively.
The control plasmid pKT-bla was constructed as follows. The promoter region of the penicillin lactamase gene (bla) from pBR322 (bp 4021 to 4081) (3) was amplified and inserted into the pCRII-TOPO vector (Invitrogen, Carlsbad, Calif.). The fragment containing Pbla was then excised and ligated into the EcoRI site of pPROBE-KT (30), upstream of the promoterless gfp gene, to create pKT-bla.
Media, chemicals, and growth conditions.
E. herbicola cells were routinely grown at 24°C. The responsiveness of the various E. herbicola whole-cell biosensors to different concentrations of sucrose and fructose was determined by growing cells for 12 to 16 h in M9 minimal medium supplemented with 0.2% Casamino Acids (MCA) and containing various concentrations of the sugar under investigation. The cells were then washed and resuspended in fresh MCA containing the same test concentration of sugar and grown for 2.5 h. The cells were then harvested, and the reporter gene activity was measured as described below. When appropriate, rifampin and kanamycin were added to the medium at 100 and 50 μg/ml, respectively. Restriction and DNA-modifying enzymes were obtained from New England Biolabs (Beverly, Mass.) or Stratagene, Inc. (La Jolla, Calif.). All chemicals were purchased from Sigma Chemicals (St. Louis, Mo.) or Fisher Scientific (Pittsburgh, Pa.).
Enzyme assays.
β-Galactosidase and ice nucleation assays were performed as described previously (21, 37). Fluorescence was measured on a Perkin-Elmer LS50B luminescence spectrometer at an excitation wavelength of 490 nm, an emission wavelength of 510 nm, and excitation and emission slit widths of 8 nm; intensity readings are represented by arbitrary units and were normalized to a cell density of 109 cells/ml. The host strain, 299R, demonstrates minimal but measurable fluorescence at the above wavelengths. Therefore, in order to correct for the background fluorescence of 299R, eight independent measurements of the fluorescence of 299R cultures in MCA were taken. The mean fluorescence of these cultures was then subtracted from the values for 299R(p61RYTIR) at each of the sucrose concentrations. The β-galactosidase and ice nucleation activities of 299R were negligible and were not corrected for in the calculations of reporter gene activities.
Plant inoculation and bacterial cell recovery.
Cells from stationary-phase cultures of strain 299R(p61RYice) or strain 299R(p61RYTIR) grown in MCA containing 0.2% glucose were washed twice in potassium phosphate buffer (10 mM, pH 7.0) (PPB) before being resuspended in distilled water at 1 × 10⁵ or 2 × 10⁷ cells ml−1, respectively. The cell suspension was immediately applied with an atomizer to bean plants (Phaseolus vulgaris cv. Bush Blue Lake 274) (three replicate pots of eight plants per pot) at the first trifoliate leaf stage. The plants were then bagged and incubated at 24°C. Two primary leaves were sampled at random from each pot 48 h after inoculation for examination of 299R(p61RYTIR) cells directly on leaves by confocal laser scanning microscopy, or for recovery of cells to be examined by epifluorescence microscopy following fluorescence in situ hybridization (FISH). For assessment of bacterial populations and PscrY-inaZ expression on plants, 15 leaves were sampled at regular time intervals. Each sampled leaf was placed in 20 ml of sterile PPB. Cells were removed from leaves by sonication for 7 min followed by vigorous agitation. Bacterial populations were estimated by plating appropriate dilutions on Luria-Bertani agar supplemented with kanamycin. Also, leaf washings were assayed for ice nucleation activity as described above. Prior to FISH and microscopy, cells removed from leaves were concentrated by filtration of the cell suspension through a 0.4-μm-pore-size polycarbonate filter (Millipore, Bedford, Mass.).
Microscopy and image analysis.
Bacterial cells recovered from plants were fixed promptly and prepared for FISH with the rhodamine-labeled probe Eh-299R, which is specific to E. herbicola 299R, as described by Brandl et al. (M. T. Brandl, B. Quiñones, and S. E. Lindow, submitted for publication). For cytological analyses of cells grown in vitro, we used five 100-μl aliquots of the same cultures for which fluorescence was measured with a fluorimeter. The culture aliquots were centrifuged, and the cells were washed and resuspended in PPB to a final concentration of approximately 5 × 10⁷ cells ml−1. Ten microliters of this suspension was spotted on Polysine microscope slides (Erie Scientific Company, Portsmouth, N.H.), left to dry at room temperature for 10 min, mounted in glycerol-PBS (pH 8.0; 50:50 [vol/vol]), and examined immediately. When indicated, cultured cells were fixed with 4% paraformaldehyde prior to cytological analysis following a protocol described by Amann (1). Cells recovered from cultures or from plants were visualized on an Axiophot microscope fitted with a Plan-NEOFLUAR 100×/1.30 oil objective (Carl Zeiss, Oberkochen, Germany) using phase-contrast and epifluorescence illumination. GFP and rhodamine fluorescences were detected with an Endow GFP filter set and a rhodamine filter set (Chroma Technology Corp., Brattleboro, Vt.), respectively. The microscope was equipped with a Princeton ST138 cooled charge-coupled device camera (Princeton Instruments, Inc., Trenton, N.J.). Acquisition of digitized 12-bit images were performed with the MacIntosh version 3.1 of the IPLab Spectrum software package (Scanalytics, Inc., Vienna, Va.). Two fields of at least 100 individual cells were captured per sample at an exposure of 5 s, which was within the linear range of detection of the camera for all tested samples. The fluorescent grey scale intensity of each pixel within each cell was quantified with the MacIntosh version 3.2 of IPLab Spectrum by overlay of the binary mask from the phase-contrast image on the corresponding fluorescence image. Mean pixel intensity per cell was computed from the sum of the intensities of all of the individual pixels averaged over the total number of pixels forming the cell profile.
Statistical methods.
All statistical calculations were performed with the program Statistica (version 5.1) (StatSoft, Tulsa, Okla.). Cumulative normal probability values (normal score), analysis of variance, and the probability values for the Kolmogorov-Smirnov D statistic were calculated with the SAS program (version 6.03; SAS Institute Inc., Cary, N.C.).
RESULTS AND DISCUSSION
Construction and specificity of the PscrY transcriptional fusions.
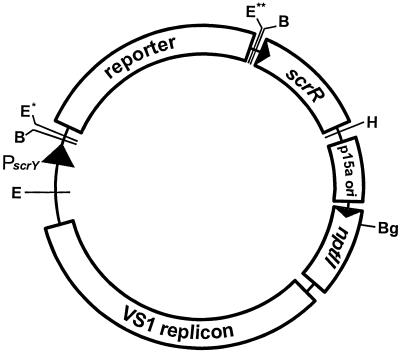
In order to compare the lacZ, gfp, and inaZ reporter genes, a set of transcriptional fusions, isogenic apart from the reporter gene, was constructed using the scrY promoter (PscrY) from the Salmonella enterica serovar Typhimurium plasmid pUR400 (7) (Fig. 1). The three promoter plasmids, p61RYTIR, p61RYice, and p61RYlac, contain the genes, devoid of their native promoters, encoding the GFP (gfp) from Aequorea victoria (6), the ice nucleation protein (inaZ) from Pseudomonas syringae pv. syringae (11), and β-galactosidase from E. coli, respectively. The sucrose repressor gene, scrR, is also present on each plasmid and located immediately downstream of the reporter gene. Transcription from PscrY has been shown to be regulated by the ScrR repressor and induced during cell growth on sucrose, fructose, and fructose-containing oligosaccharides (7). To determine if transcription from PscrY in our constructs is induced exclusively by sucrose and fructose, E. herbicola strain 299R(p61RYice) was grown in MCA with various sugars at a concentration of 0.2%. The ice nucleation activity of 299R(p61RYice) after growth on each of the substrates was measured (data not shown). As expected, both fructose and sucrose induced transcription from PscrY to a high level (10−2.13 and 10−1.45 ice nuclei/cell, respectively). Since ice nucleation activity increases approximately with the square of the increase in the cellular abundance of InaZ (20), the ca. 6,000-fold increase in ice nucleation activity in MCA-sucrose compared to MCA alone (10−5.24 ice nuclei/cell) corresponds to an approximately 80-fold increase in transcriptional activity from PscrY. Sorbose induced the highest level of ice nucleation activity (10−0.5 ice nuclei/cell), which was about 9-fold higher than that observed for sucrose and about 43-fold higher than for fructose. Sorbose and fructose are both ketohexoses and are diastereomers of each other. Therefore, other diastereomers of fructose (e.g., psicose and tagatose) might be presumed to induce PscrY, but this possibility was not tested.
FIG. 1.
General organization of the sucrose promoter-reporter gene fusion plasmids. The common elements of each plasmid are (clockwise) a sucrose-responsive promoter (PscrY) (7), the sucrose repressor gene (scrR) (7), and the following components derived from the parental vector, pVSP61 (24): the P15a origin of replication from pACYC184, a kanamycin resistance gene (nptII), and a broad-host-range origin of replication (VS1 replicon). Promoterless reporter gene fragments (gfp, inaZ, and lacZYA) containing BamHI sites at both ends were cloned into the unique BamHI site between PscrY and scrR to create the plasmids p61RYTIR, p61RYice, and p61RYlac, respectively. The lac promoter present on pVSP61 is located immediately downstream of the HindIII site in a transcriptional orientation opposite to that of scrR. Restriction enzymes: B, BamHI; Bg, BglII; E, EcoRI; H, HindIII. ∗, EcoRI site present in p61RYTIR only; ∗∗, EcoRI site present in both p61RYTIR and p61RYice
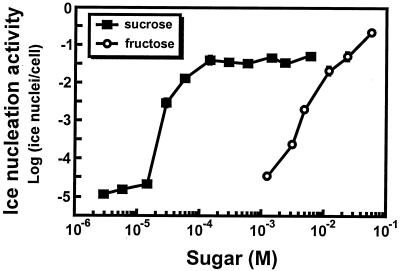
Growth of 299R(p61RYice) in either d-mannose, d-maltose, i-inositol, d-sorbitol, d-raffinose, d-tartrate, d-melibiose, α-lactose, adonitol, glycerol, d-galactose, d-melezitose, l-arabinose, d-glucose, lactose, d-xylose, d-mannitol, d-trehalose, or l-rhamnose resulted in ice nucleation activity that was not significantly different from that observed during growth in MCA alone. Interestingly, the fructose-containing oligosaccharide d-raffinose was not an inducer of PscrY, as has been previously described (35). 299R grows on M9 medium amended with 0.2% glycerol and 2 mM o-nitrophenyl-β-galactopyranoside, a medium which has been shown to be toxic to Lac+ Escherichia coli (26). However, 299R colonies are blue on media containing X-Gal (5-bromo-4-chloro-3-indolyl-β-d-galactopyranoside), suggesting that 299R is lacZ+ but negative for lacY. Therefore, raffinose would not induce the PscrY fusion in that strain, as raffinose enters the cell via the lactose permease. (35). While growth of 299R(p61RYice) in MCA-fructose and MCA-sucrose yielded relatively high levels of ice nucleation activity, ca. 100-fold more fructose was required to achieve the same ice nucleation activity as a given amount of sucrose (Fig. 2).
FIG. 2.
Dose response of the sucrose biosensor strain 299R(p61RYice) when grown in MCA amended with various concentrations of sucrose or fructose. Each data point is the mean of the activities of at least three replicate cultures.
Since E. herbicola cannot utilize sorbose as a sole carbon source, the high level of induction by this sugar may be due to an inability to catabolize the substrate, making sorbose a gratuitous inducer. To test this hypothesis, p61RYice was mobilized into Agrobacterium tumefaciens strain 13W-4A, which can grow on sorbose. As with E. herbicola, PscrY expression was induced when A. tumefaciens(p61RYice) was grown in MCA containing 0.2% sorbose, 0.2% sucrose, or 0.2% fructose but not when it was grown in MCA-glucose (data not shown). The level of induction in MCA-sorbose was not significantly different than in MCA-sucrose, suggesting that the lack of sorbose catabolism in E. herbicola may play some role in its high level of induction. We would expect that mutants of E. herbicola harboring PscrY gene fusions that could take up but not catabolize sucrose would exhibit higher levels of reporter gene activity than the wild-type strain; in some applications, such enhanced levels of expression might enable the use of reporter genes, such as lacZ, that are not efficient reporters of transcriptional activity.
The scrY promoter has been shown to function in A. tumefaciens (data not shown) and in several enteric genera (e.g., Escherichia, Klebsiella, and Salmonella) (17). In order to test whether the PscrY fusions would be induced in taxa other than those listed above, p61RYice was mobilized into Pseudomonas fluorescens strain A506 and both p61RYice and p61RYTIR were conjugated into P. syringae pv. syringae strain B728a. No ice nucleation activity or green fluorescence was detected in any of these strains after growth in MCA-sucrose (data not shown). The scrY promoter may function in other taxa, but this has not been tested.
Characterization and comparison of the induction response for the three reporter gene fusions.
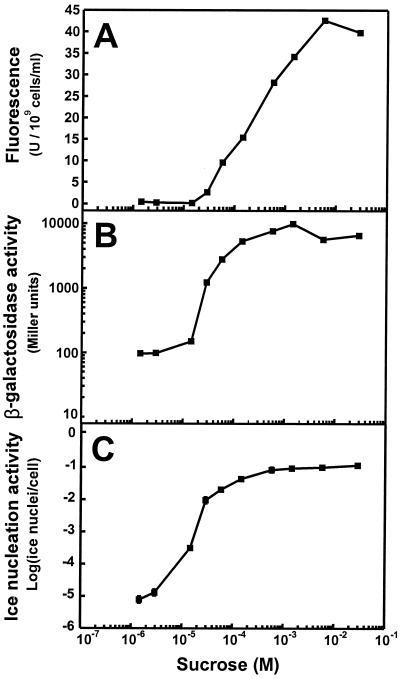
Once the specificity of the gene fusions for various sugars had been demonstrated, we wished to use these constructs to compare the relative sensitivities of the gfp, inaZ, and lacZ reporter genes to sucrose as an inducer when used in a whole-cell biosensor. Plasmids harboring these gene fusions were first mobilized into strain 299R, and the resulting transconjugants were grown in MCA in which sucrose concentrations were varied by about 10,000-fold (1.45 μM to 29 mM). The three whole-cell biosensors exhibited a qualitatively similar pattern of reporter gene activity as a function of sucrose concentration in growth media (Fig. 3). For example, maximum activity was observed at about 10−3 M or higher sucrose in all cases (Fig. 3). Likewise, activity increased rapidly with sucrose concentrations over the range of about 10−5 to 10−3 M. All three strains showed similar maximum proportional levels of induction at high sucrose concentrations compared to sucrose-free media: 183-fold in 299R(p61TYTIR) (Fig. 3A), 103-fold in 299R(p61RYlac) (Fig. 3B), and 122-fold (corresponding to a 15,000-fold difference in ice nucleation activity) in 299R(p61RYice) (Fig. 3C). However, there were quantitative differences between the three strains in their responses to low sucrose concentrations. Little reporter gene activity was observed in all three strains at the lowest concentration of sucrose tested (1.45 μM). However, whereas GFP fluorescence in 299R(p61RYTIR) and β-galactosidase activity in 299R(p61RYlac) were induced less than 2-fold at 14.5 μM sucrose, inaZ expression in 299R(p61RYice) was induced 6.5-fold (35-fold higher ice nucleation activity) at the same sucrose concentration. In fact, while no induction of GFP fluorescence or β-galactosidase activity was seen in MCA containing 2.9 μM sucrose, significantly higher ice nucleation activity was observed at that sucrose concentration. In MCA containing 29 μM sucrose, GFP fluorescence and β-galactosidase activity in both 299R(p61RYTIR) and 299R(p61RYlac), respectively, were induced 11- to 13-fold but inaZ expression in 299R(p61RYice) was induced 35-fold. It is likely that with all three reporter genes tested in this study the level of transcriptional activity mediated by low sucrose concentrations was underestimated since the host strain, E. herbicola 299R, is capable of rapid catabolism of sucrose. Thus, the cells probably depleted the concentration of this inducer, at least partially, at low initial sucrose concentrations, during the 3-h period of exposure of the whole-cell biosensor to sucrose. Therefore, some cells produced during the later part of this exposure period may have experienced lower sucrose concentrations than that estimated from initial sugar concentrations. Furthermore, mutants of E. herbicola that could take up but not catabolize sucrose might be preferable hosts for PscrY reporter gene fusions in studies in which sucrose biosensors are to be used to estimate only initial concentrations of this sugar in a habitat rather than the process of sugar consumption, since they would not be capable of altering the abundance of the compound to which they were responsive.
FIG. 3.
Dose response of the sucrose biosensor strains 299R(p61RYTIR) (A), 299R(p61RYlac) (B), and 299R(p61RYice) (C) when grown in MCA amended with various concentrations of sucrose. Each data point is the mean of the activities of four replicate cultures.
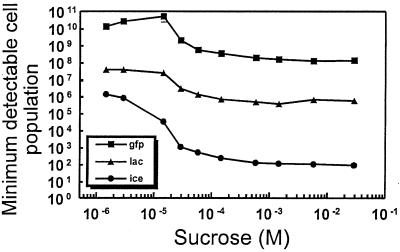
Since GFP fluorescence, ice nucleation activity, and β-galactosidase activity are quantified by different procedures and expressed in different units, it would be difficult to compare the three reporter gene systems directly. Given the fact that the response over all concentrations of sucrose is nonlinear for each of the three transcriptional fusions in 299R, only an approximate comparison between any two reporter genes (e.g., x Miller units = y INA units) is possible. In order to obtain a more direct comparison, the numbers of cells necessary to achieve the level of expression for each assay that represents the lowest reliable value were calculated for each reporter gene at each concentration of sucrose inducer (Fig. 4). The minimum detectable levels for GFP fluorescence, ice nucleation activity, and β-galactosidase activity were estimated to be 5 fluorescence units, 1 Miller unit, and 10 ice nuclei per sample, respectively. Therefore, for example, in 299R(p61RYice), 87 cells were necessary to obtain 10 ice nuclei in cells exposed to the highest concentration of sucrose but 1.3 × 10⁶ cells were necessary at the lowest sucrose concentration. Figure 4 illustrates the relative efficiencies of the three reporter gene systems. InaZ is by far the most efficient of the three reporter proteins, followed by LacZ and then GFP. Additionally, whereas the lacZ and gfp fusions show a similar difference in the minimum detectable cell populations over all concentrations of sucrose (340-fold at 1.45 μM versus 240-fold at 29 mM), the exponential relationship between InaZ and ice nucleation activity effectively “amplifies” this reporter gene signal. Thus, InaZ is much more efficient, compared to LacZ, at the higher concentrations of sucrose (6,100-fold difference at 29 mM) than at the lowest sucrose concentration (30-fold difference at 1.45 μM).
FIG. 4.
Comparison of the sensitivities of the three sucrose biosensor strains. The minimum detectable cell population is defined as the number of cells necessary to achieve the limit of detectability for each enzyme assay: 1 Miller unit, 5 fluorescence units, and 10 ice nuclei for LacZ, GFP, and InaZ, respectively. Each data point was calculated using the reporter gene activity values shown in Fig. 3.
Analysis of PscrY-gfp expression in individual cells.
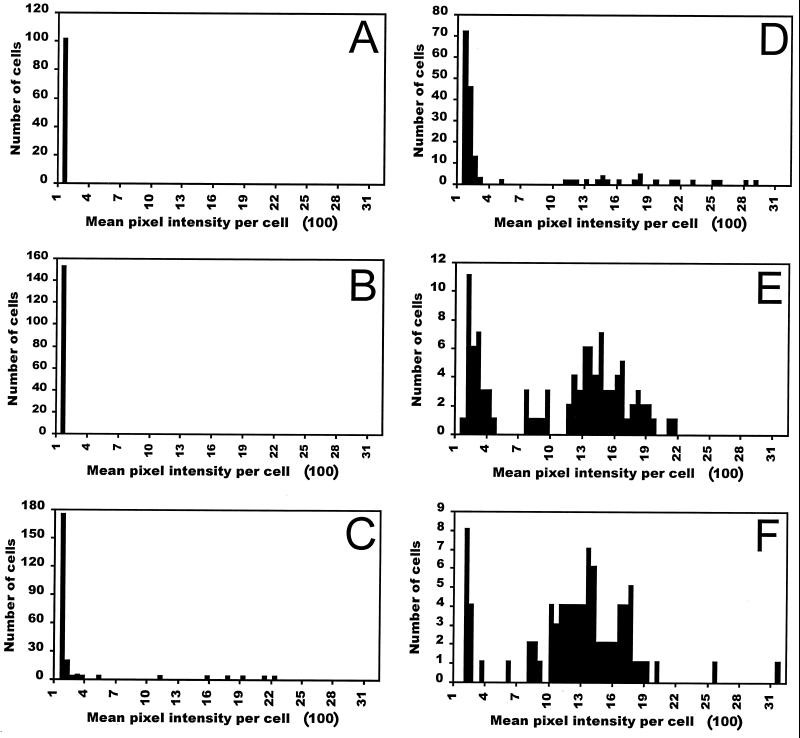
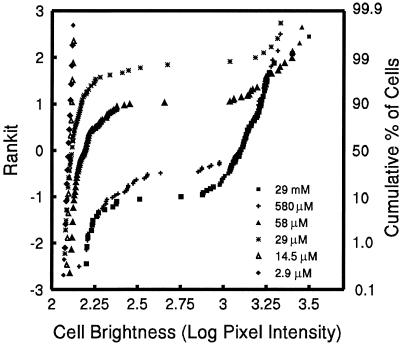
Analysis of digital images of the fluorescence of individual cells of 299R(p61RYTIR) obtained by epifluorescence microscopy enabled the quantitative assessment of the mean pixel intensity of each cell within a population of bacterial cells. The parental strain 299R exhibited negligible fluorescence at the excitation and emission wavelengths used in this study, when grown in MCA containing glucose. The mean fluorescence intensity of 299R(p61RYTIR) cells grown in MCA containing 0 to 14.5 μM sucrose was not different from that of cells that did not harbor the PscrY-gfp fusion (Fig. 5). However, the mean fluorescence intensity per cell increased significantly at sucrose concentrations of 29 μM and higher (Fig. 5 and 6). The frequency of cells showing fluorescence intensities higher than background levels (mean pixel intensity >125 units) increased with increasing sucrose concentrations, and average fluorescence intensities of 146, 223, 781, and 984 pixel intensity units for a large collection of cells cultured in 29 μM, 58 μM, 580 μM, and 29 mM sucrose were observed (Fig. 5 and 6). Thus, quantitative digital image analysis revealed a response of the biosensor to various concentrations of sucrose at the population level that was similar to that obtained for fluorescence of aliquots of the same culture measured with a fluorimeter (Fig. 3A).
FIG. 5.
Histograms of the distribution of the mean pixel intensity per cell of E. herbicola 299R(p61RYTIR) cells containing a PscrY-gfp transcriptional fusion and grown in MCA supplemented with sucrose at 0 μM (A), 14.5 μM (B), 29 μM (C), 58 μM (D), 580 μM (E), and 29 mM (F).
FIG. 6.
Cumulative probability plot of the log-transformed estimate of mean fluorescence intensity of individual cells of E. herbicola 299R(p61RYTIR) cells cultured in MCA containing various sucrose concentrations.
The percentage of cells within a population of cells in which increased expression of PscrY-gfp could be detected varied greatly depending on the sucrose concentration in the medium (Fig. 5). The frequency of highly fluorescent cells increased with increasing sucrose concentrations of 29 μM and higher. The fluorescence intensities within populations of cells grown at intermediate concentrations of the inducer varied over a broad range, with only a few bright cells observed among many relatively dim ones. Because most histograms shown in Fig. 5 indicated a right-hand skewed frequency distribution, a graphical assessment of the distribution of the log-transformed mean pixel intensity per cell was made. The plot revealed a bimodal distribution of cell fluorescence for sucrose concentrations ranging from 29 μM to 29 mM (Fig. 6). Two approximately straight lines resulting from the plot of cumulative normal probability score versus log-transformed mean pixel intensity per cell indicated the existence of two subpopulations of cells expressing PscrY-gfp, each described by a log-normal distribution (a frequent distribution in biological systems) (13, 14, 19). Indeed, very few cells grown with sucrose at any concentration exhibited a mean fluorescence intensity in the intermediate range (log 2.5 to 2.8). At intermediate sucrose concentrations the majority of the cells were relatively dim but nevertheless were clearly induced to a level higher than the background level observed in cells exposed to 0, 2.9, and 14.5 μM sucrose. Interestingly, a small percentage of the cells in intermediate sucrose concentrations expressed PscrY-gfp at a level comparable to that of cells exposed to high sucrose concentrations; the flatter lines on the cumulative probability plot suggest a higher variance in the mean fluorescence of the cells within that more fluorescent subpopulation. Thus, all cells responded to intermediate sucrose concentrations, although with different levels of PscrY expression. As noted above, the opposite was observed for cells exposed to high sucrose concentrations: nearly all were highly induced, except for a very few that exhibited low fluorescence.
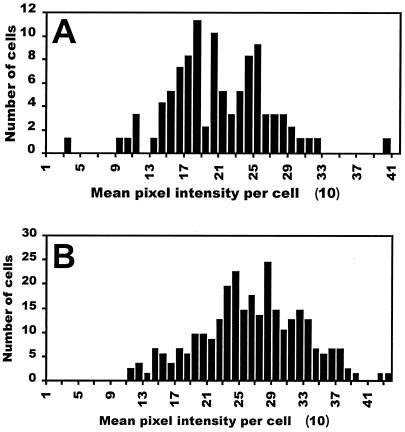
In order to determine whether the differences in the distribution of PscrY-gfp expression in strain 299R grown in various sucrose concentrations reflected true variations in the activity of the PscrY promoter, we tested the effect of sucrose on the fluorescence of 299R(pKT-bla) cells. pKT-bla contains the ampicillin resistance gene promoter from pBR322 (Pbla) fused to gfp on a homologous plasmid backbone. This fusion was expected to be constitutively expressed and, therefore, insensitive to environmental conditions such as sucrose concentration. Strain 299R(pKT-bla) was cultured in 58 μM and 29 mM sucrose under the same growth conditions as 299R(p61RYTIR). Analysis of the fluorescence of individual cells of 299R(pKT-bla) revealed homogenous levels of Pbla-gfp activity among cell populations grown at the above sucrose concentrations (Fig. 7). The results from the Kolmogorov-Smirnov statistical test confirmed that Pbla-gfp expression at all tested sucrose concentrations was best described by a normal distribution. Therefore, the heterogeneity of PscrY-gfp expression observed at intermediate and high sucrose concentrations reflects variation of the activity of the promoter in response to sucrose rather than variation in the function of GFP per se.
FIG. 7.
Histograms of the distribution of the mean pixel intensity per cell of E. herbicola 299R(pKT-bla) cells containing a Pbla-gfp transcriptional fusion and grown in MCA supplemented with 58 μM (A) and 29 mM (B) sucrose. The Kolmogorov-Smirnov statistics for these two distributions are D = 0.064 and P = 0.43 (A) and D = 0.035 and P = 0.52 (B).
The observation that partially induced bacterial cells exhibited high heterogeneity of expression has been previously reported for β-galactosidase activity and for expression of araBAD-gfp fusions in E. coli cells that were induced with isopropyl-β-d-thiogalactopyranoside (33) and arabinose (36), respectively. In both of these systems the gene encoding the cognate permease is part of its operon which is derepressed in the presence of inducer. As was suggested for the lac operon (25, 32) and the ara regulon (36), it is possible that at subsaturating levels of the inducer (sucrose) in the medium, the rare cells that have a small amount of the sucrose permease due to random cellular induction events accumulate enough sucrose to induce the active uptake of additional inducer and thereby enable the full expression of the PscrY-gfp fusion. This “snowball effect,” or autocatalytic event, would cause a few cells to be very fluorescent among a population of relatively nonfluorescent cells, and their frequency would be dependent on the amount of sucrose in the culture. It is interesting, however, that even at relatively low sucrose concentrations, some apparent induction of the sucrose operon occurred. Thus, perhaps, all cells have at least a low basal level of permease, enabling them to respond, albeit weakly, to the presence of low sucrose concentrations in their vicinity. While it is only a weak response, the increased fluorescence of 299R(p61RYTIR) cells in the presence of low sucrose concentrations would enable the abundance of the inducer to be inferred from measurements of cell fluorescence.
The presence of a few dark cells in cultures grown in high sucrose concentrations may be due to the sequestration or reversible inactivation of GFP in a small percentage of the cells. Indeed, this subgroup of weakly fluorescent cells at saturating sucrose concentrations was not observed when cells from the same samples were fixed with 4% paraformaldehyde prior to cytological analysis (data not shown). The resulting increase in the homogeneity of fluorescence intensities among these cell populations thus reflects an increase in GFP availability or activity after paraformaldehyde treatment in a small number of cells rather than an increase in the amount of GFP per se.
Quantification of PscrY-gfp expression in situ on plants.
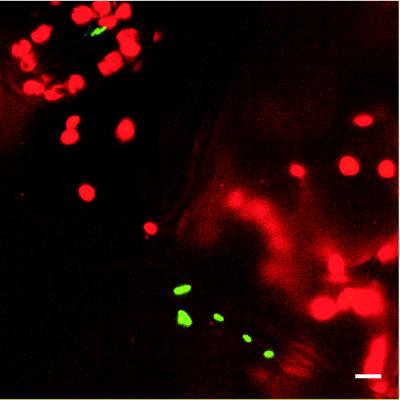
We compared the utility of the gfp- and inaZ-based sucrose biosensors in estimating sucrose availability on bean leaf surfaces, a common bacterial habitat. We were particularly interested in knowing if the estimates of sugar variability on leaves measured at the single-cell level with the gfp-based biosensor construct in E. herbicola provided results consistent with that of the population-level estimates of the inaZ-based biosensor and whether they both were sufficiently efficient to detect the low concentrations of sugar expected to be on moist leaf surfaces (28). Qualitative estimates of the distribution of GFP fluorescence among cells of E. herbicola 299R(p61RYTIR) was obtained by direct visualization of leaf surfaces 48 h after inoculation by confocal laser scanning microscopy (CLSM). The large majority of cells of the biosensor strain on leaves were dim and could be visualized only in long-duration exposures. A few cells in most fields of view, however, exhibited bright GFP fluorescence; these cells often occurred as dispersed individual cells that were markedly brighter than surrounding cells, although occasionally several bright cells were found in close proximity (Fig. 8). The bright cells appear larger than the dimmer cells in an image due to an optical artifact associated with their brightness and hence their “overexposure” in images captured to visualize many cells in a field. We did not pursue spatial scale studies to determine if such sites of apparent localized sugar concentration were associated with particular features of the leaf, but we can conclude that such localizations were uncommon on leaves.
FIG. 8.
CLSM image of cells of E. herbicola 299R(p61RYTIR) expressing high levels of PscrY-gfp on a stomate and at the junction of plant cells of a colonized bean leaf 2 days after inoculation. The image is an overlay of two projected z series captured with channel 1 (λem = BP 525/50 to detect GFP fluorescence) and channel 2 (λem = LP 590 to detect the autofluorescence of leaf tissue) of a Leica TCS4D confocal laser scanning microscope (Leica Lasertechnik, Heidelberg, Germany) equipped with argon and krypton lasers. Bar, 5 μm.
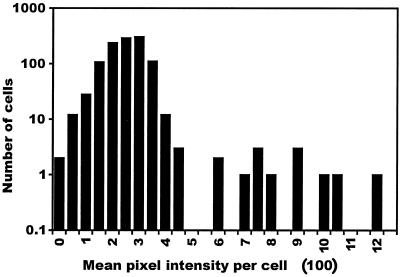
A more quantitative assessment of the distribution of GFP fluorescence was obtained by visualization under the epifluorescence microscope of cells that were removed from leaves. To ensure that we visualized all cells of E. herbicola 299R(p61RYTIR) and only cells of this strain in bacteria recovered from leaves, we applied FISH using a rhodamine-labeled probe specific to E. herbicola strain 299R in conjunction with GFP fluorescence measurements. Consistent with results of direct imaging of cells on leaves by CLSM, only about 3% of the cells of the sucrose biosensor exhibited bright GFP fluorescence. The GFP fluorescence intensity of cells recovered from leaves was distinctly bimodal in its frequency distribution, with about 97% of cells exhibiting only dim fluorescence and about 3% exhibiting over fourfold-higher fluorescence (Fig. 9). Thus, although local sites colonized by cells with high GFP fluorescence were occasionally observed directly on leaves (Fig. 8), such cells apparently are relatively rare in a population of E. herbicola 299R(p61RYTIR) on the leaf surface.
FIG. 9.
Histogram of the distribution of GFP fluorescence among individual cells of E. herbicola 299R(p61RYTIR) recovered from bean leaves 48 h after inoculation.
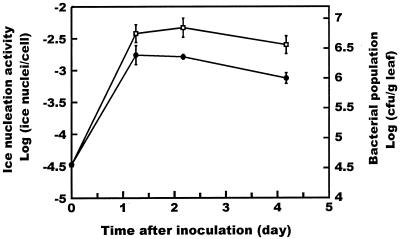
Similar estimates of the average concentration of sucrose present on moist bean leaves were provided by both the gfp- and inaZ-based sucrose biosensors. The average ice nucleation activity of E. herbicola 299R(p61RYice) increased from about 10−4.5 ice nuclei/cell in cells grown in MCA-glucose as the inoculum to about 10−2.5 ice nuclei/cell within about 1 day after inoculation onto bean leaves (Fig. 10); little further change in ice nucleation activity occurred after this time. If we assume that sucrose was the dominant sugar present on these bean leaves, as in other studies (28), then the ice nucleation activity was reflective of cells grown in a homogeneous culture medium with a sucrose concentration of about 20 μM (Fig. 3C). Likewise, the fraction of cells of E. herbicola 299R(p61RYTIR) recovered from leaves that exhibited bright GFP fluorescence was slightly lower than that of cells of this strain when cultured in media containing 29 μM sucrose (Fig. 5C) but higher than when grown in 14 μM sucrose (Fig. 5B). Given that most of the cells of E. herbicola 299R(p61RYTIR) that exhibited bright GFP fluorescence occurred in a solitary pattern across the leaf surface, we can assume that most cells on the leaves were not exposed to relatively high sucrose concentrations. While we cannot rule out the possibility that a wide range of sugar abundances might occur on leaves and thus that some cells might have been exposed to only very low sugar concentrations, the two biosensors both indicate that the average sucrose concentration on moist leaves was about 20 μM. Importantly, since a moist bean leaf harbors about 0.5 ml of water, an average sucrose concentration of 20 μM would represent about 3 μg of sucrose on a leaf. This is very close to the amount of sucrose measured on bean leaves in a previous study (28). Thus, while it is outside the scope of this study to use the biological sensors for sucrose to evaluate the many factors that will control sugar availability on leaves, the results presented here indicate that both gfp- and inaZ-based sucrose biosensors are sufficiently sensitive to quantify sugar availability in situ. The gfp-based biosensor has the added potential to provide information on the variability of sugar availability on leaves.
FIG. 10.
Time course expression of PscrY-inaZ in the bean phyllosphere. The population (closed circles) and ice nucleation activity (open squares) of E. herbicola 299R(p61RYice) were determined over time after inoculation onto bean plants. The bars represent the standard errors of the mean log-transformed bacterial population size per gram of leaf tissue and of the mean number of log-transformed ice nuclei per cell.
The various reporter genes tested differ in their ease of use and the type of information provided. To obtain population-level average estimates of the rate of transcription of target genes, the ice nucleation assays are more rapid and more sensitive than the lacZ and gfp reporter genes (22) (Fig. 4). The much higher sensitivity of inaZ is a major advantage in ecological studies, since many environmental samples will contain relatively small numbers of bacterial cells. For example, studies of the transcription of genes in bacterial cells in the rhizosphere will usually involve fewer than 106 cells per root (23). Promoter fusions to inaZ could easily be used to detect transcription in such small samples. In fact, when rates of transcription of target genes are relatively high, such as in scrY-inaZ fusions in this study, the activity of samples containing as few as about 100 cells can be measured (Fig. 4). This would enable very small samples, such as small root segments, to be examined. In fact, 299R(p61RYice) was sufficiently sensitive to sucrose exudation from roots to provide estimates of differential sugar availability at different portions of Avena roots which were inoculated with this whole-cell biosensor (16). In contrast, many more lacZ gene fusion-containing cells are required for measurements of transcriptional activity (Fig. 4). While lacZ has been successfully used in environmental measurements, the number of cells in these studies was quite high (8, 22, 31). Interestingly, measurements of GFP fluorescence in bulk cell samples with a fluorimeter do not offer the sensitivity of enzymatic assays, such as of β-galactosidase for estimation of transcription activity (Fig. 4). Apparently, large numbers of cells will be required for fluorimetric measurements of GFP activity. While inaZ and lacZ can provide estimates of average rates of transcription in situ, they cannot easily be used to assess variation in transcription among individual cells, such as might be expected of whole-cell biological sensors in a heterogenous environment. Fluorescence microscopy could readily distinguish even small differences in GFP fluorescence of individual cells (Fig. 5, 6, and 9). Interestingly, we found that fluorimeter measurements of bulk cell suspensions were as sensitive in detection of GFP fluorescence as fluorescence microscopy of the same cells (Fig. 3, 5, and 6). We did not compare the sensitivity or resolving power of fluorescence microscopy with those of fluorescence cell sorters, which have also been used in conjunction with bacterial cells expressing GFP (2, 38), but based on the reported resolution of GFP fluorescence, fluorescence microscopy appears to be superior. Clearly, analysis of digital images obtained during fluorescence microscopy may be more demanding, but the results can provide insight into features such as the nonuniform induction by sucrose-responsive promoters as observed here (Fig. 5 and 6). As demonstrated in this study, quantitative estimates of GFP fluorescence associated with whole-cell biosensors harboring gfp gene fusions have promise for the characterization of the external environment of bacterial cells.
ACKNOWLEDGMENTS
We thank S. Ruzin and Denise Schichnes of the Biological Imaging Facility of the College of Natural Resources at the University of California at Berkeley for their help with cytological analysis and A. J. Pittard, Dan Roberts, and Luellen Pierce for providing strains and plasmids.
This work was funded in part by grant 96-35303-3377 from the U.S. Department of Agriculture Competitive Grants Program of the National Research Initiative and by grant DEB-9615280 from the National Science Foundation.
REFERENCES
- 1.Amann R I. In situ identification of micro-organisms by whole cell hybridization with rRNA-targeted nucleic acid probes. In: Akkermans A D L, Van Elsas J D, de Bruijn F J, editors. Molecular microbial ecology manual. Dordrecht, The Netherlands: Kluwer Academic Publishers; 1995. pp. 3.3.6/1–3.3.6/15. [Google Scholar]
- 2.Barker L P, Brooks D M, Small P L. The identification of Mycobacterium marinum genes differentially expressed in macrophage phagosomes using promoter fusions to green fluorescent protein. Mol Microbiol. 1998;29:1167–1177. doi: 10.1046/j.1365-2958.1998.00996.x. [DOI] [PubMed] [Google Scholar]
- 3.Bolivar F, Rodriguez R L, Greene P J, Betlach M C, Heyneker H L, Boyer H W. Construction and characterization of new cloning vehicles. II. A multipurpose cloning system. Gene. 1977;2:95–113. [PubMed] [Google Scholar]
- 4.Brandl T M, Lindow S E. Contribution of indole-3-acetic acid production to the epiphytic fitness of Erwinia herbicola. Appl Environ Microbiol. 1998;64:3256–3263. doi: 10.1128/aem.64.9.3256-3263.1998. [DOI] [PMC free article] [PubMed] [Google Scholar]
- 5.Burlage R S, Kuo C T. Living biosensors for the management and manipulation of microbial consortia. Annu Rev Microbiol. 1994;48:291–309. doi: 10.1146/annurev.mi.48.100194.001451. [DOI] [PubMed] [Google Scholar]
- 6.Chalfie M, Tu Y, Euskirchen G, Ward W W, Prasher D C. Green fluorescent protein as a marker for gene expression. Science. 1994;263:802–805. doi: 10.1126/science.8303295. [DOI] [PubMed] [Google Scholar]
- 7.Cowan P J, Nagesha H, Leonard L, Howard J L, Pittard A J. Characterization of the major promoter for the plasmid-encoded sucrose genes scrY, scrA, and scrB. J Bacteriol. 1991;173:7464–7470. doi: 10.1128/jb.173.23.7464-7470.1991. [DOI] [PMC free article] [PubMed] [Google Scholar]
- 8.De Weger L A, Dekkers L C, Van Der Bij A J, Lugtenberg B J J. Use of phosphate-reporter bacteria to study phosphate limitation in the rhizosphere and in bulk soil. Mol Plant-Microbe Interact. 1994;7:32–38. [Google Scholar]
- 9.Dumas B, Centis S, Sarrazin N, Esquerre-Tugaye M T. Use of green fluorescent protein to detect expression of an endopolygalacturonase gene of Colletotrichum lindemuthianum during bean infection. Appl Environ Microbiol. 1999;65:1769–1771. doi: 10.1128/aem.65.4.1769-1771.1999. [DOI] [PMC free article] [PubMed] [Google Scholar]
- 10.Duncan S, Glover L A, Killham K, Prosser J I. Luminescence-based detection of activity of starved and viable but nonculturable bacteria. Appl Environ Microbiol. 1994;60:1308–1316. doi: 10.1128/aem.60.4.1308-1316.1994. [DOI] [PMC free article] [PubMed] [Google Scholar]
- 11.Green R L, Warren G J. Physical and functional repetition in a bacterial ice nucleation gene. Nature (London) 1985;317:645–648. [Google Scholar]
- 12.Heim R, Prasher D C, Tsien R Y. Wavelength mutations and posttranslational autoxidation of green fluorescent protein. Proc Natl Acad Sci USA. 1994;91:12501–12504. doi: 10.1073/pnas.91.26.12501. [DOI] [PMC free article] [PubMed] [Google Scholar]
- 13.Hirano S S, Nordheim E V, Arny D C, Upper C D. Lognormal distribution of epiphytic bacterial populations on leaf surfaces. Appl Environ Microbiol. 1982;44:695–700. doi: 10.1128/aem.44.3.695-700.1982. [DOI] [PMC free article] [PubMed] [Google Scholar]
- 14.Ishimaru C, Eskridge K M, Vidaver A K. Distribution analysis of naturally occurring epiphytic populations of Xanthomonas campestris pv. phaseoli on dry beans. Phytopathology. 1991;82:262–268. [Google Scholar]
- 15.Jacobi C A, Roggenkamp A, Rakin A, Zumbihl R, Leitritz L, Heesemann J. In vitro and in vivo expression studies of yopE from Yersinia enterocolitica using the gfp reporter gene. Mol Microbiol. 1998;30:865–882. doi: 10.1046/j.1365-2958.1998.01128.x. [DOI] [PubMed] [Google Scholar]
- 16.Jaeger C H, III, Lindow S E, Miller W, Clark E, Firestone M K. Mapping of sugar and amino acid availability in soil around roots with bacterial sensors of sucrose and tryptophan. Appl Environ Microbiol. 1999;65:2685–2690. doi: 10.1128/aem.65.6.2685-2690.1999. [DOI] [PMC free article] [PubMed] [Google Scholar]
- 17.Jahreis K, Lengeler J W. Molecular analysis of two ScrR repressors and of a ScrR-FruR hybrid repressor for sucrose and D-fructose specific regulons from enteric bacteria. Mol Microbiol. 1993;9:195–209. doi: 10.1111/j.1365-2958.1993.tb01681.x. [DOI] [PubMed] [Google Scholar]
- 18.Kay R, McPherson J. Hybrid pUC vectors for addition of new restriction enzyme sites to the ends of DNA fragments. Nucleic Acids Res. 1987;15:2778. doi: 10.1093/nar/15.6.2778. [DOI] [PMC free article] [PubMed] [Google Scholar]
- 19.Kinkel L, Wilson M, Lindow S E. Effects of scale on estimates of epiphytic bacterial populations. Microb Ecol. 1995;29:283–297. doi: 10.1007/BF00164891. [DOI] [PubMed] [Google Scholar]
- 20.Lindgren P B, Frederick R, Govindarajan A G, Panopoulos N J, Staskawicz B J, Lindow S E. An ice nucleation reporter gene system: identification of inducible pathogenicity genes in Pseudomonas syringae pv. phaseolicola. EMBO J. 1989;8:1291–1301. doi: 10.1002/j.1460-2075.1989.tb03508.x. [DOI] [PMC free article] [PubMed] [Google Scholar]
- 21.Lindow S E. Bacterial ice nucleation activity. In: Klement S, Rudolf K, Sands D C, editors. Methods in phytobacteriology. Budapest, Hungary: Akademiai Kiado; 1990. pp. 185–198. [Google Scholar]
- 22.Lindow S E. The use of reporter genes in the study of microbial ecology. Mol Ecol. 1995;4:555–566. [Google Scholar]
- 23.Loper J E, Henkels M D. Availability of iron to Pseudomonas fluorescens in rhizosphere and bulk soil evaluated with an ice nucleation reporter gene. Appl Environ Microbiol. 1997;63:99–105. doi: 10.1128/aem.63.1.99-105.1997. [DOI] [PMC free article] [PubMed] [Google Scholar]
- 24.Loper J E, Lindow S E. A biological sensor for iron available to bacteria in their habitats on plant surfaces. Appl Environ Microbiol. 1994;60:1934–1941. doi: 10.1128/aem.60.6.1934-1941.1994. [DOI] [PMC free article] [PubMed] [Google Scholar]
- 25.Maloney P C, Rotman B. Distribution of suboptimally induced -d-galactosidase in Escherichia coli. The enzyme content of individual cells. J Mol Biol. 1973;73:77–91. doi: 10.1016/0022-2836(73)90160-5. [DOI] [PubMed] [Google Scholar]
- 26.Martinez D, Whitehouse F., Jr Selective autocytotoxicity in a model system of Escherichia coli K-12 recombinants. J Bacteriol. 1973;114:882–884. doi: 10.1128/jb.114.2.882-884.1973. [DOI] [PMC free article] [PubMed] [Google Scholar]
- 27.Meikle A, Glover L A, Killham K, Prosser J I. Potential luminescence as an indicator of activation of genetically-modified Pseudomonas fluorescens in liquid culture and in soil. Soil Biol Biochem. 1994;26:747–755. [Google Scholar]
- 28.Mercier J, Lindow S E. Role of leaf surface sugars in colonization of plants by bacterial epiphytes. Appl Environ Microbiol. 2000;66:369–374. doi: 10.1128/aem.66.1.369-374.2000. [DOI] [PMC free article] [PubMed] [Google Scholar]
- 29.Miller W G, Lindow S E. An improved GFP cloning cassette designed for prokaryotic transcriptional fusions. Gene. 1997;191:149–153. doi: 10.1016/s0378-1119(97)00051-6. [DOI] [PubMed] [Google Scholar]
- 30.Miller W G, Leveau J H J, Lindow S E. Improved gfp and inaZ broad-host-range promoter-probe vectors. Mol Plant-Microbe Interact. 2000;13:1243–1250. doi: 10.1094/MPMI.2000.13.11.1243. [DOI] [PubMed] [Google Scholar]
- 31.Mo Y Y, Gross D C. Expression in vitro and during plant pathogenesis of the syrB gene required for syringomycin production by Pseudomonas syringae pv. syringae. Mol Plant-Microbe Interact. 1991;4:28–36. [Google Scholar]
- 32.Novick A, Weiner M. Enzyme induction as an all-or-none phenomenon. Proc Natl Acad Sci USA. 1957;43:553–566. doi: 10.1073/pnas.43.7.553. [DOI] [PMC free article] [PubMed] [Google Scholar]
- 33.Poulsen L K, Dalton H M, Angles M L, Marshall K C, Molin S, Goodman A E. Simultaneous determination of gene expression and bacterial identity in single cells in defined mixtures of pure cultures. Appl Environ Microbiol. 1997;63:3698–3702. doi: 10.1128/aem.63.9.3698-3702.1997. [DOI] [PMC free article] [PubMed] [Google Scholar]
- 34.Schmid K, Ebner R, Altenbuchner J, Schmitt R, Lengeler J W. Plasmid-mediated sucrose metabolism in Escherichia coli K12: mapping of the scr genes of pUR400. Mol Microbiol. 1988;2:1–8. doi: 10.1111/j.1365-2958.1988.tb00001.x. [DOI] [PubMed] [Google Scholar]
- 35.Schmid K, Schupfner M, Schmitt R. Plasmid-mediated uptake and metabolism of sucrose by Escherichia coli K-12. J Bacteriol. 1982;151:68–76. doi: 10.1128/jb.151.1.68-76.1982. [DOI] [PMC free article] [PubMed] [Google Scholar]
- 36.Siegele D A, Hu J C. Gene expression from plasmids containing the araBAD promoter at subsaturating inducer concentrations represents mixed populations. Proc Natl Acad Sci USA. 1997;94:8168–8172. doi: 10.1073/pnas.94.15.8168. [DOI] [PMC free article] [PubMed] [Google Scholar]
- 37.Simons R W, Houman F, Kleckner N. Improved single and multicopy lac-based cloning vectors for protein and operon fusions. Gene. 1987;53:85–96. doi: 10.1016/0378-1119(87)90095-3. [DOI] [PubMed] [Google Scholar]
- 38.Valdivia R H, Falkow S. Bacterial genetics by flow cytometry: rapid isolation of Salmonella typhimurium acid-inducible promoters by differential fluorescence induction. Mol Microbiol. 1996;22:367–378. doi: 10.1046/j.1365-2958.1996.00120.x. [DOI] [PubMed] [Google Scholar]
- 39.Webb C D, Decatur A, Teleman A, Losick R. Use of green fluorescent protein for visualization of cell-specific gene expression and subcellular protein localization during sporulation in Bacillus subtilis. J Bacteriol. 1995;177:5906–5011. doi: 10.1128/jb.177.20.5906-5911.1995. [DOI] [PMC free article] [PubMed] [Google Scholar]
- 40.Wilson M, Lindow S E. Coexistence among epiphytic bacterial populations mediated through nutritional resource partitioning. Appl Environ Microbiol. 1994;60:4468–4477. doi: 10.1128/aem.60.12.4468-4477.1994. [DOI] [PMC free article] [PubMed] [Google Scholar]


