Abstract
Context
Di-2-ethylhexyl phthalate (DEHP), a known persistent organic pollutant, can increase the sperm DNA fragmentation index (DFI).
Objective
To investigate the mechanism underlying the repair of DEHP-induced sperm DNA damage in mice by Wuwei Fuzheng Yijing (WFY) formula.
Materials and methods
The potential targets of WFY and sperm DNA fragment (SDF) were obtained from the TCMSP, BATMAN-TCM, OMIM and GeneCards. The protein–protein interaction (PPI) network, GO and KEGG pathway analyses of WFY-SDF were constructed. An animal model of DEHP-induced sperm DNA damage was replicated by gavage of SPF ICR (CD1) mice DEHP at 1 g/kg/d and treated with WFY at 8.92, 17.84 and 35.67 g/kg, respectively, for 60 d. Sperm DFI of each group was detected and compared. The target genes of WFY identified by transcriptomic and proteomic analyses were validated by qRT-PCR and Western blotting.
Results
Network pharmacology pathway analysis indicated that PI3K/Akt was the potential target of WFY on SDF. The DFI of the DEHP group (25.48%) was significantly higher than that of the control group (4.02%). The high-dose WFY group (19.05%) exhibited the most significant repairing effect. The related pathways were PI3K/Akt and metabolic. Aass, Aldh1a7, GSTA3, betaine homocysteine S-methyltransferase (Bhmt), Mug2 and Svs1 were screened and Bhmt was validated.
Discussion and conclusions
WFY can repair sperm DNA damage caused by DEHP, and the mechanism may be related to PI3K/Akt and metabolic pathways, and Bhmt. This provides a new direction for using traditional Chinese medicine to prevent and repair reproductive system injury caused by pollutants.
Keywords: Endocrine-disrupting chemical (EDC), traditional Chinese medicine (TCM), sperm chromatin structure assay (SCSA), RNA-seq, data-independent acquisition (DIA), PI3K/Akt, Bhmt
Introduction
It is estimated that approximately 15% of couples of childbearing ages suffer from infertility worldwide, and the incidence is increasing year by year. Approximately, half of infertility cases are attributed to male factors (Inhorn and Patrizio 2015). The semen quality of men has decreased gradually. In the 50 years from 1940 to 1990, the sperm density decreased from 113 × 106/mL to 66 × 106/mL. As seen from the different editions of the World Health Organization (WHO) Laboratory Manual for the Examination and Processing of Human Semen (hereafter referred to as the Manual), semen quality is progressively worsening (WHO 1980). The first edition of the Manual, published in 1980, states that the normal semen density is 60 × 106/mL, but it has been changed to 15 × 106/mL in the fifth edition of the Manual published in 2010 (WHO 2010). In just 70 years, the sperm density has dropped to about a tenth of what it used to be. More worryingly, neither the exact cause of the sperm quality decline nor an effective treatment for it has been found.
Routine semen analysis cannot accurately evaluate men’s fertility. Approximately, one-quarter of men with infertility have normal semen analysis parameters (Molina et al. 2019). Half of an embryo’s chromosomes are made up of sperm DNA. The integrity of sperm DNA is critical to pregnancy and embryo development (Wang YY et al. 2019). In recent years, the sperm DNA fragmentation index (DFI) has become a commonly used index to evaluate the severity of sperm DNA fragmentation (SDF) (Bungum 2017). A DFI greater than 27% is associated with infertility or spontaneous abortion (Ioannou et al. 2016).
Di-2-ethylhexyl phthalate (DEHP), a recognized endocrine-disrupting chemical (EDC) widely used as a plasticizer in the production of polyvinylchloride (PVC) plastics is associated with anti-androgen activity and male reproductive toxicity (Dostalova et al. 2020). As a main phthalate ester (PAE) pollutant in the environment, DEHP is detected in atmospheric particulate matter, fresh water and sediments, soil and landfills (Szewczyńska et al. 2020). With a hydrolysis half-life of more than 100 years at pH 8 and 30 °C, DEHP is a persistent contaminant that poses a significant threat to human reproduction (WHO 1992). At present, DEHP has been found to decrease sperm quality, increase SDF, and damage the offspring’s reproductive system (Axelsson et al. 2015).
Although DEHP has been found to damage the human reproductive system, few measures or treatments have been developed specifically for this harm. Wuwei Fuzheng Yijing (WFY) formula is comprised of Astragalus membranaceus (Fisch.) Bunge (Leguminosae), Lycium barbarum L. (Solanaceae), Cyathula officinalis K.C.Kuan (Amaranthaceae), Schisandra chinensis (Turcz.) Baill. (Schisandraceae) and Plantago asiatica L. (Plantaginaceae). WFY is a traditional Chinese medicine (TCM) formula commonly used to repair SDF in our clinical practice for several decades and was modified according to Wuzi Yanzong Pill (WZYZP). WZYZP is a classical TCM prescription for treatment of oligoasthenospermia and SDF (Zhao MP et al. 2018). Compared with WZYZP, we found that WFY has a better effect on repairing SDF in clinical practice but the mechanism by which WFY repairs idiopathic sperm DNA damage is unknown. In this study, we established a mouse model to explore the repairing role of WFY in DEHP-induced SDF. Network pharmacology combined with transcriptomics and proteomics was used to investigate how WFY could repair sperm DNA damage caused by DEHP.
Materials and methods
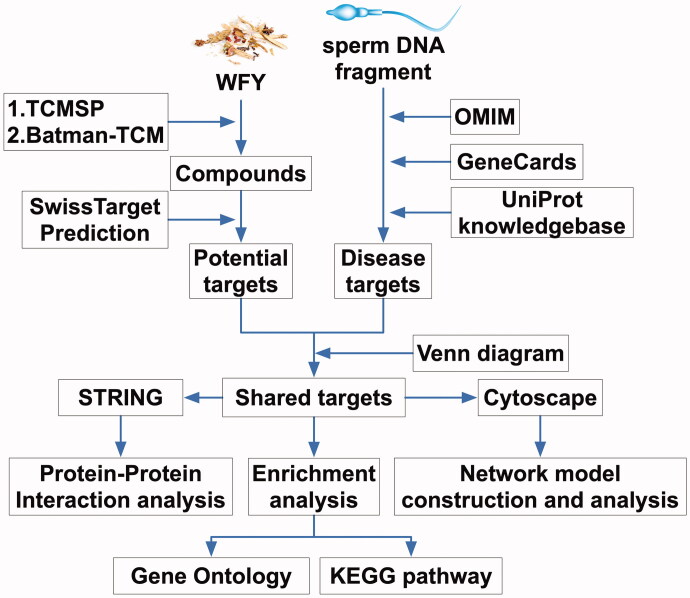
Network pharmacology analysis (completed in February 2021, details in Figure 1)
Figure 1.
Flowcharts for network pharmacology analysis.
Screening of active components of WFY
WFY consists of five Chinese medicinal materials (Table 1). The information regarding the five herbs from WFY was obtained from the traditional Chinese medicine systems pharmacology (TCMSP, http://tcmspw.com/tcmsp.php) and the bioinformatics analysis tool for the molecular mechanism of traditional Chinese medicine (BATMAN-TCM, http://bionet.ncpsb.org/batman-tcm/). These two data resources contain comprehensive data on all herbal components used for drug screening along with their evaluation. Oral bioavailability (OB) and drug similarity (DL) in TCMSP were selected to identify the bioactive components. The typical screening criteria were OB ≥30% and DL ≥0.18 (Song et al. 2018). The names of the compounds were standardized as per PubChem CIDs (https://pubchem.ncbi.nlm.nih.gov/) and then uploaded to SwissTargetPrediction (http://www.swisstargetprediction.ch/). The targets with a prediction score greater than 0 were selected as drug targets.
Table 1.
All herbal ingredients and dosages of WFY.
| Chinese name | Latin binomial | Authority | Family | Part of plant | Dosage |
|---|---|---|---|---|---|
| Huang-Qi | Astragalus membranaceus | Bunge, 1868 | Leguminosae | Root | 30 g |
| Gou-Qi-Zi | Lycium barbarum | Linnaeus, 1753 | Solanaceae | Fruit | 15 g |
| Chuan-Niu-Xi | Cyathula officinalis | K.C.Kuan, 1976 | Amaranthaceae | Root | 15 g |
| Bei-Wu-Wei-Zi | Schisandra chinensis | Baill., 1868 | Schisandraceae | Fruit | 15 g |
| Che-Qian-Zi | Plantago asiatica | Linnaeus, 1753 | Plantaginaceae | Seed | 12 g |
Potential targets associated with WFY and SDF
Using the keyword ‘sperm DNA fragment’, we screened the known SDF-related targets from OMIM (https://omim.org/) and GeneCards (https://www.genecards.org/). The target number was normalized according to the UniProt Knowledgebase, and then the duplicates were removed. The targets of WFY and SDF were input into the web-based map tool platform Venny 2.1 (https://bioinfogp.cnb.csic.es/tools/venny/), a Venn diagram was drawn, and the shared targets of WFY and SDF were obtained.
Network model construction and analysis
Cytoscape 3.7.2 software was adopted to create a ‘herb-component-disease-target’ interactive network plot, and the main active components of WFY were analysed by a network analyser (Zuo et al. 2018).
Protein–protein interaction (PPI) analysis
The shared WFY-SDF targets described above were entered into the STRING database (https://string-db.org/, version 11.0) for PPI assessment. The protein kind was set as ‘Homo sapiens’ with a minimum cross talk threshold of 0.4 to construct the PPI network, and the sequencing was conducted according to the degree of protein interaction.
Enrichment analysis
Pathway enrichment analysis was conducted using the Bioconductor package ‘org.Hs.eg.db’ in R software to transform the shared WFY-SDF targets to entrez ID. After installing the ‘clusterProfiler’ software package in R software, Gene Ontology (GO) and Kyoto Encyclopedia of Genes and Genomes (KEGG) analyses of the key target genes were carried out based on the transformed entrez ID. The threshold values were p < 0.05 along with Q < 0.05. The results were output in the form of histograms and bubble charts.
Ultrahigh-performance liquid chromatography Q-extractive mass spectrometry (UHPLC-QE-MS) analysis of WFY
Metabolite extraction
WFY solution (100 mg) was added to 50% 500 μL methanol (including 10 μg/mL internal standard). After 30 s of eddy current, the sample was ultrasonically oscillated in an ice bath for 1 h, oscillated at −40 °C for 1 h, and spanned at 12,000 rpm for 15 min at 4 °C. Finally, the supernatant was absorbed and placed into a fresh 2 mL tube for LC–MS/MS experiments.
LC–MS/MS conditions
LC–MS/MS assessment was done with the Agilent ULTRA-high-performance liquid chromatography 1290 UPLC platform and Waters UPLC BEH C18 (1.7 μm, 2.1 × 100 mm) column, with the rate of flow set at 0.4 mL/min and an injection volume of 5 μL. The mobile phase consisted of an aqueous solution (A) of 0.1% formic acid and a solution (B) of 0.1% formic acid acetonitrile. The multistep linear gradient elution procedure was 0–3.5 min, 95–85% A; 3.5–6 min, 85–70% A; 6–6.5 min, 70–70% A; 6.5–12 min, 70–30% A; 12–12.5 min, 30–30% A; 12.5–18 min, 30–0% A; 18–25 min, 0–0% A; 25–26 min, 0–95% A; 26–30 min, 95–95% A.
A Q Exactive Focus mass spectrometer and Xcalibur software were used to acquire MS and MS/MS data based on the IDA acquisition mode. In each collection cycle, the quality range was 100–1500, and the first 3 bits of each cycle were screened to obtain the respective MS/MS information. MS/MS resolution: 17,500, sheath gas flow: 45 Arb, capillary temperature: 400 °C, auxiliary gas flow: 15 Arb, full MS resolution: 70,000, collision energy in NCE mode: 15/30/45, spraying voltage: 4.0 kV (positive) or −3.6 kV (negative).
Experimental verification
Animals
A total of 30 male SPF ICR (CD1) mice (10 weeks old, body weight 30–40 g) were provided by Henan Skbex Biotechnology Co., Ltd. (Anyang, China; license no.: SCXK (YU) 2020-0005). The mice were numbered and then randomly grouped based on a random number table. All animal experiments and operations were approved by the Ethics Committee of Henan Province Hospital of Traditional Chinese Medicine. The animals were kept in the individually ventilated cage (IVC) system of the central laboratory of Henan Hospital of Traditional Chinese Medicine (license no.: SYXK (Henan) 2011-0002). In the IVC system, the temperature was maintained at 21–25 °C, with a humidity of 38–60%, ventilation of 22 times/h, and a 12 h light/dark cycle. The mice had free access to standard animal feed and filtered water. The adaptive period lasted for one week prior to the formal experiment.
Materials
The five herbal medicines in WFY were provided by the Pharmacy of Henan Province Hospital of Traditional Chinese Medicine and decocted into a mixture with a concentration of 3 g crude herbal medicine per mL. The mixture was stored at 4 °C until use.
Sperm DNA damage model induced by DEHP
Based on the literature (Zhao Y et al. 2020), intragastric administration of DEHP at 1 g/kg/d was given to the mice to replicate the DEHP-induced sperm DNA damage model. Both DEHP doses (500 and 1000 mg/kg, 28 d) used in the literature caused sperm DNA damage of mouse, and 1000 mg/kg was more obvious. After 30 d of administration, slight sperm DNA damage was observed, but there was no remarkable difference compared with the controls. Therefore, the modelling time was extended to 60 d, and a remarkably increased sperm DFI was found compared with the controls. The DEHP-induced sperm DNA damage mouse model was successfully replicated.
Experimental design
After the adaptation period, the mice were stratified at random into five groups (n = 6). The control group was given normal saline by gavage. The other four groups were the DEHP group (DEHP at 1 g/kg/d), WFYL group (DEHP at 1 g/kg/d + WFY at 8.92 g/kg), WFYM group (DEHP at 1 g/kg/d + WFY at 17.84 g/kg) and WFYH (DEHP at 1 g/kg/d + WFY at 35.67 g/kg). The WFY dose was calculated using the body surface area method (Nair and Jacob 2016). Calculation formula: mice: 17.835 g/kg = 12.3 × human: (WFY 87 g ÷ 60 kg). DEHP and WFY were given once daily for 60 d by gavage (equivalent to two cycles of spermatogenesis and maturation in mice). After the 60 d treatment, the mice were weighed and anaesthetized using sodium pentobarbital. The testis and epididymis were removed via laparotomy and then weighed. The tail of the epididymis was cut and dissected. The sperm was fully released after full shock in 1 mL normal saline for 1–3 min until the solution showed obvious turbidity. The sperm were stored at −80 °C before the detection of SDF. The left testis was fixed with Bouin’s solution for HE examination, and the right testis was frozen in liquid nitrogen and kept at −80 °C until the transcriptomic and proteomic tests.
Sperm chromatin structure assay
The sperm chromatin structure assay (SCSA) was conducted as documented previously with some modifications (Evenson 2016) at the Reproductive Laboratory of Henan Province Hospital of Traditional Chinese Medicine.
Briefly, the sperm suspension was thawed, transferred into 800 μL of cold TNE buffer, and passed through a 100 μm nylon strainer. The filtered sperm suspension was diluted with the same buffer to a sperm concentration of 2–3 × 10⁶/mL. The sperm suspension (100 μL) was introduced into a FACS tube containing acid detergent solution (200 μL). Then, the spermatozoa were stained with acridine orange (600 μL). Each sample was analysed and gated out by flow cytometry (BD Accuri™ C5) for 5000 sperm. The ratio of single-stranded (red) to double-stranded (green) fluorescence (% DFI) was computed with BD Accuri™ C6 plus software (BD, San Jose, CA).
Transcriptomic analysis
RNA extraction, library preparation and sequencing
After 60 d of intervention, nine mice were randomly selected from the control, DEHP and WFYH groups (three from each group) for transcriptomic analysis. According to the kit instructions, total RNA was isolated with the TRIzol reagent (Invitrogen, Carlsbad, CA). The quality of the isolated RNA was examined using an Agilent 2100 Bioanalyzer Platform (Agilent Technologies, Inc., Santa Clara, CA), and no RNase agarose gel electrophoresis was used for confirmation. The eukaryotic mRNA was aggregated with Oligo (dT) spheres, and the aggregated prokaryotic mRNA was eliminated with the Ribo-Zero™ magnetic kit (Epicenter, Moraga, CA). The aggregated mRNA fractions were split into short fractions by scrap buffer and were then converted into cDNA using arbitrary primers. Generation of the cDNA was performed using DNA polymerase I, RNase H and dNTPs along with the buffer. The cDNA was purified using the QIAQuick PCR isolation kit (Qiagen, Venlo, Netherlands), the ends were repaired, the base was introduced, and ligation of the cDNA was performed with the Illumina sequencing appendage. The linked products were sequenced by an Illumina Novaseq 6000.
Analysis of differentially expressed genes (DEGs) and trend analysis
Differential expression analysis of genes between groups was performed using DESeq2 (Love et al. 2014) software (two samples were analysed with edgeR). Genes harbouring a false discovery rate (FDR) ≤0.05 along with an absolute fold change ≥2 were considered DEGs. Based on the screened DEGs, trend analysis was used to screen for putative genes where WFY played a role. The expression information of each sample was normalized to 0, log2 (v1/v0) and log2 (v2/v0), and then the three groups were stratified using short time-series expression miner (STEM) software to obtain eight profiles with different trends of change, and clustering patterns with p ≤ 0.05 were regarded as significant changes. Then, GO and KEGG pathway enrichment assessments were performed for the DEGs of profile 2 and profile 5 in the plots. GO terms or pathways with p ≤ 0.05 and Q-value ≤0.05 signified remarkably abundant GO terms or cascades by FDR-corrected hypothesis testing.
Proteomic analysis
DIA proteome analysis
Samples were placed in lysis buffer (2% SDS, 1 mg/mL protease inhibitor, 7 M urea cocktail) to purify the total protein. Quantitation of the proteins was performed with a BCA protein assay kit. Afterward, protein digestion was performed with serial grade modified trypsin (Promega, WI) at a 50:1 (w/w) substrate/enzyme ratio for 16 h at 37 °C. The resulting peptide mixture was redissolved in aqueous ammonium formate (20 mM, pH 10.0), and a reversed-phase XBridge C18 column (4.6 mm × 250 mm, 5 μm) (Waters Corporation, Milford, MA) was used for high pH separation. The peptides were subsequently redissolved in 30 μL of 0.1% formic acid water and assessed via online-nano spray LC–MS/MS on an Orbitrap Fusion Lumos with an EASY-nLC 1200 platform (Thermo Fisher Scientific, Waltham, MA). The raw data obtained were processed and analysed on the Spectronaut X platform (Biognosys AG, Schlieren, Switzerland) using default parameters to obtain the protein expression of the samples.
Analysis of differentially expressed proteins (DEPs) and trend analysis
As described in section ‘Transcriptomic analysis’, trend analysis was carried out on the DEPs among the three groups, and the obtained profiles 2 and 5 were analysed for GO and KEGG pathways.
Proteomic and transcriptomic analysis of correlation
KEGG pathway analysis of association
The gene/protein and differential gene/differential proteins detected in the transcriptomic and proteomic analyses were counted separately. Correlation analysis of the KEGG pathway information in the transcriptome and proteome was performed to compare the two groups of metabolic pathways.
Nine-quadrant map analysis
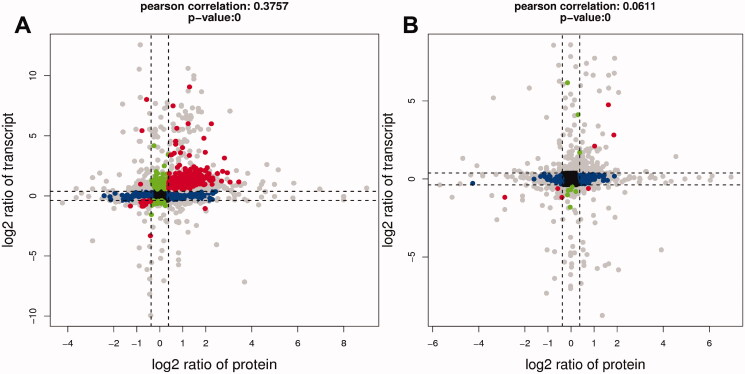
To screen out genes and proteins with the same expression trends, we used R (v3.5.1) software to draw nine-quadrant maps based on the changes in gene expression in the transcriptome and the proteome. Quantitative and enrichment assessments were performed for genes in each region of the nine-quadrant map. Among them, the third and seventh quadrants, where genes and proteins showed the same expression trend, were focussed.
qRT-PCR and Western blot validation
To verify the RNA-seq data, qRT-PCR analysis was adopted using the RNA preparations as documented above. Generation of cDNA was performed using 2× NovoScript®Plus1st Strand cDNA Synthesis SuperMix for qPCR (NovoProtein, Shanghai, China), and cDNA synthesis was performed on a LightCycler 480 Real-Time PCR platform (Roche, Basel, Switzerland) using 2× NovoStart® SYBR High-Sensitivity qPCR SuperMix (NovoProtein, Shanghai, China) for qPCR. The sequences of all primers are listed in Table 2. Experimental replicates were performed using three independent cDNA preparations for the reactions. The efficiency of the qPCR primers used was verified by thermal gradient and gel electrophoresis. The 2–▵▵Ct approach was adopted to determine the relative expression.
Table 2.
Primer sequences.
| Gene | Primer sequence |
|---|---|
| mouse -Aass-F | CTGTCCGTGATGCTGGCTAT |
| mouse -Aass-R | GTGGGGCTCCACATACTCAC |
| mouse -Aldh1a7-F | CTCCTCCCACATGGACATCG |
| mouse -Aldh1a7-R | TGGACGCTGCAACACAAATC |
| mouse -Gsta3-F | GGGCTGATATTGCCCTGGTT |
| mouse -Gsta3-R | TGGCTGCCAGGTTGAAGAAA |
| mouse -Bhmt-F | CCTCAGAGCTGGATCGAACG |
| mouse -Bhmt-R | GTATGAAGGCGTCTGGCTCA |
| mouse -Mug2-F | ATCACCCATGCCTTCACCTG |
| mouse -Mug2-R | ACAACAGGATGCTTTATGTCATTGT |
| mouse -Svs1-F | AATGGCATGATGGAGGGCAA |
| mouse -Svs1-R | CAGGTCAATGCGGTAATGCG |
Western blotting was performed based on the above DIA proteomics results. Homogenization of testicular tissue was performed with RIPA buffer supplemented with protease inhibitors, and protein quantitation was performed using the BCA approach. Fractionation of proteins was performed on 7.5% SDS-PAGE and the proteins were then transferred to nitrocellulose membranes. After that, the membranes were blocked with 5% Tris-buffered saline (TBST)-skimmed milk at room temperature (RT) for 2 h and washed with TBST, which was followed by overnight inoculation with the corresponding primary antibody at 4 °C. Subsequent inoculation with HRP-linked secondary antibodies was performed for 1 h at RT. The protein bands were visualized using enhanced chemiluminescence reagents, and protein intensities were quantified with ImageJ software (Bethesda, MD). Data are presented as the mean ± standard deviation, and a two-tailed Student’s t-test was adopted for pairwise comparisons, with p < 0.05 signifying statistical significance.
Results
Network pharmacologic analysis
Bioactive components in WFY
In total, 93 bioactive constituents (22 from HQ, 45 from GQZ, five from CNX, 10 from BWWZ and 11 from CQZ) were identified from WFY. After eliminating the duplicates, 89 candidate constituents were selected for downstream analysis.
Potential targets of WFY and known SDF-related targets
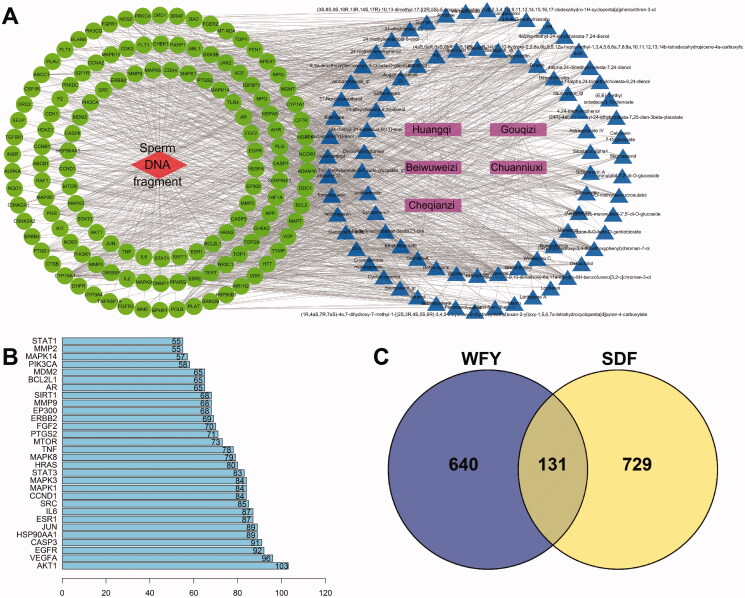
A total of 1780 matching promising targets of these 89 bioactive ingredients were assessed. After removal of duplicates, 771 promising targets remained. SDF-related genes along with protein targets were abstracted from OMIM and GeneCards. After removing the repeated samples, 860 SDF-related targets were collected. Among them, there were 131 shared targets between promising targets of WFY and known SDF-related targets (Figure 2(C)).
Figure 2.
(A) Network diagram of herb-component-target-SDF interactions. In the figure, pink represents drugs, blue represents 89 active components in WFY, green represents 131 common targets, and red represents disease. (B) Ranking of targets in the PPI chart (top 30). The abscissa indicates the number of protein interactions. (C) Venn diagram of WFY and the target of SDF.
Among the 89 biologically active components, eight active component targets with no intersection with SDF targets were deleted. The remaining 81 potential active components and 131 common herb-disease targets were input into Cytoscape software to map the ‘herb-component-target-disease’ crosstalk network (Figure 2(A)).
PPI analysis
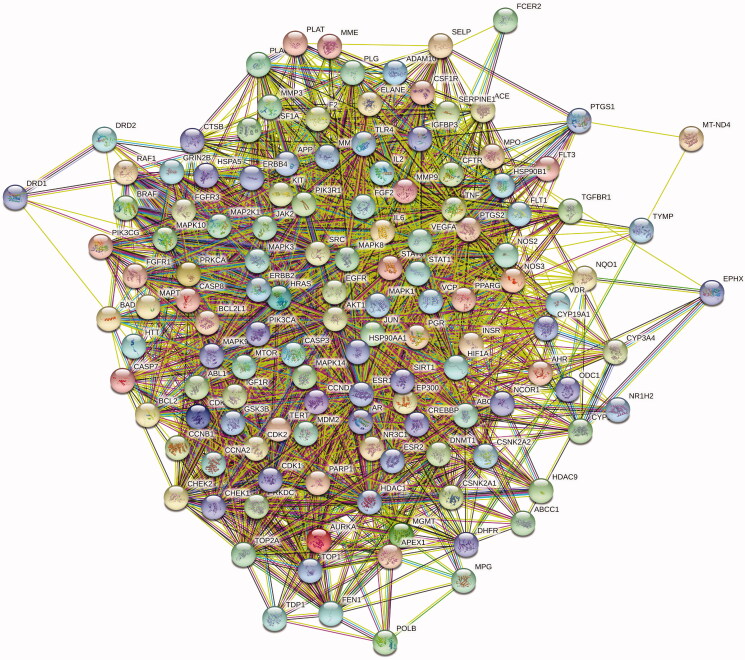
The above 131 shared targets were entered into STRING for PPI network analysis (Figure 3). Figure 2(B) shows the top 30 targets in the PPI diagram.
Figure 3.
Protein–protein interaction (PPI) network. The targets with more lines connected in the network showed stronger correlations.
GO and KEGG pathway analyses
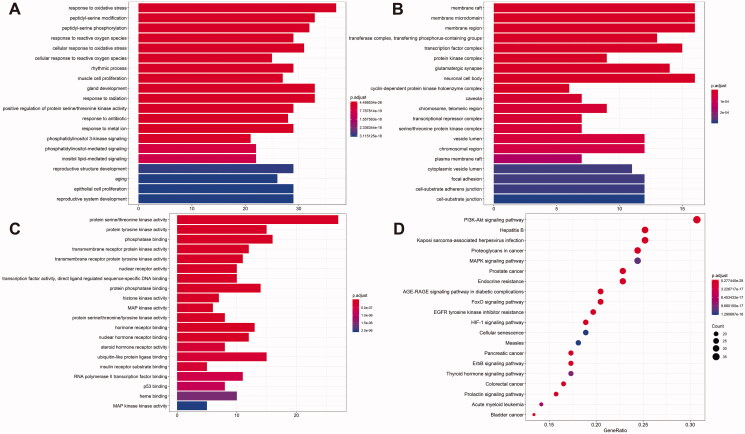
The 131 shared targets were run through the R language (R version 3.6.1) (R Foundation for Statistical Computing, Vienna, Austria), and then GO analysis was conducted to select the biological process (BP), cellular component (CC) and molecular function (MF) (Figure 4(A–C)). GO results showed that the shared gene sets were enriched in 2404 BP pathways, including response to oxidative stress (GO:0006979), peptidyl-serine modification (GO:0018209), gland development (GO:0048732), response to radiation (GO:0009314) and peptidyl-serine phosphorylation (GO:0018105). The shared gene sets were enriched in 84 CCs, including membrane raft (GO:0045121), membrane microdomain (GO:0098857), membrane region (GO:0098589), neuronal cell body (GO:0043025) and transcription factor complex (GO:0005667). The shared gene sets were enriched in 153 MFs, including protein serine/threonine kinase activity (GO:0004674), phosphatase binding (GO:0019902), protein tyrosine kinase activity (GO:0004713), ubiquitin-like protein ligase docking (GO:0044389) and endopeptidase activity (GO:0004175).
Figure 4.
The results of Gene Ontology (GO) functional analyses and KEGG pathway analysis. (A) Biological process; (B) cellular components; (C) molecular functions. (D) The top 20 enriched pathways. Vertical axis: pathway name; horizontal axis: gene ratio, the proportion of the number of rich genes in the total number of genes. The p value represents the importance of abundance, and the more intense the colour is, the greater the significance. The size of the dot indicates the number of enriched genes. The more the genes there are, the larger the dot is.
Overall, 161 KEGG cascades were determined, and a KEGG functional enrichment bar chart of the first 20 outcomes was generated (Figure 4(D)). The data showed that the shared targets were mainly enriched in Kaposi sarcoma-linked herpesvirus infection, PI3K-Akt signalling cascade, hepatitis B, cascades of neurodegeneration-multiple diseases, and proteoglycans in cancer.
UHPLC-QE-MS analysis
The raw mass spectra were uploaded to XCMS. The retention time correction, peak integration, peak alignment, peak recognition and peak extraction were collected, and the peaks harbouring the MS/MS data were determined by using the self-built two-stage mass spectrometry data resource and the respective cracking law matching approach. Finally, citric acid, malic acid, formononetin, acacetin, sissotrin, dl-valine, 5-hydroxymethylfurfural, proline, dl-isoleucine and β-adenosine were identified. The chromatograms and chemical structures of the major constituents of WFY are shown in Supplementary figure.
Experimental verification
WFY repairs DEHP-induced sperm DNA damage in mice
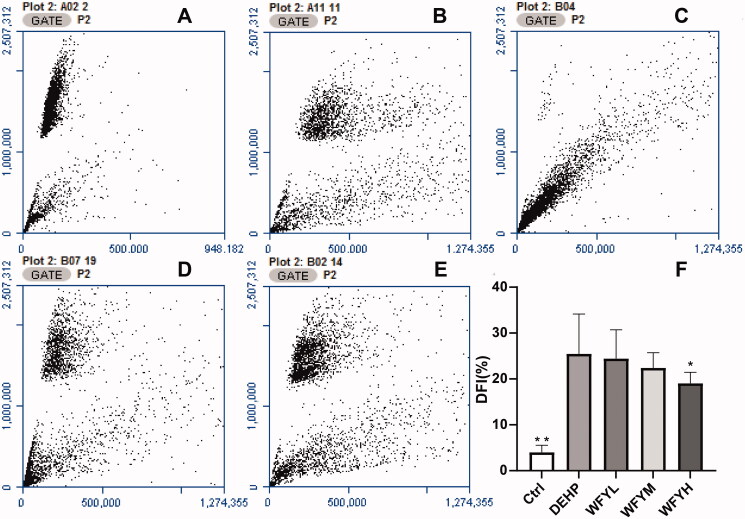
The sperm DFI of DEHP-exposed mice was remarkably higher than that of control mice (25.48% vs. 4.02%, p = 0.000; Figure 5). Compared with the DEHP group, the DFI of the WFYL and WFYM groups showed a slight decrease (24.45% and 22.4%, respectively), but with no remarkable difference. The DFI of the WFYH group decreased to 19.05%, which was remarkably lower than that of the DEHP group (p = 0.034). According to the DFI results, three mice were selected at random from the control group, DEHP group and WFYH group for transcriptomic and proteomic analysis.
Figure 5.
Sperm chromatin structure assay of sperm cells collected from the cauda epididymis (cauda sperm) in mice after exposure to DEHP. (A–E) Flow cytometry results of DFI (A: control; B: DEHP; C: WFYL; D: WFYM; E: WFYH). (F) Histogram of the flow cytometry results. Data are presented as the mean ± SE. By one-way ANOVA, asterisks showed significant differences between the DEHP group and the other two groups (**p < 0.01, *p < 0.05).
Transcriptomic trend analysis of DEGs
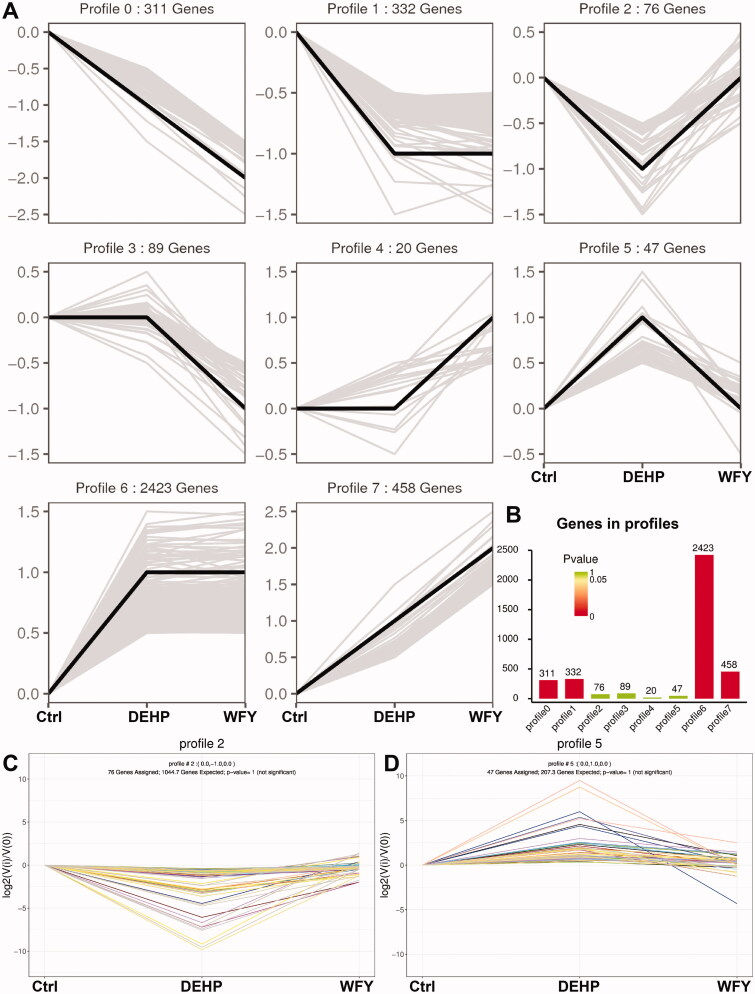
First, the total mRNA expression of the three groups was compared in pairs, and 3756 DEGs were obtained. We conducted a trend analysis on these DEGs. According to the different trends of DEGs among the three groups, the DEGs were divided into eight trend types, profile 0 to profile 7 (Figure 6(A)). Among them, profile 2 and profile 5 were the focus. In profile 2, 76 DEGs exhibited downregulated expression after DEHP exposure, which was reversed after WFY intervention (p > 0.05, Figure 6(B,C)). In profile 5, 47 DEGs exhibited upregulated expression after DEHP exposure, which was restored after WFY intervention (p > 0.05, Figure 6(B,D)).
Figure 6.
Trend Analysis of DEGs. (A) Trend pattern diagram showing the trend normalization of the gene data. The black line represents the trend line, and the grey line represents each gene. (B) Histogram of trend gene number and p value. The height of the column represents the number of genes, and the colour of the column represents the p value. (C, D) Trend charts for profiles 2 and 5. Each line in the figure represents a gene. The abscissa is the number of samples, and the ordinate is log2(V(i)/V(0)). The log2 value of the ratio of the expression amount of the (i) sample to the expression amount of the first sample.
GO and KEGG analysis for profiles 2 and 5 of the transcriptomic trends
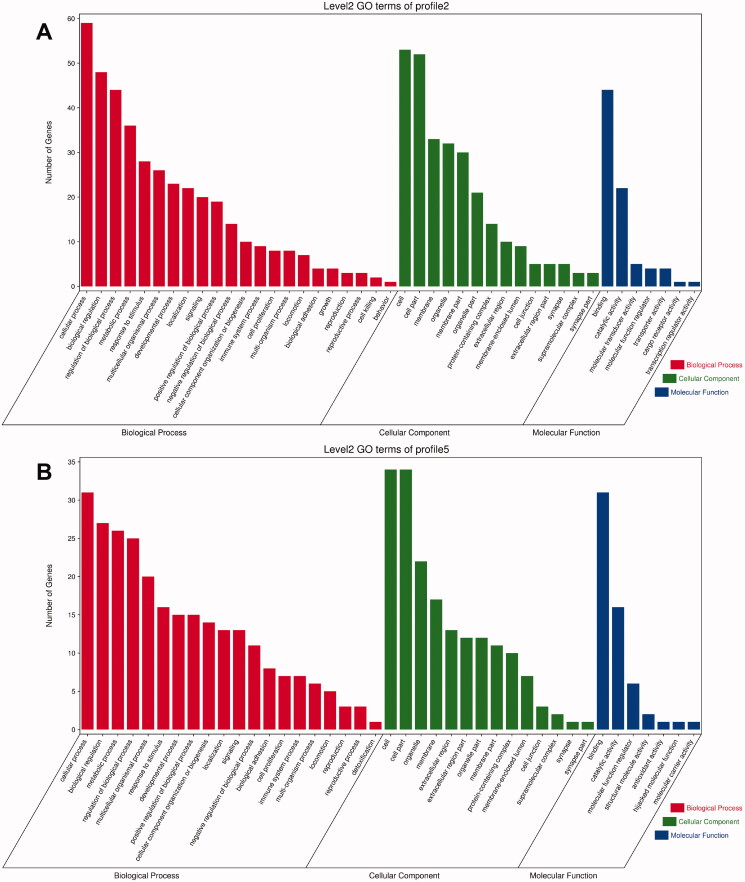
Profiles 2 and 5 showed a high similarity among the three categories in GO analysis. In the BP category, the top six GO terms with the largest number of genes in both profiles were cellular process (GO:0009987), modulation of BP (GO:0050789), biological modulation (GO:0065007), metabolic process (GO:0008152), multicellular organismal process (GO:0032501) and response to stimulus (GO:0050896). In the category of CC, the top four GO terms with the largest number of genes of both were cell (GO:0005623), cell part (GO:0044464), organelle (GO:0043226) and membrane (GO:0016020). In the category of MF, the top two GO terms with the largest number of genes were binding (GO:0005488) and catalytic activity (GO:0003824) (Figure 7).
Figure 7.
Histogram of GO enrichment and classification of DEGs: the abscissa is the second-level GO term, the ordinate is the number of genes in the term, and different colours represent different types of GO terms. (A) Profile 2; (B) profile 5.
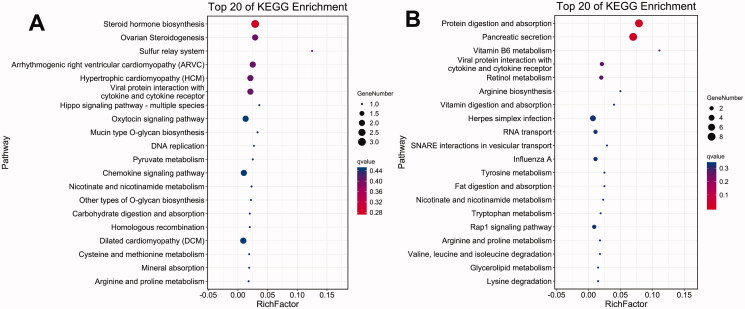
KEGG pathway analysis was performed to examine profiles 2 and 5. In profile 2, the top five pathways with the lowest Q-value and p value were steroid hormone biosynthesis (ko00140), ovarian steroidogenesis (ko04913), sulphur relay system (ko04122), arrhythmogenic right ventricular cardiomyopathy (ARVC) (ko05412) and hypertrophic cardiomyopathy (HCM) (ko05410). In profile 5, the top five pathways with the lowest Q-value and p value were protein digestion and absorption (ko04974), pancreatic secretion (ko04972), vitamin B6 metabolism (ko00750), viral protein crosstalk with cytokine and cytokine receptors (ko04061), and retinol metabolism (ko00830) (Figure 8).
Figure 8.
KEGG enrichment bubble diagram of DEGs: the top 20 pathways with the lowest Q-value and p value are plotted, the vertical axis is the pathway, and the abaxial axis is the enrichment factor (divided by all the number of different genes in the pathway); size represents the number, and the redder the colour is, the lower the Q value is. (A) Profile 2; (B) profile 5.
Proteomic trend analysis of DEPs
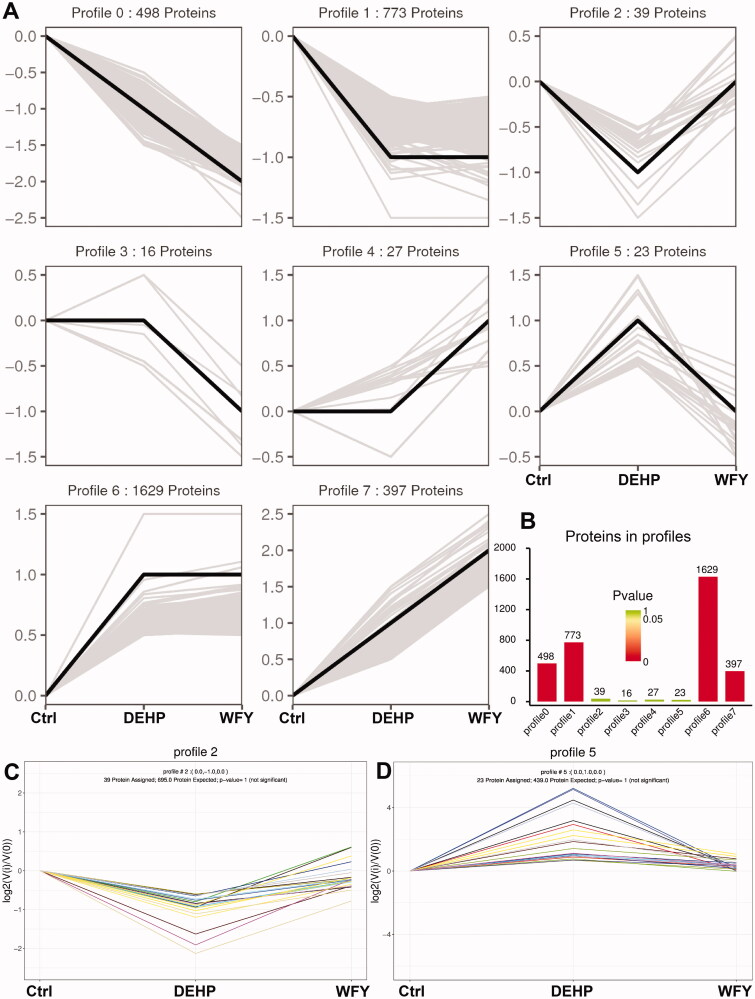
We conducted a trend analysis of 3402 DEPs from the three groups (Figure 9). Similar to the criteria above, 3401 DEPs meeting the criteria were included for trend analysis. The DEPs were divided into eight trend types, profile 0 to profile 7 (Figure 9(A)). Among them, profiles 2 and 5 were the focus. In profile 2, 39 DEPs exhibited downregulated expression after DEHP exposure, which was reversed after WFY intervention (p > 0.05, Figure 9(B,C)). In profile 5, 23 DEPs exhibited upregulated expression after DEHP exposure, which was restored after WFY intervention (p > 0.05, Figure 9(B,D)).
Figure 9.
Trend analysis of DEPs. (A) Trend pattern diagram showing the trend normalization of the protein data. The black line represents the trend line, and the grey line represents each protein. (B) Histogram of trend protein number and p value. The height of the column represents the number of proteins, and the colour of the column represents the p value. (C, D) Trend charts for profiles 2 and 5. Each line in the figure represents a protein. The abscissa is the number of samples, and the ordinate is log2(V(i)/V(0)). The log2 value of the ratio of the expression amount of the (i) sample to the expression amount of the first sample.
GO and KEGG analysis for profiles 2 and 5 from proteomic trend analysis
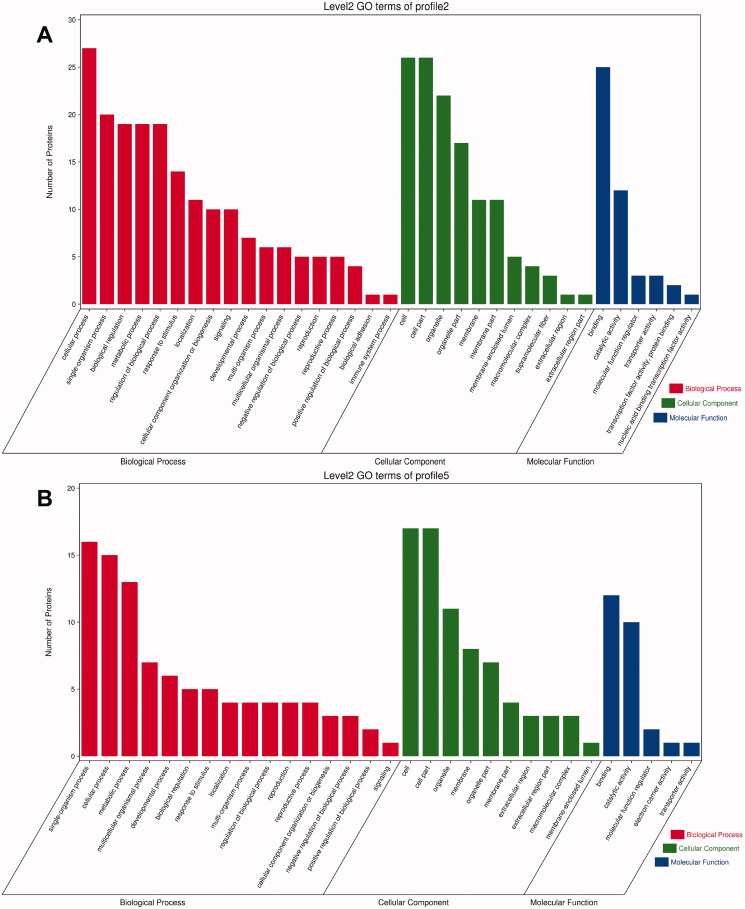
Profiles 2 and 5 showed high similarity among the three categories in GO analysis. In the category of BP, the top two GO terms with the largest number of genes from both profiles were cellular process (GO:0009987) and single-organism process (GO:0044699). In CC, the top six GO terms with the largest number of genes from both profiles were cell (GO:0005623), cell part (GO:0044464), organelle (GO:0043226), organelle part (GO:0044422), membrane part (GO:0044425) and membrane (GO:0016020). In MF, the top three GO terms with the largest number of genes from both profiles were binding (GO:0005488), catalytic activity (GO:0003824) and MF regulator (GO:0098772) (Figure 10).
Figure 10.
Histogram of GO enrichment and classification of DEPs: the abscissa is the second-level GO term, the ordinate is the number of proteins in the term, and different colours represent different types of GO terms. (A) Profile 2; (B) profile 5.
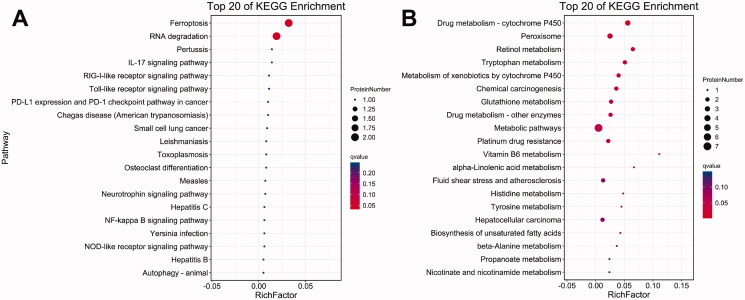
KEGG pathway analysis was performed to further examine profiles 2 and 5. In profile 2, the top two pathways with the lowest Q-value and p value were ferroptosis (ko04216) and RNA degradation (ko03018). In profile 5, the top five pathways with the highest Q-value were drug metabolism-cytochrome P450 (ko00982), peroxisome (ko04146), retinol metabolism (ko00830), tryptophan metabolism (ko00380) and metabolism of xenobiotics by cytochrome P450 (ko00980) (Figure 11).
Figure 11.
KEGG enrichment bubble diagram of DEPs: the top 20 pathways with the lowest Q-value are plotted, the vertical axis is the pathway, and the abaxial axis is enrichment factor (divided by the number of different proteins in the pathway); size represents the number, and the redder the colour is, the lower the Q-value is. (A) Profile 2; (B) profile 5.
Combined transcriptomic and proteomic analysis
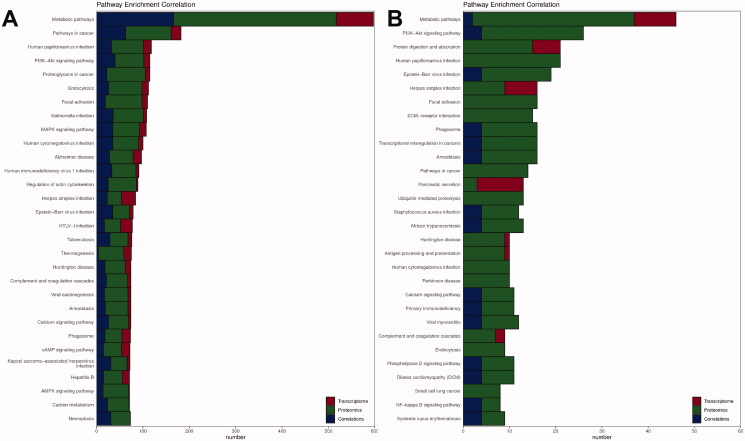
The combined transcriptomic and proteomic analysis showed that the DEGs and DEPs between the controls and the DEHP group were consistent in the metabolic pathways (ko01100), cascades in cancer (ko05200), PI3K-Akt signalling cascade (ko04151), herpes simplex infection (ko05168) and MAPK signalling cascade (ko04010) (Figure 12(A)). Compared with the DEHP group, metabolic pathways (ko01100), PI3K-Akt signalling pathway (ko04151), human papillomavirus infection (ko05165), Epstein-Barr virus infection (ko05169) and amoebiasis (ko05146) were coexpressed in transcriptomic and proteomic pathways in the WFY group (Figure 12(B)).
Figure 12.
Proteomic and transcriptomic association KEGG pathway analysis. The figure shows the number of notes on the pathway of differentially expressed mRNAs (red), proteins (green) and coassociated genes (blue). (A) Control group vs. DEHP group; (B) DEHP group vs. WFY group.
Nine quadrant diagram screening of WFY target genes and proteins
A comparison of the transcriptome and proteome between the control group and DEHP (Figure 13(A)), as well as a comparison between the DEHP group and the WFY group (Figure 13(B)) was made. In the nine-quadrant diagram, genes with mRNA differentially expressed patterns consistent with the corresponding protein were distributed in the third and seventh quadrants. The upregulated mRNAs and the corresponding proteins were distributed in the third quadrant, while the downregulated mRNAs and corresponding proteins were distributed in the seventh quadrant. By comparing the genes in the third quadrant (Figure 13(A)) with those in the seventh quadrant (Figure 13(B)), the mRNAs and proteins upregulated in the DEHP group and recovered in the WFY group (Aass, Aldh1a7, GSTA3, betaine homocysteine S-methyltransferase (Bhmt) and Svs1) were screened out. By comparing the genes in the seventh quadrant (Figure 13(A)) with those in the third quadrant (Figure 13(B)), the mRNA and proteins downregulated in the DEHP group and recovered in the WFY group (Mug2) were screened out.
Figure 13.
Nine quadrant diagrams. The horizontal axis is the multiple of protein difference (log2), the vertical axis is the multiple of transcriptome difference (log2), and the top of the graph is the correlation coefficient and p value of the association between transcriptome and proteome. Each dot represents a gene/protein, black dots represent nondifferentiated proteins and genes, red dots represent consistent or opposite trends, green dots represent differentially expressed genes but non-differentially expressed proteins, and blue dots represent differentially expressed genes but differentially expressed proteins (if the difference multiple is reached, but the p value is not, it is shown as a grey point).
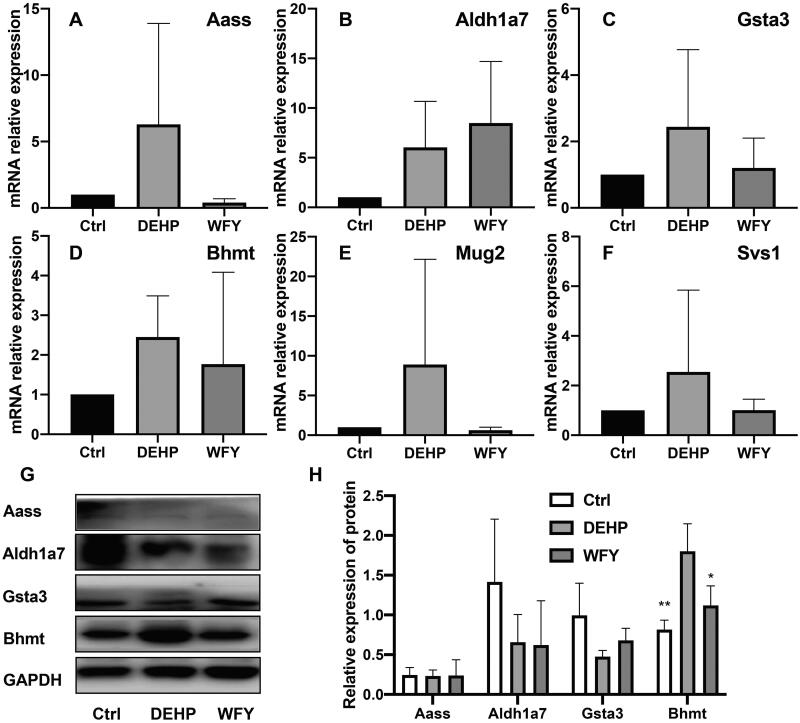
Validation of the expression of screened WFY target genes and proteins
The genes screened in the nine-quadrant analysis (Aass, Aldh1a7, GSTA3, Bhmt, Mug2 and Svs1) were verified by qRT-PCR and Western blot (Figure 14). Independent samples from three groups were assessed via qRT-PCR (n = 3 per group). At the level of transcriptional expression, the expression trends of Aass, Aldh1a7, GSTA3, Bhmt and Svs1 were similar to the RNA-seq results. The expression trend of Mug2 was opposite to that of RNA-seq, and there was no remarkable difference among the groups (p > 0.05). The same samples were also detected via Western blot. At the protein expression level, the expression trends of Bhmt were similar to the results of DIA. The expression of Bhmt in the DEHP group was remarkably upregulated compared with the controls (p = 0.004). The expression of Bhmt in the WFY group was remarkably upregulated compared with that in the DEHP group (p = 0.029). Due to the Svs1 and Mug2 antibody problem, their protein expression could not be confirmed.
Figure 14.
The expression levels of Aass, Aldh1a7, Gsta3, Bhmt, Mug2 and Svs1 were screened from nine quadrant diagrams by qRT-PCR and Western blot. (A–F) qRT-PCR. (G) Western blot. (H) OD value of Western blot. Mean ± SD, n = 3 in qRT-PCR and Western blot. Compared to the control group, *p < 0.05, **p < 0.01.
Discussion
Sperm DNA integrity plays a critical role in pregnancy. Compared with the traditional semen analysis method, DFI can evaluate male fertility in a more objective way. Increased SDF is detrimental to embryo development and pregnancy outcomes and may lead to pregnancy miscarriage, recurrent spontaneous abortions and low live birth rates (Wang et al. 2019). It has been shown that when DFI >27%, conception and pregnancy rates will be significantly lower and normal pregnancies will not be achieved (Ioannou et al. 2016). In couples who experienced unexplained recurrent miscarriages, the male partners had a higher DFI rate than normal couples (Eisenberg et al. 2017).
SDF can be caused by a variety of factors, such as disease, drugs, unhealthy lifestyle habits, environmental pollution, alcohol abuse, varicoceles, cancer treatment and some unknown causes. The mechanisms of SDF include abnormal spermatogenesis, oxidative stress damage and abnormal sperm apoptosis. Depending on the cause, the main treatment options are antioxidant therapy, causal targeted therapy and Chinese medicine (Qiu et al. 2020). For SDF caused by environmental factors and unknown causes, TCM has the advantages of multiple targets and low toxicity.
Chinese medicine has been reported to improve sperm vitality, density and morphology (Jiang et al. 2017; Zhou SH et al. 2019). However, few experimental studies have focussed on Chinese herbal formulas that can improve sperm DFI. The Shengjing capsule, which consists of 19 herbs, has been proven to repair chromium oxide-induced oxidative damage to the testes, protect sperm DNA and reduce DFI (Zhou S et al. 2016). Two of the 19 herbs, Astragalus membranaceus (Fisch.) Bunge (Leguminosae) and Lycium barbarum L. (Solanaceae) are also included in our WFY formula, suggesting that both improve sperm DFI. Our results revealed that WFY could reduce DEHP-induced sperm DFI in a dose-dependent manner.
DEHP exposure is associated with altered sex hormone levels, impaired sperm DNA integrity and sperm apoptosis (Wang YX et al. 2016). At present, few reports have evaluated DEHP-caused sperm DFI. Experimental studies have found that DFI in F1 male rats was significantly increased when pregnant rats were given DEHP at 5 and 500 mg/kg/d from day 0 of gestation to parturition, and the increase in DFI in 500 mg/kg/d group continued from F1 to F3 (Hsu et al. 2021).
Humans are also simultaneously and continuously affected by other pollutants. These pollutants can cause damage to various organs of the body (Baralić et al. 2020, 2021; Park et al. 2020). Other contaminants may increase/synergize/antagonize the toxic effects of DEHP when present in the mixture. Bisphenol A (BPA) and DEHP are two major EDCs that are added to plastics as plasticizers. In reproductive and endocrine systems, the co-exposure of BPA and DEHP was mainly antagonistic (Tassinari et al. 2021).
Our combined transcriptome and proteome analysis found that the repairing effect of WFY on DEHP-induced sperm DNA damage was related to the metabolic pathway and the PI3K/Akt pathway. The metabolic pathway involves many functional activities, and changes in the metabolic pathway have been found in many diseases. The PI3K/Akt pathway is correlated with oxidative damage and DNA integrity. Activation of the PI3K/Akt signalling pathway leads to a direct interaction between phosphorylated MDM2 and p53 degradation. P53 degradation causes p53-dependent DNA damage checkpoint or repair dysfunction and ultimately results in the accumulation of DNA damage in sperm (Xian et al. 2017). Although no other Chinese herbal formulas have been found to repair sperm DNA damage through the PI3K/Akt pathway, some Chinese herbal formulas were able to improve other sperm parameters (such as sperm concentration and motility) through the PI3K/Akt pathway, possibly by promoting spermatogenic cell proliferation and inhibiting apoptosis (Chen et al. 2021).
Another interesting finding is that the repair of DEHP-induced sperm DNA damage by WFY was associated with ferroptosis according to our proteomic trend analysis. Ferroptosis is a newly discovered form of cell death characterized by intracellular iron accumulation and the need for lipid peroxidation. Similar to DEHP, arsenite is a known reproductive pollutant widely distributed in the natural environment that can trigger oxidative stress, which can lead to ferroptosis resulting in testicular cell death (Meng et al. 2020). We speculated that WFY could also inhibit sperm apoptosis by inhibiting ferroptosis.
The six genes (Aass, Aldh1a7, GSTA3, Bhmt, Mug2 and Svs1) screened by the nine-quadrant map were considered potential targets of sperm DNA repair by WFY. Although some of them have been revealed to be related to the reproductive system, they have not been reported to be related to sperm DNA damage. Among them, Bhmt showed a significant difference after verification. Bhmt has been reported to be associated with certain fertility diseases. The Bhmt G742A SNP (single nucleotide polymorphism) is a genetic risk factor for idiopathic male infertility in the Romanian population (Popp et al. 2012). The abnormal expression of Bhmt was found after di-N-butyl phthalate (DBP) exposure in male rats, and Bhmt was closely related to global DNA methylation and follicle-statin like 3 (Fstl3) promoter methylation (Yuan et al. 2017). Fstl3 is a known regulator of spermatogenesis.
Glutathione S-transferase A3 (GSTA3) was recently identified as a major enzyme involved in the isomerization of androstenedione in human and livestock species, including goats, sheep, cattle, pigs and horses. Elevated GSTA3 expression was found during goat testis development (Faucette et al. 2014). Although the results of our transcriptomic, proteomic and qRT-PCR analyses were inconsistent with the previous literature, the Western blot results showed decreased GSTA3 after DEHP exposure, which was recovered after WFY intervention. This result is consistent with the literature. We speculate that the inconsistency may derive from our small sample size (n = 3). In future studies, the sample size can be increased to n = 5.
At present, there are few reports about Aldh1a7 and male reproduction. Some studies found that Aldh1a7 was differentially expressed in the ovaries of a polycystic ovary syndrome (PCOS) mouse model (Lei et al. 2017). Aldh1a7 appears to be closely involved in follicular development in the ovary. The expression of Aldh1a7 was significantly increased in mouse ovaries treated with chorionic gonadotropin/FSH (Kawai et al. 2016). Our Western blot analysis showed that Aldh1a7 decreased after DEHP exposure, and Aldh1a7 increased slightly after WFY intervention.
Our results showed that the expression trend of Mug2 was opposite to RNA-seq. We considered the possible reasons as follows: (1) the gene expression level verified by qRT-PCR was low and the difference was not significant; (2) there are differences between the two methods, and it is normal for them to be inconsistent. Five of the six mRNAs we verified were consistent with RNA-seq, with an agreement rate of 83.3%, which was similar to other studies. 50/58 (86.2%) qRT-PCR results were consistent with RNA-seq results (Zhang et al. 2015).
Svs1 has been poorly studied. The SVS1 protein has been found to contribute to the formation of mating plugs and the survival of sperm in the female reproductive tract (Mangels et al. 2015). Svs1-7 regulates the fertility of mammals by inhibiting capacitation and incapacitating capacitated sperm in seminal vesicle secretions (Araki et al. 2016). We hypothesized that DEHP weakens mouse sperm function by upregulating Svs1 expression; WFY intervention decreases Svs1 expression, and the sperm function is thus recovered.
Conclusions
Through network pharmacology, this study predicted that the mechanism by which WFY repairs sperm DNA damage might be related to the PI3K/Akt pathway. WFY, especially high-dose WFY, repaired the DNA damage of mouse sperm caused by DEHP exposure. Transcriptomic and proteomic analyses showed that the repair mechanism was related to the PI3K/Akt and metabolic pathways. Six target genes (Aass, Aldh1a7, GSTA3, Bhmt, Mug2 and Svs1) of WFY were screened and verified. These results suggest that WFY can effectively repair DEHP-induced sperm DNA damage, and the specific mechanism may be related to PI3K/Akt, metabolic pathways and Bhmt. We have innovatively used TCM to repair sperm DNA damage caused by environmental pollutants. It also provides new ideas for future researchers.
Supplementary Material
Funding Statement
This work was supported by the National Natural Science Foundation of China [82174377, 81974573 and 81603632]; and Natural Science Foundation of Henan Province [222300420485]; and the Science and Technology Program of Henan Province in 2019 [192102310159]; and the Special Scientific Research Project of National TCM Clinical Research Base [2021JDZX2056 and 2021JDZX2068]; and Innovative Training program for College students in Henan Province [2022104711022 and 2022104711057].
Disclosure statement
The authors report there are no competing interests to declare.
References
- Araki N, Kawano N, Kang W, Miyado K, Yoshida K, Yoshida M.. 2016. Seminal vesicle proteins SVS3 and SVS4 facilitate SVS2 effect on sperm capacitation. Reproduction. 152(4):313–321. [DOI] [PubMed] [Google Scholar]
- Axelsson J, Rylander L, Rignell-Hydbom A, Jonsson BAG, Lindh CH, Giwercman A.. 2015. Phthalate exposure and reproductive parameters in young men from the general Swedish population. Environ Int. 85:54–60. [DOI] [PubMed] [Google Scholar]
- Baralić K, Bozic D, Živančević K, Milenković M, Javorac D, Marić Đ, Antonijević Miljaković E, Buha Djordjevic A, Vukomanović P, Ćurčić M, et al. 2021. Integrating in silico with in vivo approach to investigate phthalate and bisphenol A mixture-linked asthma development: positive probiotic intervention. Food Chem Toxicol. 158:112671. [DOI] [PubMed] [Google Scholar]
- Baralić K, Živančević K, Javorac D, Buha Djordjevic A, Anđelković M, Jorgovanović D, Antonijević Miljaković E, Ćurčić M, Bulat Z, Antonijević B, et al. 2020. Multi-strain probiotic ameliorated toxic effects of phthalates and bisphenol A mixture in Wistar rats. Food Chem Toxicol. 143:111540. [DOI] [PubMed] [Google Scholar]
- Bungum M. 2017. Sperm DNA integrity testing-a valuable clinical tool. Transl Androl Urol. 6(Suppl. 4):S329–S330. [DOI] [PMC free article] [PubMed] [Google Scholar]
- Chen WQ, Wang B, Ding CF, Wan LY, Hu HM, Lv BD, Ma JX.. 2021. In vivo and in vitro protective effects of the Wuzi Yanzong pill against experimental spermatogenesis disorder by promoting germ cell proliferation and suppressing apoptosis. J Ethnopharmacol. 280:114443. [DOI] [PubMed] [Google Scholar]
- Dostalova P, Zatecka E, Ded L, Elzeinova F, Valaskova E, Kubatova A, Korenkova V, Langerova L, Komrskova K, Peknicova J.. 2020. Gestational and pubertal exposure to low dose of di-(2-ethylhexyl) phthalate impairs sperm quality in adult mice. Reprod Toxicol. 96:175–184. [DOI] [PubMed] [Google Scholar]
- Eisenberg ML, Sapra KJ, Kim SD, Chen Z, Louis GMB.. 2017. Semen quality and pregnancy loss in a contemporary cohort of couples recruited before conception: data from the Longitudinal Investigation of Fertility and the Environment (LIFE) study. Fertil Steril. 108(4):613–619. [DOI] [PMC free article] [PubMed] [Google Scholar]
- Evenson DP. 2016. The Sperm Chromatin Structure Assay (SCSA®) and other sperm DNA fragmentation tests for evaluation of sperm nuclear DNA integrity as related to fertility. Anim Reprod Sci. 169:56–75. [DOI] [PubMed] [Google Scholar]
- Faucette AN, Maher VA, Gutierrez MA, Jucker JM, Yates DC, Welsh TH, Amstalden M, Newton GR, Nuti LC, Forrest DW, et al. 2014. Temporal changes in histomorphology and gene expression in goat testes during postnatal development. J Anim Sci. 92(10):4440–4448. [DOI] [PubMed] [Google Scholar]
- Hsu PC, Jhong JY, Huang LP, Lee KH, Chen HP, Guo YL.. 2021. Transgenerational effects of di(2-ethylhexyl) phthalate on anogenital distance, sperm functions and DNA methylation in rat offspring. Int J Mol Sci. 22(8):4131. [DOI] [PMC free article] [PubMed] [Google Scholar]
- Inhorn MC, Patrizio P.. 2015. Infertility around the globe: new thinking on gender, reproductive technologies and global movements in the 21st century. Hum Reprod Update. 21(4):411–426. [DOI] [PubMed] [Google Scholar]
- Ioannou D, Miller D, Griffin DK, Tempest HG.. 2016. Impact of sperm DNA chromatin in the clinic. J Assist Reprod Genet. 33(2):157–166. [DOI] [PMC free article] [PubMed] [Google Scholar]
- Jiang D, Coscione A, Li L, Zeng B-Y.. 2017. Effect of Chinese herbal medicine on male infertility. Int Rev Neurobiol. 135:297–311. [DOI] [PubMed] [Google Scholar]
- Kawai T, Yanaka N, Richards JS, Shimada M.. 2016. De novo-synthesized retinoic acid in ovarian antral follicles enhances FSH-mediated ovarian follicular cell differentiation and female fertility. Endocrinology. 157(5):2160–2172. [DOI] [PMC free article] [PubMed] [Google Scholar]
- Lei L, Ding LJ, Su J, Liu MY, Shi QQ, Zhou JJ, Sun HX, Yan GJ.. 2017. Attenuated expression of MTR in both prenatally androgenized mice and women with the hyperandrogenic phenotype of PCOS. PLoS One. 12(12):e0187427. [DOI] [PMC free article] [PubMed] [Google Scholar]
- Love MI, Huber W, Anders S.. 2014. Moderated estimation of fold change and dispersion for RNA-seq data with DESeq2. Genome Biol. 15(12):550. [DOI] [PMC free article] [PubMed] [Google Scholar]
- Mangels R, Young B, Keeble S, Ardekani R, Meslin C, Ferreira Z, Clark NL, Good JM, Dean MD.. 2015. Genetic and phenotypic influences on copulatory plug survival in mice. Heredity. 115(6):496–502. [DOI] [PMC free article] [PubMed] [Google Scholar]
- Meng P, Zhang SS, Jiang XJ, Cheng SQ, Zhang J, Cao XQ, Qin X, Zou Z, Chen CZ.. 2020. Arsenite induces testicular oxidative stress in vivo and in vitro leading to ferroptosis. Ecotoxicol Environ Saf. 194:110360. [DOI] [PubMed] [Google Scholar]
- Molina LCP, Gunderson S, Riley J, Lybaert P, Borrego-Alvarez A, Jungheim ES, Santi CM.. 2019. Membrane potential determined by flow cytometry predicts fertilizing ability of human sperm. Front Cell Dev Biol. 7:387. [DOI] [PMC free article] [PubMed] [Google Scholar]
- Nair AB, Jacob S.. 2016. A simple practice guide for dose conversion between animals and human. J Basic Clin Pharm. 7(2):27–31. [DOI] [PMC free article] [PubMed] [Google Scholar]
- Park C, Song H, Choi J, Sim S, Kojima H, Park J, Iida M, Lee Y.. 2020. The mixture effects of bisphenol derivatives on estrogen receptor and androgen receptor. Environ Pollut. 260:114036. [DOI] [PubMed] [Google Scholar]
- Popp RA, Farcaş MF, Trifa AP, Crişan TO, Militaru MS, Pop IV.. 2012. Association of betaine-homocysteine S-methyltransferase gene G742A SNP and male infertility. Rev Rom Med Labor. 20(1/4):57–62. [Google Scholar]
- Qiu Y, Yang H, Li CY, Xu CL.. 2020. Progress in research on sperm DNA fragmentation. Med Sci Monit. 26:e918746. [DOI] [PMC free article] [PubMed] [Google Scholar]
- Song WJ, Ni SL, Fu YL, Wang Y.. 2018. Uncovering the mechanism of Maxing Ganshi decoction on asthma from a systematic perspective: a network pharmacology study. Sci Rep. 8(1):17362. [DOI] [PMC free article] [PubMed] [Google Scholar]
- Szewczyńska M, Pośniak M, Dobrzyńska E.. 2020. Determination of phthalates in particulate matter and gaseous phase emitted into the air of the working environment. Int J Environ Sci Technol. 17(1):175–186. [Google Scholar]
- Tassinari R, Tait S, Busani L, Martinelli A, Valeri M, Gastaldelli A, Deodati A, La Rocca C, Maranghi F, Grp LPP, et al. 2021. Toxicological assessment of oral co-exposure to bisphenol A (BPA) and bis(2-ethylhexyl) phthalate (DEHP) in juvenile rats at environmentally relevant dose levels: evaluation of the synergic, additive or antagonistic effects. Int J Environ Res Public Health. 18(9):4584. [DOI] [PMC free article] [PubMed] [Google Scholar]
- Wang YX, Zeng Q, Sun Y, You L, Wang P, Li M, Yang P, Li J, Huang Z, Wang C, et al. 2016. Phthalate exposure in association with serum hormone levels, sperm DNA damage and spermatozoa apoptosis: a cross-sectional study in China. Environ Res. 150:557–565. [DOI] [PubMed] [Google Scholar]
- Wang YY, Lai TH, Chen MF, Lee HL, Kuo PL, Lin YH.. 2019. SEPT14 mutations and teratozoospermia: genetic effects on sperm head morphology and DNA integrity. J Clin Med. 8(9):1297. [DOI] [PMC free article] [PubMed] [Google Scholar]
- [WHO ] World Health Organization. 1980. WHO laboratory manual for the examination of human semen and semen-cervical mucus interaction. 1st ed. Singapore: Press Concern. [Google Scholar]
- [WHO ] World Health Organization. 1992. Diethylhexyl phthalate. WHO Press. [Google Scholar]
- [WHO ] World Health Organization. 2010. WHO laboratory manual for the examination and processing of human semen. 5th ed. Geneva: WHO Press. [Google Scholar]
- Xian H, Wang F, Teng W, Yang D, Zhang M.. 2017. Thyroid hormone induce a p53-dependent DNA damage through PI3K/Akt activation in sperm. Gene. 615:1–7. [DOI] [PubMed] [Google Scholar]
- Yuan BL, Wu W, Chen MJ, Gu H, Tang QQ, Guo D, Chen T, Chen YQ, Lu CC, Song L, et al. 2017. From the cover: metabolomics reveals a role of betaine in prenatal DBP exposure-induced epigenetic transgenerational failure of spermatogenesis in rats. Toxicol Sci. 158(2):356–366. [DOI] [PubMed] [Google Scholar]
- Zhang W, Chen JH, Keyhani NO, Zhang ZY, Li S, Xia YX.. 2015. Comparative transcriptomic analysis of immune responses of the migratory locust, Locusta migratoria, to challenge by the fungal insect pathogen, Metarhizium acridum. BMC Genomics. 16:867. [DOI] [PMC free article] [PubMed] [Google Scholar]
- Zhao MP, Shi X, Kong GWS, Wang CC, Wu JCY, Lin ZX, Li TC, Chan DYL.. 2018. The therapeutic effects of a traditional Chinese medicine formula Wuzi Yanzong Pill for the treatment of oligoasthenozoospermia: a meta-analysis of randomized controlled trials. Evid Based Complement Alternat Med. 2018:1–10. [DOI] [PMC free article] [PubMed] [Google Scholar]
- Zhao Y, Lin J, Talukder M, Zhu SY, Li MZ, Wang HR, Li JL.. 2020. Aryl hydrocarbon receptor as a target for lycopene preventing DEHP-induced spermatogenic disorders. J Agric Food Chem. 68(15):4355–4366. [DOI] [PubMed] [Google Scholar]
- Zhou S, Wen Z, Liang A, Zhang S.. 2016. Experimental research on therapeutic efficacy of traditional Chinese medicine Shengjing capsule extracts in treating spermatogenesis impairment induced by oxidative stress. Med Sci Monit. 22:50–56. [DOI] [PMC free article] [PubMed] [Google Scholar]
- Zhou SH, Deng YF, Weng ZW, Weng HW, Liu ZD.. 2019. Traditional Chinese medicine as a remedy for male infertility: a review. World J Mens Health. 37(2):175–185. [DOI] [PMC free article] [PubMed] [Google Scholar]
- Zuo H, Zhang Q, Su S, Chen Q, Yang F, Hu Y.. 2018. A network pharmacology-based approach to analyse potential targets of traditional herbal formulas: an example of Yu Ping Feng decoction. Sci Rep. 8(1):11418. [DOI] [PMC free article] [PubMed] [Google Scholar]
Associated Data
This section collects any data citations, data availability statements, or supplementary materials included in this article.


