

Abstract
Introduction:
Out-of-pocket (OOP) costs for medical and surgical care can result in substantial financial burden for patients and families. Relatively little is known regarding OOP costs for commercially insured patients receiving orthopaedic surgery. The aim of this study is to analyze the trends in OOP costs for common, elective orthopaedic surgeries performed in the hospital inpatient setting.
Methods:
This study utilized an employer-sponsored insurance claims database to analyze billing data of commercially insured patients who underwent elective orthopaedic surgery between 2014 and 2019. Patients who received single-level anterior cervical discectomy and fusion (ACDF), single-level posterior lumbar fusion (PLF), total knee arthroplasty (TKA), and total hip arthroplasty (THA) were identified. OOP costs associated with the surgical episode were calculated as the sum of deductible payments, co-payments, and co-insurance. Monetary data were adjusted to 2019 dollars. General linear regression, Wilcoxon-Mann-Whitney, and Krustal-Wallis tests were utilized for analysis, as appropriate.
Results:
In total, 10,225 ACDF, 28,841 PLF, 70,815 THA, and 108,940 TKA patients were analyzed. Most patients in our study sample had preferred provider organization (PPO) insurance plans (ACDF 70.3%, PLF 66.9%, THA 66.2%, TKA 67.0%). The mean OOP costs for patients, by procedure were: ACDF $3,180 (SD=2,495), PLF $3,166 (SD=2,529), THA $2,884 (SD=2,100), and TKA $2,733 (SD=1,994). Total OOP costs increased significantly from 2014 – 2019 for all procedures (p<0.0001). Among the insurance plans examined, patients with HDHPs had the highest episodic OOP costs. The ratio of patient contribution (OOP costs) to total insurer contribution (payments from insurers to providers) was 0.07 for ACDF, 0.04 for PLF, 0.07 for THA, and 0.07 for TKA.
Conclusions:
Among commercially insured patients who underwent elective spinal fusion and major lower extremity joint replacement surgery, OOP costs increased from 2014 to 2019. The OOP costs for elective orthopaedic surgery represent a substantial and increasing financial burden for patients.
Keywords: out-of-pocket costs, elective, inpatient, orthopaedic surgery, financial toxicity
Introduction
Despite a reduction in the uninsured over the last decade,1 as healthcare costs continue to rise,2 patients are facing increasing financial burden for medical services.3 The annual Kaiser Family Foundation Employer Health Benefits Survey found that the annual premiums for workers with employer sponsored insurance have continued to rise over the past decade.4 In addition to monthly insurance premiums, when undergoing medical procedures, patients are responsible for variable out-of-pocket (OOP) expenses including: co-payments, co-insurance, and deductibles, incurred during the episode of care. A prior study found that these OOP costs have continued to rise for a variety of outpatient surgical procedures.5 In addition to being a source of financial stress, OOP costs can influence patients’ decision to pursue elective surgical care.6 Further, the OOP cost burden may influence the timing of elective surgery, and there is evidence to indicate that some patients may opt to delay surgery until they turn 65 and become Medicare eligible, and thus have lower OOP obligations.7
Nevertheless, the incidence of elective, orthopedic surgeries have been rising over the past few years in both younger and older patients.8–11 Traditionally, costs in the orthopaedic literature have been analyzed from the lens of providers (hospitals and surgeons) and payors (insurers), and not from the perspective of patients (direct OOP contribution). The reimbursement to surgeons have declined in both commercial and public payors,12 while, the payments to hospitals have continued to rise,13 and resulted in rising orthopaedic surgical costs. Yet, relatively little is reported regarding OOP costs for patients receiving inpatient orthopaedic surgery. The aim of this study is to analyze the trends in patients’ OOP cost burden for common, elective orthopaedic surgeries performed in the hospital inpatient setting for commercially insured patients.
Methods
Data Sources:
All data was obtained from the MarketScan Research Commercial Database (IBM Watson Health, Ann Arbor, MI), which is a convenience sample of claims data from >300 plans. Patients included in this database include active employees of large, self-insured corporations, early retirees, Consolidated Omnibus Budget Reconciliation Act (COBRA) continues, and dependents insured by employer-sponsored plans.
Patient Selection:
Patients undergoing inpatient surgery for single-level anterior cervical discectomy and fusion (ACDF), single-level posterior lumbar fusion (PLF), total knee arthroplasty (TKA) and total hip arthroplasty (THA), defined by CPT codes in Supplemental Table 1 were identified. Patients with traumatic, infectious, or malignant etiologies for surgery were excluded by the presence of codes in Supplemental Table 2. Patients <18 years-old were excluded. To create a more homogeneous group, patients undergoing multi-level surgery for either ACDF or PLF were excluded. Those undergoing PLF were further stratified by whether a transforaminal or posterior interbody fusion was performed (CPTs 22633, 22630). To limit the analysis to fee-for-service insurance plans, patients with pre-paid, managed care and capitated insurance plans (health maintenance organizations [HMOs], capitated or partially capitated Point-Of-Service plans) were also excluded.
Study Variables:
The primary dependent variable in this study was OOP costs. This was calculated as the sum of deductible payments, co-payments, and co-insurance for the episode of care. Total net payments, i.e., the insurer’s contribution, were defined as the sum of all payments from the insurer to providers (hospitals and physicians), not including the patient’s OOP costs. All monetary data were adjusted for inflation to 2019-equivalent dollars using the Consumer Price Index (CPI). Patient age, sex, region, and year of surgery were also recorded.
Statistical Analysis:
All monetary variables were Winsorized at the 1st and 99th percentiles to limit the influence of outliers. Descriptive statistics were generated. Trend in OOP costs (total, inpatient, and ratio to net payments) over time were assessed using general linear regression. Differences in OOP costs between insurance plan types were assessed using the Wilcoxon-Mann-Whitney and Kruskal-Wallis tests, as appropriate. All analysis was conducted using SAS 9.4 (SAS Institute, Cary, NC). Statistical significance was considered p<0.05.
Results
Descriptive Statistics
In total, 10,225 single-level ACDF, 28,841 single-level PLF, 70,815 THA, and 108,940 TKA patients were analyzed. The majority of patients undergoing ACDF, PLF, and TKA were female (ACDF 53.0%, PLF 58.0%, TKA 59.9%); THA (48.9% female). The vast majority of patients for each procedure had a preferred provider organization (PPO) insurance plan (ACDF 70.3%, PLF 66.9%, THA 66.2%, TKA 67.0%). The second most common insurance type was consumer-driven health plan (CDHP): ACDF 9.8%, PLF 12.3%, THA 12.3%, TKA 12.1%. (Table 1)
Table 1:
Patient and Plan Characteristics
| Variable | ACDF | PLF | THA | TKA | ||||
|---|---|---|---|---|---|---|---|---|
| N | % | N | % | N | % | N | % | |
| All Patients | 10,225 | - | 28,841 | - | 70,815 | - | 108,940 | - |
| Sex | ||||||||
| Male | 4,803 | 47.0 | 12,102 | 42.0 | 36,196 | 51.1 | 43,684 | 40.1 |
| Female | 5,422 | 53.0 | 16,739 | 58.0 | 34,619 | 48.9 | 65,256 | 59.9 |
| Insurance Plan Type | ||||||||
| Comprehensive | 438 | 4.3 | 1,302 | 4.5 | 3,186 | 4.5 | 5,428 | 5.0 |
| EPO | 93 | 0.9 | 267 | 0.9 | 741 | 1.1 | 1,194 | 1.1 |
| POS | 851 | 8.3 | 2,180 | 7.6 | 5,492 | 7.8 | 8,455 | 7.8 |
| PPO | 7,184 | 70.3 | 19,279 | 66.9 | 46,897 | 66.2 | 73,007 | 67.0 |
| CDHP | 999 | 9.8 | 3,560 | 12.3 | 8,728 | 12.3 | 13,193 | 12.1 |
| HDHP | 660 | 6.5 | 2,250 | 7.8 | 5,760 | 8.1 | 7,647 | 7.0 |
| Region | ||||||||
| Northeast | 1,257 | 12.3 | 3,644 | 12.6 | 14,078 | 19.9 | 16,083 | 14.8 |
| North Central | 1,868 | 18.3 | 6,298 | 21.8 | 16,884 | 23.8 | 28,100 | 25.8 |
| South | 5,447 | 53.3 | 14,799 | 51.3 | 28,788 | 40.7 | 49,545 | 45.5 |
| West | 1,625 | 15.9 | 3,972 | 13.8 | 10,732 | 15.2 | 14,684 | 13.5 |
| Unknown | 28 | 0.3 | 128 | 0.4 | 333 | 0.5 | 528 | 0.5 |
Abbreviations: ACDF = Anterior Cervical Discectomy and Fusion, CDHP = Consumer-Driven Health Plan, EPO = Exclusive Provider Organization, HDHP = High-Deductible Health Plan, PLF = Posterior Lumbar Fusion, POS = Point-Of-Service, PPO = Preferred Provider Organization, THA = Total Hip Arthroplasty, TKA = Total Knee Arthroplasty
OOP Costs
The mean OOP costs by procedure were: ACDF $3,180 (SD=2,495), PLF $3,166 (SD=2,529), THA $2,884 (SD=2,100), and TKA $2,733 (SD 1,994). A substantial proportion of these costs were attributed to the inpatient hospitalization (ACDF $1,689, PLF $1,592, THA $1,788, TKA $1,621) (Table 2). For patients undergoing PLF, 66.6% (n=19,203) received an interbody fusion. The mean total OOP costs for those with vs. without interbody fusion were $3,259 and $3,119 (p=0.04).
Table 2:
Patient Age and Out-Of-Pocket Costs
| Variable | ACDF | PLF | THA | TKA | ||||
|---|---|---|---|---|---|---|---|---|
| Mean | SD | Mean | SD | Mean | SD | Mean | SD | |
| Age | 50.3 | 8.9 | 52.3 | 9.3 | 56.0 | 6.9 | 57.7 | 5.2 |
| OOP Costs ($, 2019) | ||||||||
| Total | 3,180 | 2,495 | 3,166 | 2,529 | 2,884 | 2,100 | 2,733 | 1,994 |
| Inpatient | 1,689 | 1,856 | 1,592 | 1,842 | 1,788 | 1,742 | 1,621 | 1,622 |
| Outpatient | 1,491 | 1,323 | 1,556 | 1,350 | 1,080 | 994 | 1,092 | 976 |
Abbreviations: ACDF = Anterior Cervical Discectomy and Fusion, OOP = Out-Of-Pocket, PLF = Posterior Lumbar Fusion, POS = Point-Of-Service, PPO = Preferred Provider Organization, THA = Total Hip Arthroplasty, TKA = Total Knee Arthroplasty
The ratio of patient contribution (OOP costs) to total insurer contribution (payments from insurers to providers) was 0.07 for ACDF, 0.04 for PLF, 0.07 for THA, and 0.07 for TKA.
Trend in Out-Of-Pocket Costs
Even after adjusting for inflation, the total OOP costs increased significantly from 2014 – 2019 for all procedures (p<0.0001), including: ACDF (2014: $2,786, 2019: $3,416, CAGR 4.2%), PLF (2014: $2,729, 2019: $3,401, CAGR 4.5%), THA (2014: $2,514, 2019: $3,175, CAGR 4.8%), and TKA (2014: $2,369, 2019: $3,048, CAGR 5.2%). (Figure 1).
Figure 1:
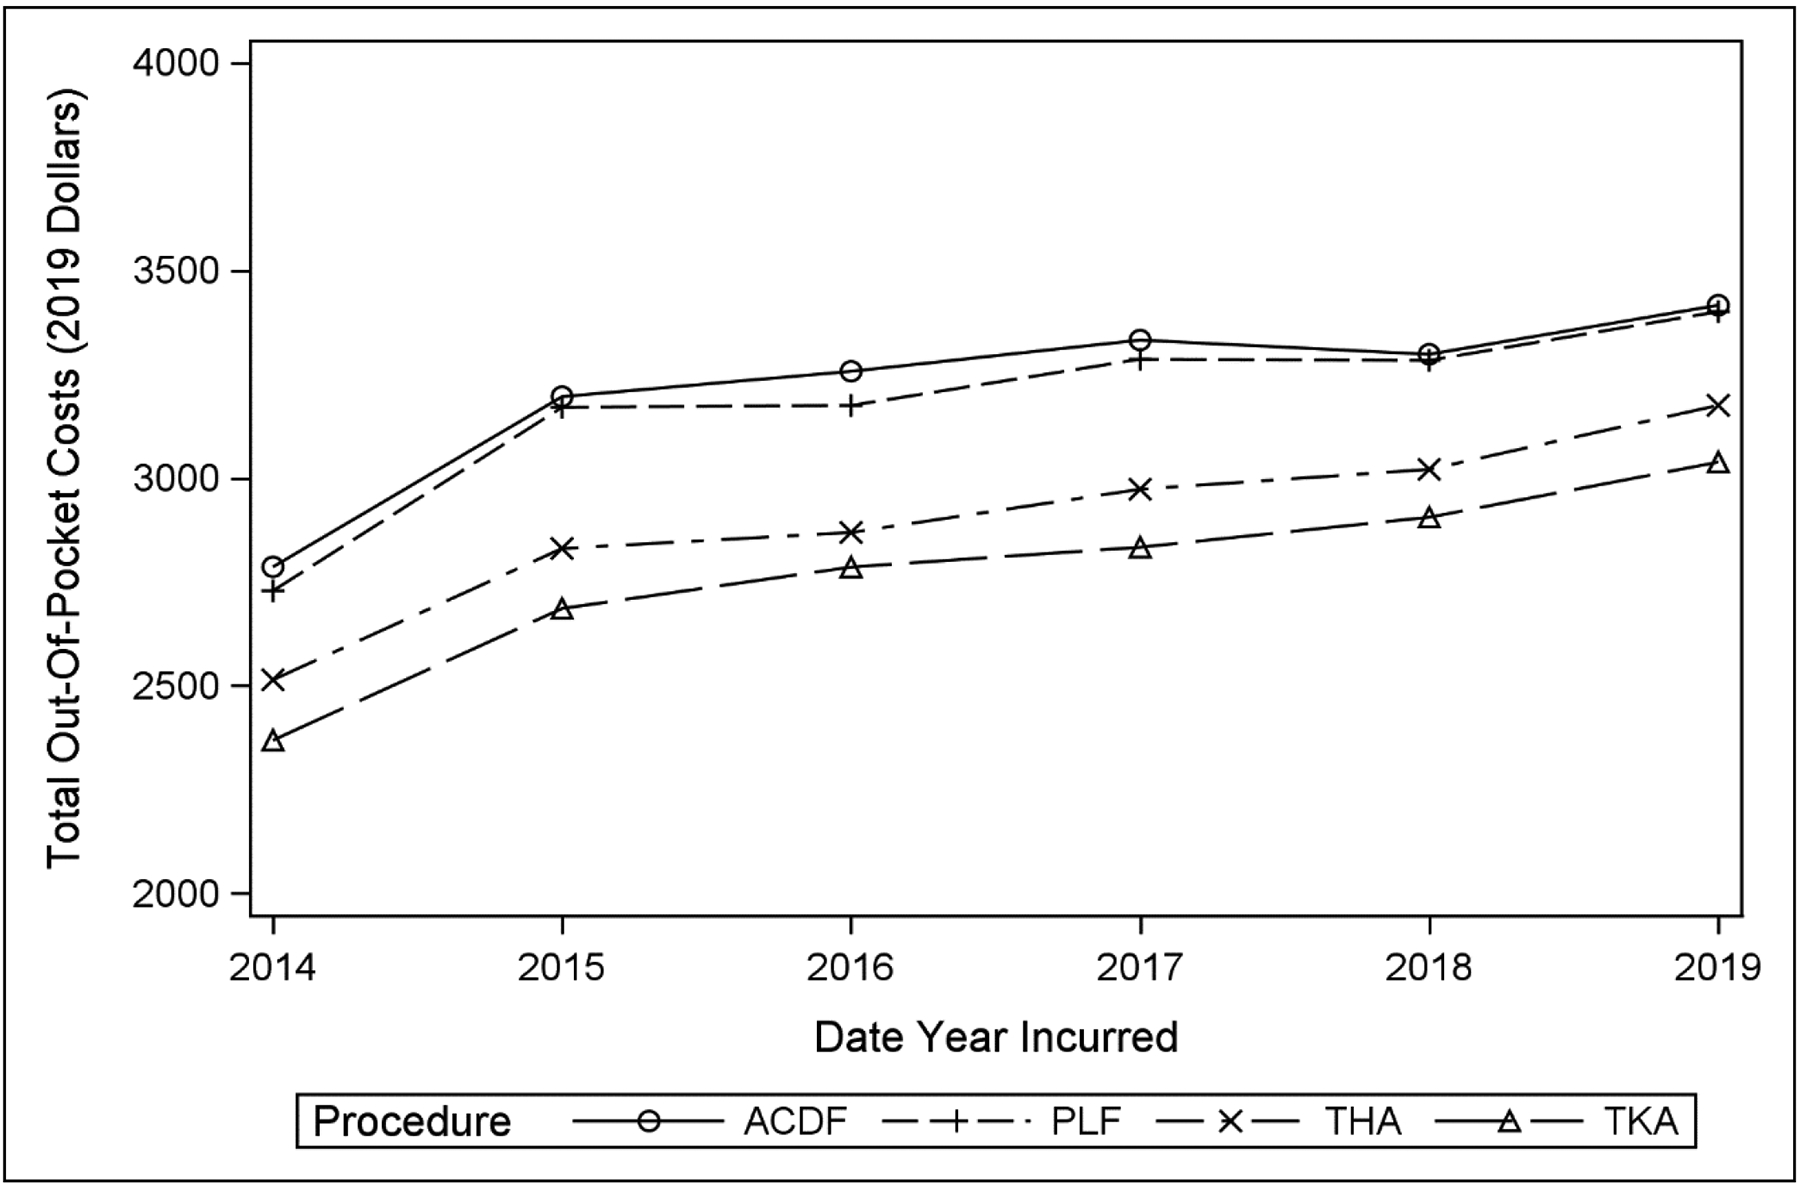
Out-Of-Pocket Costs Over Time, By Procedure
Abbreviations: ACDF = Anterior Cervical Discectomy and Fusion, PLF = Posterior Lumbar Fusion, THA = Total Hip Arthroplasty, TKA = Total Knee Arthroplasty
Out-Of-Pocket Costs by Insurance Type
OOP costs differed significantly by insurance type. Figure 2 depicts mean OOP costs for all procedures combined by insurance type, and data stratified by procedure are provided in Table 3. Across all procedures, patients with high-deductible health plans (HDHP) exhibited highest episodic OOP costs (all p<0.0001).
Figure 2:
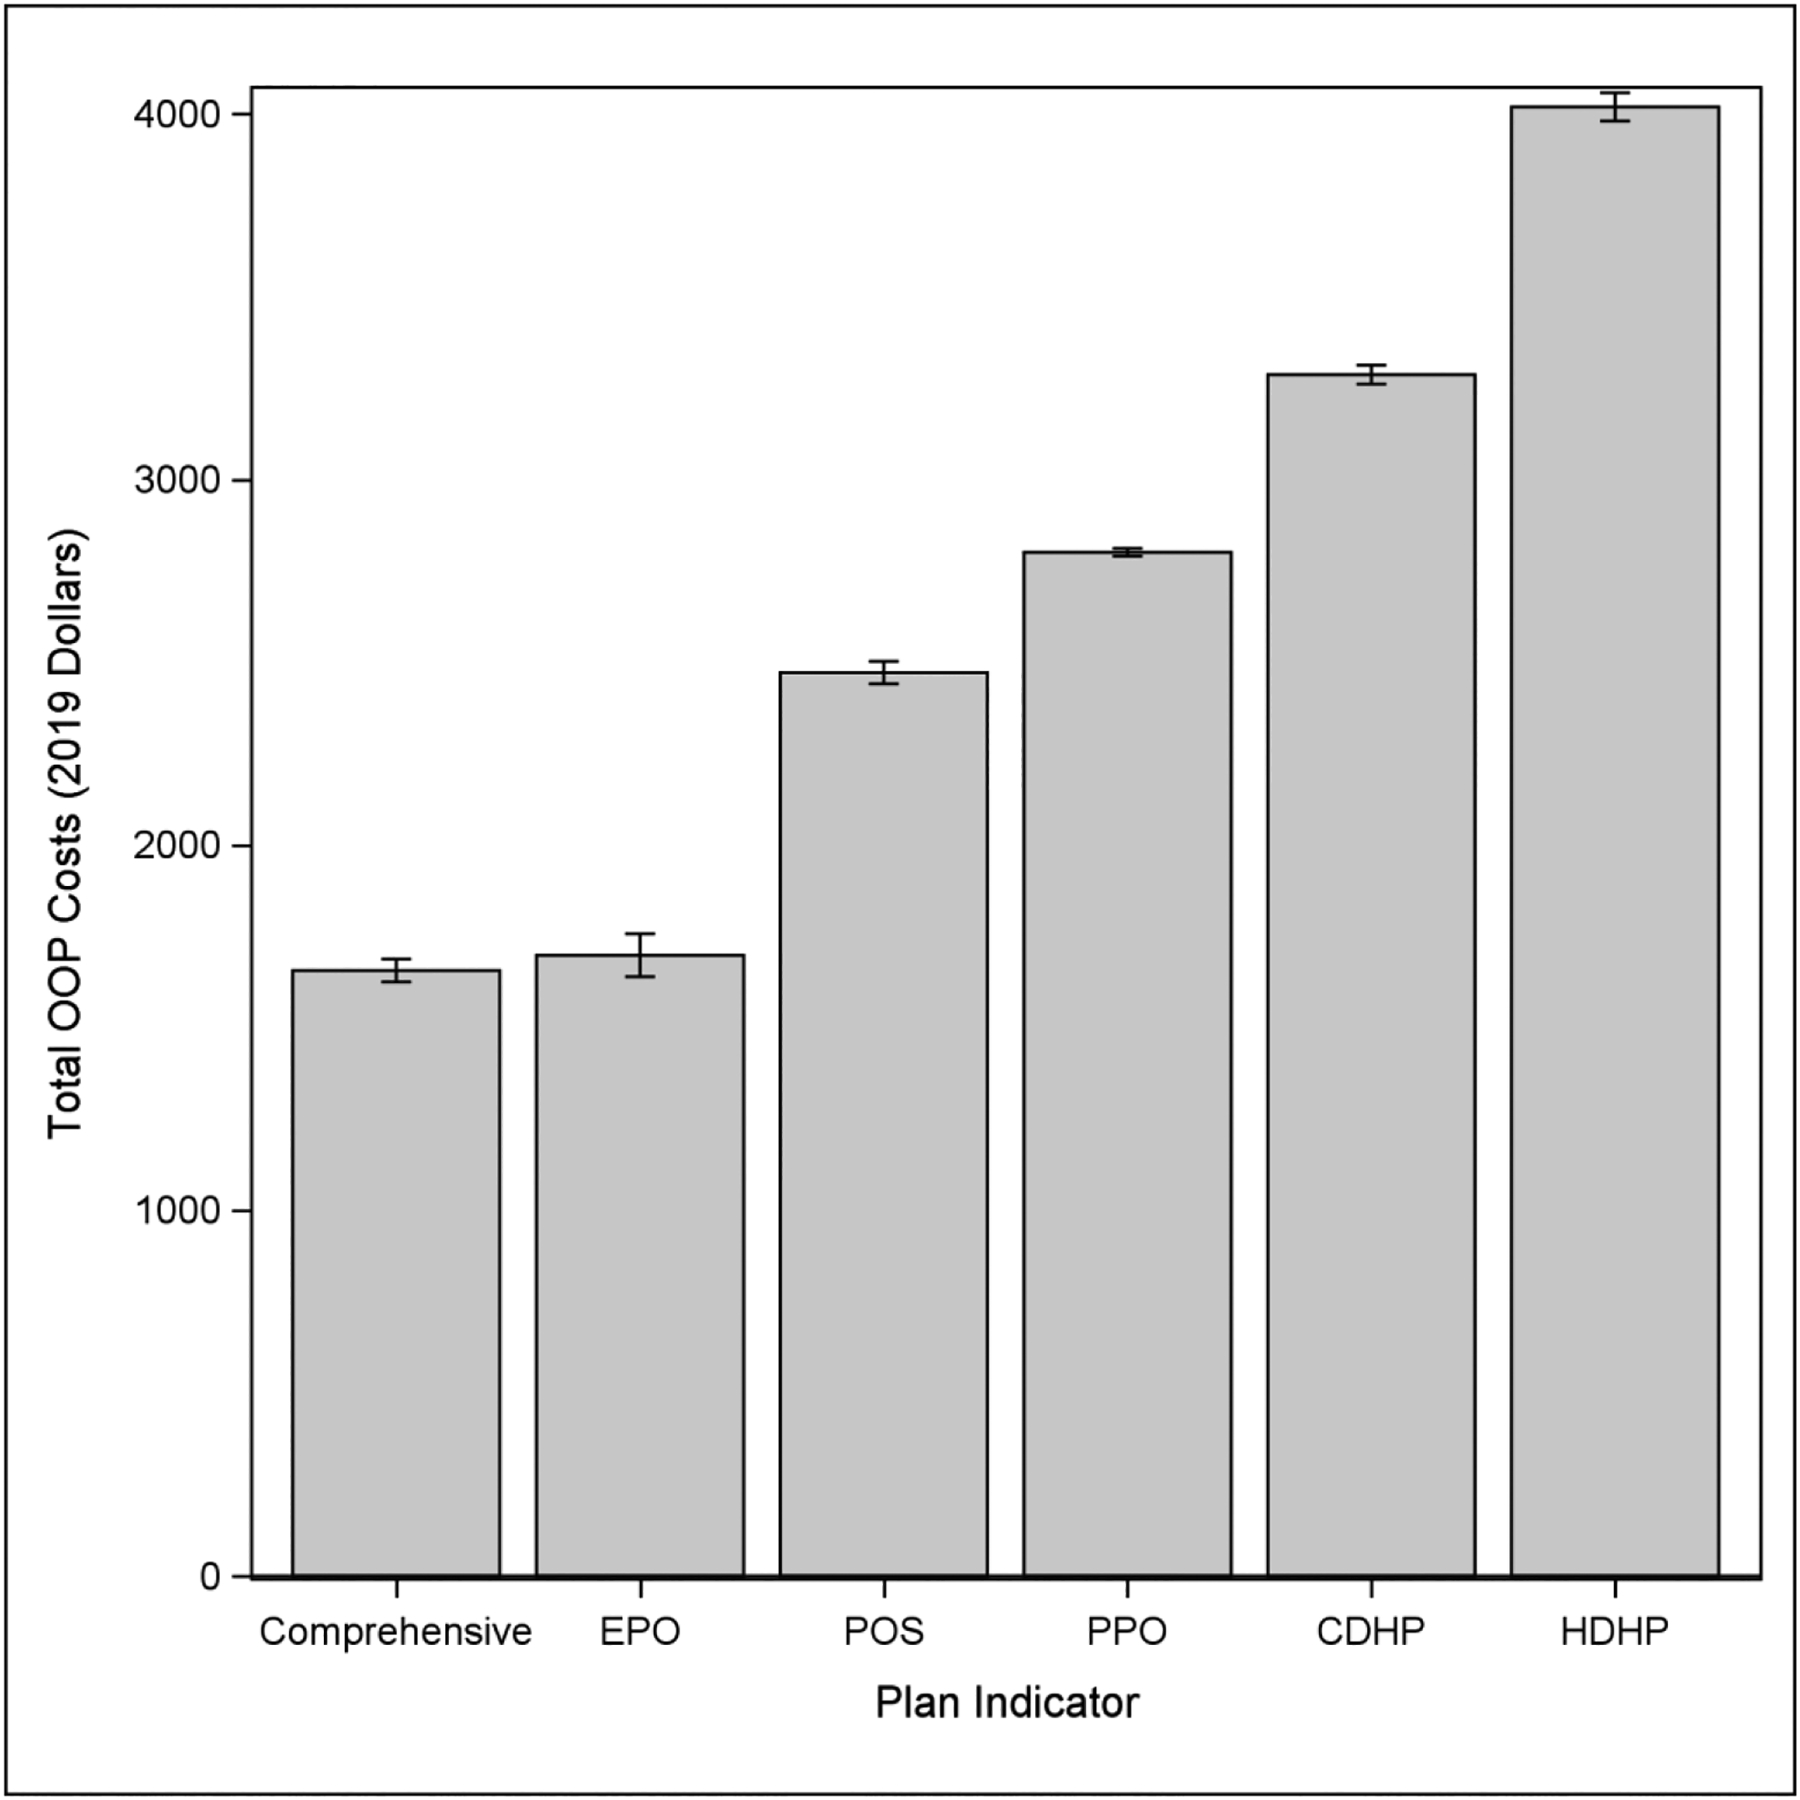
Out-Of-Pocket Costs by Insurance Plan Type, All Procedures
Abbreviations: CDHP = Consumer-Driven Health Plan, EPO = Exclusive Provider Organization, HDHP = High-Deductible Health Plan, OOP = Out-Of-Pocket, POS = Point-Of-Service, PPO = Preferred Provider Organization
Table 3:
Out-Of-Pocket Costs by Insurance Plan Type, By Procedure
| Variable | ACDF | PLF | THA | TKA | ||||
|---|---|---|---|---|---|---|---|---|
| Mean | SD | Mean | SD | Mean | SD | Mean | SD | |
| Insurance Plan Type | ||||||||
| Comprehensive | 1,955 | 2,092 | 1,779 | 1,867 | 1,769 | 1,692 | 1,537 | 1,474 |
| EPO | 1,781 | 1,451 | 1,802 | 1,602 | 1,736 | 1,449 | 1,645 | 1,380 |
| POS | 2,778 | 2,340 | 2,813 | 2,374 | 2,516 | 2,069 | 2,325 | 1,897 |
| PPO | 3,159 | 2,447 | 3,121 | 2,465 | 2,782 | 2,015 | 2,694 | 1,916 |
| CDHP | 3,573 | 2,454 | 3,499 | 2,520 | 3,378 | 2,091 | 3,148 | 2,028 |
| HDHP | 4,346 | 2,977 | 4,332 | 3,022 | 4,072 | 2,398 | 3,860 | 2,393 |
Abbreviations: ACDF = Anterior Cervical Discectomy and Fusion, CDHP = Consumer-Driven Health Plan, EPO = Exclusive Provider Organization, HDHP = High-Deductible Health Plan, PLF = Posterior Lumbar Fusion, POS = Point-Of-Service, PPO = Preferred Provider Organization, THA = Total Hip Arthroplasty, TKA = Total Knee Arthroplasty
Discussion
Out-of-pocket costs may present a significant financial burden for patients requiring medical and surgical treatments.15–18 Yet, OOP costs in elective orthopaedic surgery have not been well studied. The goal of this investigation was to examine the trends in OOP costs in both spinal fusion and lower extremity major joint replacement among commercially insured patients in the United States. Our data demonstrates substantial OOP costs, which have continued to increase significantly for all procedures during the study period. Additionally, we found that among fee-for-service plans, OOP costs differed by insurance types, with highest OOP costs associated with high-deductible health plans.
The high OOP costs identified in this study represent a significant burden on the American patient. The median household income in the United States in 2019 was $64,234.19 Thus, the OOP costs for orthopaedic surgeries could represent 4–5% of the family’s annual income, in addition to the monthly insurance premiums. A 2018 report20 on the economic well-being of U.S households found that 12% of adults would not be able to pay an unexpected expense of $400, and 27% of adults would need to borrow money or sell a possession; thus, an OOP cost of $2,733 for TKA found in our analysis would represent approximately 7x what 40% of the population would not be able to pay without extraordinary measures. Further, a report by the Kaiser Family Foundation found that even among those with employer-sponsored plans, 40% report trouble paying their medical bills.21
Prior research has shown decreased utilization of healthcare services when patients are confronted with high OOP costs.18 Foregoing or delaying needed surgical care may potentially lead to a more complicated and costly course22–24, but in some cases may result in reduction of unnecessary services.25–27 There is evidence that with the implementation of the Affordable Care Act, OOP spending for healthcare services has continued to rise over the past decade, but the rate of increase has slowed.28 In our study, we found that OOP costs for orthopaedic surgeries increased from 2014–2019 congruent with literature from other fields15,27. For instance, Yoon et al. found a 42% increase in OOP costs for commercially insured patients undergoing cranial neurosurgery.27 Feibi et al. reported a 52% increase in OOP costs for commercially-insured patients undergoing thyroidectomy.15 Further, we found that a substantial component of the OOP cost for orthopaedic surgery was attributed to the hospitalization. This is consistent with the prior literature, which has demonstrated that hospitalizations account for the largest component of a patient’s annual OOP expense.29 Prior studies have shown lower OOP costs associated with utilization of outpatient settings such as ambulatory surgery centers.30–32 However, some procedures continue to remain on inpatient only lists due to payor mandates. As additional procedures are allowed to be performed in the outpatient setting, additional cost savings maybe realized for payors and patients.
We found that patients with HDHPs had the highest episodic OOP costs among all fee-for-service insurance health plans examined. This is not surprising, as these plans by design have higher deductibles, co-insurance, and OOP maximums in exchange for lower monthly premiums.4,33 Prior studies have found a similar association between HDHPs and episodic OOP costs for other health services such as primary care,34 maternity care,35 and general surgery.15 Patients under HDHPs have been shown to be vulnerable to temporal clustering of considerable OOP spending due to their high deductibles.29 Nationally, these plans are become increasingly popular (29% enrollment increase from 2007 to 201736) and merit future study with regard to patient utilization of orthopaedic surgical care.
Our study has several limitations. First, our analysis focuses on commercially insured patients and does not include patients with government-sponsored health insurance plans such as Medicare and Medicaid, which are large payors for orthopaedic surgical services. Second, we focused on the inpatient setting and the effect of outpatient surgery (patients who received surgery in ambulatory centers or hospital outpatient departments) on OOP costs was not examined. This could be an area of future inquiry. Further, we did not have access to data on patient’s monthly premiums, which is an important, recurring OOP cost. With lack of the monthly premium data, we are not able to ascertain whether as a whole, HDHP plans cost more or less in terms of total cost to the patient. This also remains an area for future inquiry. Finally, our analysis does not provide actionable directions to reduce patient OOP cost burden. We posit that future work should focus on exploring the impact of OOP costs on socioeconomically disadvantaged groups, and should focus on exploring mechanisms to limit cost burdens on these patients. However, this is beyond the scope of the current study. Despite these limitations, our study represents the largest analysis of episodic OOP costs associated with inpatient orthopaedic surgical procedures among commercially insured patients and provides cost data from the patient’s perspective.
Conclusions
Among commercially insured patients that underwent spinal fusion and major lower extremity joint replacement surgery, OOP costs increased significantly from 2014 to 2019. Patients with HDHPs had the highest episodic OOP costs. An understanding of surgical costs from the patient’s perspective is essential to improve perioperative counseling and develop strategies for future cost-containment efforts.
Supplementary Material
Supplemental Table 1: Procedure Coding
Abbreviations: ACDF = Anterior Cervical Discectomy and Fusion, CPT = Current Procedural Terminology, PLF = Posterior Lumbar Fusion, THA = Total Hip Arthroplasty, TKA = Total Knee Arthroplasty
Supplemental Table 2: Exclusion Diagnosis Codes
Abbreviations: ACDF = Anterior Cervical Discectomy and Fusion, PLF = Posterior Lumbar Fusion, THA = Total Hip Arthroplasty, TKA = Total Knee Arthroplasty
Source of Funding:
This research was supported by NIH National Institute on Aging under Award Number P01AG066603, and the William Rienhoff Jr. Scholarship at Johns Hopkins University.
Footnotes
Financial Disclosures: Dr. Amit Jain has consulting agreements with Depuy Spine, Globus Spine and Stryker Spine. None of the consulting agreements affect the content of this manuscript. The remaining authors have no financial conflicts or disclosures.
References:
- 1.Schoen C, Doty MM, Robertson RH, Collins SR. Affordable care act reforms could reduce the number of underinsured US adults by 70 percent. Health Aff. 2011;30(9):1762–1771. doi: 10.1377/hlthaff.2011.0335 [DOI] [PubMed] [Google Scholar]
- 2.Hartman M, Martin AB, Espinosa N, et al. National health care spending in 2016: Spending and enrollment growth slow after initial coverage expansions. Health Aff. 2018;37(1):150–160. doi: 10.1377/hlthaff.2017.1299 [DOI] [PubMed] [Google Scholar]
- 3.Goldman DP, Joyce GF, Zheng Y. Prescription drug cost sharing: Associations with medication and medical utilization and spending and health. J Am Med Assoc. 2007;298(1):61–69. doi: 10.1001/jama.298.1.61 [DOI] [PMC free article] [PubMed] [Google Scholar]
- 4.Claxton G, Rae M, Damico A, Young G, McDermott D, Whitmore H. Health benefits in 2019: Premiums inch higher, employers respond to federal policy. Health Aff. 2019;38(10):1–10. doi: 10.1377/hlthaff.2019.01026 [DOI] [PubMed] [Google Scholar]
- 5.Billig JI, Lan WC, Chung KC, Kuo CF, Sears ED. The Increasing Financial Burden of Outpatient Elective Surgery for the Privately Insured. Ann Surg. 2020;272(3):530–536. doi: 10.1097/SLA.0000000000004201 [DOI] [PMC free article] [PubMed] [Google Scholar]
- 6.Amanatullah DF, Murasko MJ, Chona DV., Crijns TJ, Ring D, Kamal RN. Financial Distress and Discussing the Cost of Total Joint Arthroplasty. J Arthroplasty. 2018;33(11):3394–3397. doi: 10.1016/j.arth.2018.07.010 [DOI] [PubMed] [Google Scholar]
- 7.Schwartz AJ, Chang YHH, Bozic KJ, Etzioni DA. Evidence of Pent-Up Demand for Total Hip and Total Knee Arthroplasty at Age 65. J Arthroplasty. 2019;34(2):194–200. doi: 10.1016/j.arth.2018.09.087 [DOI] [PubMed] [Google Scholar]
- 8.Beschloss A, Dicindio C, Lombardi J, et al. Marked Increase in Spinal Deformity Surgery Throughout the United States. Spine (Phila Pa 1976). 2021;Publish Ah(215). doi: 10.1097/brs.0000000000004041 [DOI] [PubMed] [Google Scholar]
- 9.Martin BI, Mirza SK, Spina N, Spiker WR, Lawrence B, Brodke DS. Trends in Lumbar Fusion Procedure Rates and Associated Hospital Costs for Degenerative Spinal Diseases in the United States, 2004 to 2015. Spine (Phila Pa 1976). 2019;44(5):369–376. doi: 10.1097/BRS.0000000000002822 [DOI] [PubMed] [Google Scholar]
- 10.Bang H, Chiu Y-L, Memtsoudis SG, et al. An Original Study Total Hip and Total Knee Arthroplasties: Trends and Disparities Revisited. Am J Orthop. 2010;39(9):95–102. https://pdfs.semanticscholar.org/3baa/67082418c5b43c869d58952f6faf17d6ce8d.pdf. [PubMed] [Google Scholar]
- 11.Shukla D, Patel S, Clack L, Smith TB, Shuler MS. Retrospective analysis of trends in surgery volumes between 2016 and 2019 and impact of the insurance deductible: Cross-sectional study. Ann Med Surg. 2021;63. doi: 10.1016/j.amsu.2021.02.022 [DOI] [PMC free article] [PubMed] [Google Scholar]
- 12.Wang KY, Margalit A, Thakkar SC, et al. Reimbursement for Orthopaedic Surgeries in Commercial and Public Payors: A Race to the Bottom. J Am Acad Orthop Surg. 2021;29(23):e1232–e1238. doi: 10.5435/jaaos-d-20-01397 [DOI] [PubMed] [Google Scholar]
- 13.Marrache M, Harris AB, Puvanesarajah V, et al. Hospital Payments Increase as Payments to Surgeons Decrease for Common Inpatient Orthopaedic Procedures. J Am Acad Orthop Surg Glob Res Rev. 2020;4(4). doi: 10.5435/JAAOSGlobal-D-20-00026 [DOI] [PMC free article] [PubMed] [Google Scholar]
- 14.Wang KY, Suresh KV., Harris A, et al. Out-of-Network Billing in Privately Insured Patients Undergoing Elective Orthopaedic Surgery. J Am Acad Orthop Surg. 2021;Publish Ah(00):1–7. doi: 10.5435/jaaos-d-21-00081 [DOI] [PubMed] [Google Scholar]
- 15.Zheng F, Huang Y, Wright J, Kuo JH. Out of Pocket Costs for Patients Undergoing Thyroid Surgery. Ann Surg. 2021;Publish Ah. doi: 10.1097/sla.0000000000005078 [DOI] [PubMed] [Google Scholar]
- 16.Billig JI, Chen JS, Lu YT, Chung KC, Sears ED. The Economic Burden of Out-of-Pocket Expenses for Plastic Surgery Procedures. Plast Reconstr Surg. 2020;145(6):1541–1551. doi: 10.1097/PRS.0000000000006847 [DOI] [PMC free article] [PubMed] [Google Scholar]
- 17.Paez KA, Zhao L, Hwang W. Rising out-of-pocket spending for chronic conditions: A ten-year trend. Health Aff. 2009;28(1):15–25. doi: 10.1377/hlthaff.28.1.15 [DOI] [PubMed] [Google Scholar]
- 18.Chhabra KR, Fan Z, Chao GF, Dimick JB, Telem DA. The Role of Commercial Health Insurance Characteristics in Bariatric Surgery Utilization. Ann Surg. 2021;273(6):1150–1156. doi: 10.1097/SLA.0000000000003569 [DOI] [PubMed] [Google Scholar]
- 19.Income and Poverty in the United States: 2019. https://www.census.gov/library/publications/2020/demo/p60-270.html. Accessed November 30, 2021.
- 20.Reserve Board F. Report on the Economic Well-Being of U.S. Households in 2018, May 2019. 2019. https://www.federalreserve.gov/publications/default.htm. Accessed October 30, 2021.
- 21.Hamel L, Muñana C, Brodie M. Kaiser Family Foundation / LA Times Survey Of Adults With Employer-Sponsored Health Insurance. 2019.
- 22.Phruetthiphat O art, Gao Y, Vasta S, Zampogna B, Piperno A, Noiseux NO. Preoperative Risk Factors for, and Incidence of Delayed Surgery in Elective Primary Total Knee Arthroplasty After Hospital Admission: The ACS-NSQIP. J Arthroplasty. 2016;31(7):1413–1416. doi: 10.1016/j.arth.2015.04.047 [DOI] [PubMed] [Google Scholar]
- 23.Phruetthiphat O art, Gao Y, Anthony CA, Pugely AJ, Warth LC, Callaghan JJ. Incidence of and Preoperative Risk Factors for Surgical Delay in Primary Total Hip Arthroplasty: Analysis From the American College of Surgeons National Surgical Quality Improvement Program. J Arthroplasty. 2016;31(11):2432–2436. doi: 10.1016/j.arth.2016.05.054 [DOI] [PubMed] [Google Scholar]
- 24.Wagner SC, Butler JS, Kaye ID, Sebastian AS, Morrissey PB, Kepler CK. Risk factors for and complications after surgical delay in elective single-level lumbar fusion. Spine (Phila Pa 1976). 2018;43(3):228–233. doi: 10.1097/BRS.0000000000002282 [DOI] [PubMed] [Google Scholar]
- 25.Manning WG, Newhouse JP, Duan N, Keeler EB, Leibowitz A, Marquis MS. Health insurance and the demand for medical care: evidence from a randomized experiment. Am Econ Rev. 1987;77:251–277. [PubMed] [Google Scholar]
- 26.Wharam JF, Landon BE, Galbraith AA, Kleinman KP, Soumerai SB, Ross-Degnan D. Emergency department use and subsequent hospitalizations among members of a high-deductible health plan. J Am Med Assoc. 2007;297(10):1093–1102. doi: 10.1001/jama.297.10.1093 [DOI] [PubMed] [Google Scholar]
- 27.Yoon S, Mooney MA, Bohl MA, et al. Patient out-of-pocket spending in cranial neurosurgery: Single-institution analysis of 6569 consecutive cases and literature review. Neurosurg Focus. 2018;44(5). doi: 10.3171/2018.1.FOCUS17782 [DOI] [PubMed] [Google Scholar]
- 28.Vangipuram Suresh K, Wang K, Margalit A, Jain A. Trends in Out-of-Pocket Healthcare Expenses before and after Passage of the Patient Protection and Affordable Care Act. JAMA Netw Open. 2021;4(4). doi: 10.1001/jamanetworkopen.2021.5499 [DOI] [PMC free article] [PubMed] [Google Scholar]
- 29.Chen S, Shafer PR, Dusetzina SB, Horný M. Annual out-of-pocket spending clusters within short time intervals: Implications for health care affordability. Health Aff. 2021;40(2):274–280. doi: 10.1377/hlthaff.2020.00714 [DOI] [PubMed] [Google Scholar]
- 30.Leti Acciaro A, Ramponi L, Adani R. Outpatient paediatric hand surgery: strategy in healthcare implementation and cost-efficient manner. Musculoskelet Surg. Published online 2021. doi: 10.1007/s12306-021-00723-w [DOI] [PubMed] [Google Scholar]
- 31.Billig JI, Nasser JS, Chen JS, et al. Comparison of Safety and Insurance Payments for Minor Hand Procedures Across Operative Settings. JAMA Netw open. 2020;3(10):e2015951. doi: 10.1001/jamanetworkopen.2020.15951 [DOI] [PMC free article] [PubMed] [Google Scholar]
- 32.Wang KY, Puvanesarajah V, Marrache M, Ficke JR, Levy JF, Jain A. Ambulatory Surgery Centers Versus Hospital Outpatient Departments for Orthopaedic Surgeries. J Am Acad Orthop Surg. 2022;30(5):207–214. doi: 10.5435/jaaos-d-21-00739 [DOI] [PubMed] [Google Scholar]
- 33.High Deductible Health Plan (HDHP) - HealthCare.gov Glossary | HealthCare.gov. https://www.healthcare.gov/glossary/high-deductible-health-plan/. Accessed October 30, 2021.
- 34.Johansen ME, Yun JDY. Trends in total and out-of-pocket expenditures for visits to primary care physicians, by insurance type, 2002–2017. Ann Fam Med. 2020;18(5):430–437. doi: 10.1370/afm.2566 [DOI] [PMC free article] [PubMed] [Google Scholar]
- 35.Moniz MH, Fendrick AM, Kolenic GE, Tilea A, Admon LK, Dalton VK. Out-of-pocket spending for maternity care among women with employer-based insurance, 2008–15. Health Aff. 2020;39(1):18–23. doi: 10.1377/hlthaff.2019.00296 [DOI] [PubMed] [Google Scholar]
- 36.Cohen RA, Zammitti EP. High-deductible Health Plan Enrollment Among Adults Aged 18–64 With Employment-based Insurance Coverage. NCHS Data Brief. 2018;(317):1–8. [PubMed] [Google Scholar]
Associated Data
This section collects any data citations, data availability statements, or supplementary materials included in this article.
Supplementary Materials
Supplemental Table 1: Procedure Coding
Abbreviations: ACDF = Anterior Cervical Discectomy and Fusion, CPT = Current Procedural Terminology, PLF = Posterior Lumbar Fusion, THA = Total Hip Arthroplasty, TKA = Total Knee Arthroplasty
Supplemental Table 2: Exclusion Diagnosis Codes
Abbreviations: ACDF = Anterior Cervical Discectomy and Fusion, PLF = Posterior Lumbar Fusion, THA = Total Hip Arthroplasty, TKA = Total Knee Arthroplasty