

SUMMARY
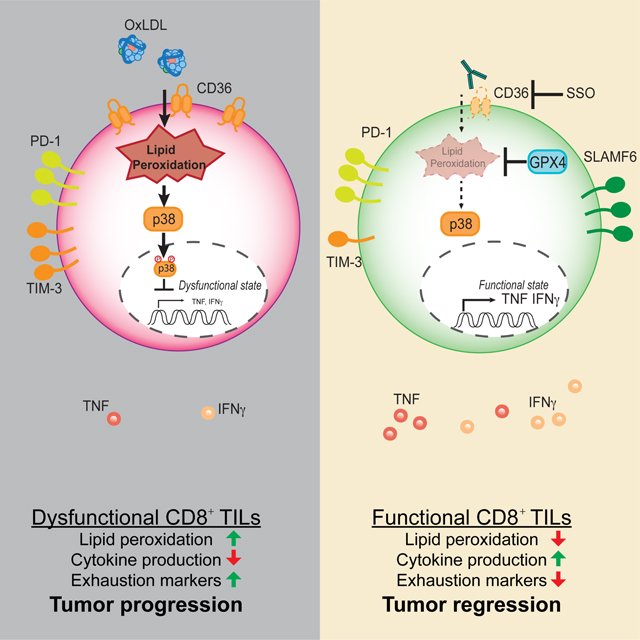
A common metabolic alteration in the tumor microenvironment (TME) is lipid accumulation, a feature associated with immune dysfunction. Here we examined how CD8+ tumor infiltrating lymphocytes (TILs) respond to lipids within the TME. We found elevated concentrations of several classes of lipids in the TME and accumulation of these in CD8+ TILs. Lipid accumulation was associated with increased expression of CD36, a scavenger receptor for oxidized lipids, on CD8+ TILs, which also correlated with progressive T cell dysfunction. Cd36−/− T cells retained effector functions in the TME, as compared to WT counterparts. Mechanistically, CD36 promoted uptake of oxidized low-density lipoproteins (OxLDL) into T cells and this induced lipid peroxidation and downstream activation of p38 kinase. Inhibition of p38 restored effector T cell functions in vitro, and resolution of lipid peroxidation by over-expression of glutathione peroxidase 4 restored functionalities in CD8+ TILs in vivo. Thus, an oxidized lipid-CD36 axis promotes intratumoral CD8 T cell dysfunction and serves as a therapeutic avenue for immunotherapies.
Keywords: oxidized lipids, lipid peroxidation, CD36, CD8 T cells, tumor microenvironment
eTOC blurb
Lipid accumulation is a common metabolic alteration in the tumor microenvironment. Xu et al. show that intratumoral CD8+ T cells adapt to increased lipid concentrations by increasing expression of the scavenger receptor CD36. This in turn leads to intracellular accumulation of oxidized lipid and T cell dysfunction downstream of lipid peroxidation.
INTRODUCTION
Breakthroughs in cancer immunotherapy have revealed the power of harnessing immunity to fight cancer. However, only a small fraction of patients respond to current immunotherapies because the tumor microenvironment (TME) is highly immunosuppressive, highlighting the need to identify additional critical barriers that repress anti-tumor immune responses. Metabolic transformation is one cardinal feature of cancers, and the TME is metabolically distinct from normal tissue or circulation (Buck et al., 2017; Sullivan et al., 2019). An increasing body of evidence suggests that nutrient availability in the TME is a key influence on immune responses. For example, depletion of glucose and tryptophan, and accumulation of lactate in the TME suppresses anti-tumor immunity (Brand et al., 2016; Chang et al., 2015; Ho et al., 2015; Ma et al., 2019; Platten et al., 2012; Zhang et al., 2017).
Another common metabolic alteration in the TME is increased lipid accumulation (Al-Khami et al., 2017; Ma et al., 2019; Zhang et al., 2017). Intratumoral immune cells appear to metabolically adapt by enhancing lipid uptake or storage, which is in turn linked to their dysfunction. For example, lipid accumulation blunts antigen presentation in intratumoral dendritic cells (Cubillos-Ruiz et al., 2015; Herber et al., 2010; Veglia et al., 2017), and induces suppressive functions in neutrophils or myeloid-derived suppressor cells in tumors by promoting uptake of arachidonic acid, prostaglandin E2 synthesis, and fatty acid oxidation (FAO) (Al-Khami et al., 2017; Hossain et al., 2015; Veglia et al., 2019; Yan et al., 2019). Tumor-associated macrophages increase lipid accumulation and in an in vitro co-culture system, tumor cells induce neutral lipid storage and FAO in macrophages (Su et al., 2020). Accumulation of very long chain fatty acids or cholesterol induces CD8+ tumor infiltrating lymphocytes (TIL) dysfunction (i.e., reduced cytotoxicity and TNF and IFNγ cytokine production), which is commonly referred to as T cell exhaustion (Ma et al., 2019; Manzo et al., 2020; Schietinger et al., 2016; Zajac et al., 1998). Lastly, increased lipid uptake in intratumoral regulatory CD4+ T (Treg) cells promotes their maintenance and suppressive functions (Pacella et al., 2018; Wang et al., 2020). This in part involves the scavenger receptor CD36, also known as FAT, a transporter of free fatty acids (FFAs) and oxidized lipids such as oxidized low-density lipoproteins LDL (OxLDL) and phosphocholine containing phospholipids (referred to herein as OxPLs) (Abumrad et al., 1998; Hajri and Abumrad, 2002). CD36 plays a major role in atherosclerosis (Abumrad et al., 1998; Boullier et al., 2005; Hajri and Abumrad, 2002; Que et al., 2018).
Deregulated lipid metabolism and increased reactive oxygen species (ROS) production can lead to lipid peroxidation, which is implicated in a plethora of pathological settings including cardiovascular disease and cancer (Dixon and Stockwell, 2014; Yang and Stockwell, 2016). In atherosclerosis, CD36-mediated uptake of OxLDL promotes inflammatory gene expression and the generation of foamy macrophages (Que et al., 2018; Witztum and Steinberg, 1991). Increased lipid peroxidation in cancer cells has started to receive substantial attention because inactivation of cystine/glutamate antiporter xCT or glutathione peroxidase 4 (GPX4) can sensitize cancer cells to ferroptosis, a programmed cell death initiated by enhanced lipid peroxidation (Dixon et al., 2012; Dixon et al., 2014; Ingold et al., 2018; Yang et al., 2014). GPX4 plays a pivotal role in degrading deleterious lipid peroxides to maintain homeostasis (Yang et al., 2014). Interestingly, CD8+ T cells regulate lipid peroxidation-dependent ferroptosis in tumor cells by secreting IFNγ upon α-PD-L1 immunotherapy (Wang et al., 2019). GPX4-mediated regulation of lipid peroxidation maintains peripheral homeostasis and antigen-stimulated proliferation of T cells in acute viral infection and parasite infection (Matsushita et al., 2015).
Here we examined how CD8+ TILs metabolically adapt to the tumor microenvironment and how such metabolic alterations influence their effector functions. We found that the TME was enriched with lipids, and OxPLs were a prevalent feature of the lipid-laden TME. Given that CD36 recognizes oxidized lipids, we focused on how T cell intrinsic CD36 expression regulated CD8+ TIL functionality. CD8+ TILs increased the expression of CD36, which induced their uptake of OxLDL and rate of lipid peroxidation. CD36 expression was enriched in the dysfunctional PD-1+ TIM-3+ TIL subset that displayed reduced IFNγ and TNF production, and OxLDL inhibited CD8+ T cell cytokine production in a CD36-dependent manner via inducing lipid peroxidation and activation of p38 mitogen-activated protein kinase (MAPK). Importantly, CD36-deficient CD8+ TILs displayed reduced OxLDL uptake and lipid peroxidation, but increased cytokine production and tumor control. Further, suppressing lipid peroxidation via GPX4 over-expression boosted CD8+ TIL effector functions and tumor control. Collectively, these findings uncover a mode of immunosuppression in tumors that involves uptake of oxidized lipids and lipid peroxidation in CD8+ TILs that promotes functional exhaustion, and underscore the therapeutic potential of blocking CD36 to boost anti-tumor immunity.
RESULTS
CD8+ TILs adapt to increased lipid abundance in the TME
The increased lipid content in dysfunctional tumor infiltrating immune cells can arise via increased de novo lipogenesis or import (Al-Khami et al., 2017; Ma et al., 2019; Manzo et al., 2020; Veglia et al., 2019; Wang et al., 2020; Zhang et al., 2017). To better understand what types of lipids immune cells are exposed to and could import from the TME, we profiled the composition and abundance of various lipids within tumor interstitial fluid (TIF) - a proxy of the ‘extracellular milieu’ of the TME - from B16 or MC38 implanted tumors. Tumors were harvested and TILs analyzed approximately 21 days post implantation throughout the study, unless specified otherwise. When compared to serum from the same animal, the TIF contained greater amounts of many species of FFAs, as shown previously (Ma et al., 2019; Zhang et al., 2017), as well as acyl-carnitines, ceramides, and esterified cholesterol (Fig 1A). Likely in response to increased lipid availability in tumors, CD8+ TILs bound to and/or imported more cholesterol and long- and medium-chain FFAs than splenic CD8+ T cells based on flow cytometric analysis of T cells cultured with fluorescently conjugated lipid substrates (NBD cholesterol, Bodipy C12, and Bodipy C16). CD8+ TILs also exhibited overall higher neutral lipid content (e.g., TAGs and CEs based on Bodipy 493 or LipidTOX) compared to their splenic counterparts (Fig 1B, Fig S1A). Altogether, these results indicate that intratumoral CD8+ T cells adapt to the lipid-laden TME by enhancing uptake and storage of fatty acids and cholesterol.
Figure 1. Increased exposure of CD8+ TILs to oxidized lipids in the TME.

C57BL/6J mice were implanted with B16 or MC38 cells and tumors or splenocytes were examined 21 days later.
(A) Lipids in the TIF and serum from B16 or MC38 tumors were measured by mass spectrometry. Heatmap shows the relative abundance of each lipid species normalized to protein concentration (shown as row Z-score). Results are representative of two experiments.
(B) Neutral lipid content (Bodipy 493), uptake of cholesterol and fatty acids (NBD cholesterol, Bodipy C12, and Bodipy C16), were compared between CD8+ T cells isolated from the spleen (CD8+ sp) or B16 tumors (CD8+ TILs) using flow cytometry. Congenic Thy1.1 naïve splenocytes were spiked into each sample to serve as an internal reference for normalizing lipid staining. Relative mean fluorescent intensity (MFI) was calculated as the MFI ratio of the sample to the internal reference.
(C) OxPLs were stained in B16 and MC38 tumors with the biotinylated E06 antibody and detected with alkaline phosphatase conjugated avidin. The nuclei were stained with hematoxylin. Data are representative of three tumors/ group. Areas with positive OxPLs staining were quantified. Scale bar, 250 μm.
(D) Uptake of OxLDL in CD8+ sp or CD8+ TILs from B16 tumors was measured using fluorescently conjugated OxLDL and flow cytometry.
(E) Lipid peroxidation in splenic CD8+ sp or CD8+ TILs from B16 tumors was quantified using BODIPY™ 581/591 C11 and flow cytometry.
Data shown are mean ± SEM. Statistical analyses for (A, B, D, E) were performed by two-tailed unpaired Student’s t-test, ***p < 0.001. Samples were pooled from 2–3 experiments with each group containing n=7–12 (B), n=5–8 (D) or n=9–10 (E) animals.
Oxidative stress is a common feature of cancers (Reuter et al., 2010), and polyunsaturated fatty acids (PUFAs) are highly vulnerable to ROS-induced peroxidation (Yang et al., 2016). PUFA-derived OxPLs are not only found in OxLDL, but are prominent on apoptotic cells, apoptotic bodies and vesicles, and necrotic tissue (Binder et al., 2016), all of which are common in tumors. To determine the extent of OxPLs present in tumors, we performed immunohistochemistry on B16 and MC38 tumor sections with the E06 natural antibody that recognizes OxPLs (Shaw et al., 2000) (Fig 1C, Fig S1B). This revealed intense and diffuse OxPLs staining in both tumor types relative to adjacent healthy skin, demonstrating the prevalence of OxPLs in the TME. OxLDL is another abundant source of OxPL in tissues and we found that CD8+ TILs had higher rates of OxLDL uptake relative to splenocytes using fluorescently conjugated OxLDL and flow cytometry (Fig 1D). CD8+ TILs also displayed a 2–4 fold increase in lipid peroxidation than their splenic counterparts based on the BODIPY® 581/591 C11 lipid peroxidation assay (Fig 1E). This likely results from increased import of oxidized lipid substrates or enhanced intracellular lipid peroxidation due to imbalances in redox states and enhanced ROS in CD8+ TILs.
CD36 is expressed on functionally exhausted TILs
The increase in lipid uptake and OxLDL binding by CD8+ TILs motivated us to examine the expression of specialized lipid transporters on the TILs. Analyses of publicly available transcriptome data in SV40 T antigen (TAG)-driven murine liver tumors revealed that transcripts encoding Cd36 and other FFA transporters including Fabp4 and Fabp5, progressively accumulated as CD8+ TILs became more exhausted (GSE89307) (Philip et al., 2017) (Fig S2A). Thus, we hypothesized that functionally exhausted CD8+ TILs increase the expression of CD36 to metabolically adapt to heightened lipid availability in the TME. In support of this idea, we observed that CD8+ TILs from B16, MC38, or TAG-induced liver tumors (Philip et al., 2017; Staveley-O’Carroll et al., 2003) had increased CD36 expression in ∼20–60% of the cells (B16 or MC38, 21 days post implantation; liver tumors, 15 days post tumor initiation) (Fig 2A, Fig S2B-C). CD36 maintains survival and suppressive functions of intratumoral Treg cells (Wang et al., 2020), and consistently, we observed increased CD36 expression in intratumoral CD4+ T cells, especially FOXP3+ Treg cells (Fig S2D). Expression of CD36 on CD8+ TILs from early-stage tumors (10–12 days post implantation) was barely detectable compared to those in late-stage tumors (21 days post implantation), suggesting that CD36 expression is progressively acquired on CD8+ TILs as tumors grow (Figs S2E-F). Given that T cell exhaustion follows a differentiation path defined by progressive acquisition of inhibitory receptors (PD-1 and TIM-3) and granzyme B expression and loss of proinflammatory cytokine (TNF and IFNγ) secretion (McLane et al., 2019; Wherry and Kurachi, 2015), we further separated CD44+ CD8+ TILs based on PD-1 or TIM-3 expression into an effector cell subset (PD-1- TIM-3- ), an intermediate exhausted subset (PD-1+ TIM-3-), and a terminally exhausted subset (PD-1+ TIM-3+). Transcription factor TOX plays an essential role in the generation and maintenance of exhausted T cells in both chronic viral infection and tumors (Alfei et al., 2019; Khan et al., 2019; Scott et al., 2019; Seo et al., 2019). TNF production negatively correlated with TIM-3 and TOX expression, and was progressively lost from the effector intermediate terminally exhausted subset (Figs S2G-H). CD36 expression was highest on the terminally exhausted subset (PD-1+ TIM-3+) of CD8+ TILs in B16 or MC38 tumors (Fig 2B) and most of the CD36+ TILs expressed the immune-suppressive cytokine IL-10 based on the Thy1.1+ IL-10 reporter mice (10BiT) (Jin et al., 2010) (Fig 2C). These data demonstrated that CD36+ TILs were in a more functionally exhausted state. In addition, the SLAMF6- PD-1+ TIM-3+ CD8+ TILs displayed higher amount of LDL, cholesterol, FFA uptake and neutral lipid content (Bodipy 493) relative to SLAMF6+ PD-1+ TIM-3- TILs or SLAMF6+ PD-1- TIM-3- CD8+ TILs (Fig 2D, Fig S2I). SLAMF6- PD-1+ TIM-3+ CD36+ TILs showed the highest OxLDL and lipid uptake compared to other subsets (Fig 2D, Fig S2I).
Figure 2. CD36 is expressed on functionally exhausted CD8+ TILs.

(A, B, D) C57BL/6J mice were implanted with B16 or MC38 cells as indicated below and tumors or splenocytes were examined 21 days later.
(A-B) The expression of CD36†, PD-1 and TIM-3 was measured in CD8+ sp and CD8+ TILs from B16 tumors or MC38 tumors using flow cytometry. Contour plots show representative staining patterns and scatter plots show the cumulative MFI or % CD36+ of total CD8+ T cells (A) or PD-1- TIM-3+, PD-1+ TIM-3- or PD-1+ TIM-3+ subsets of CD44+ CD8+ TILs (B).
(C) 10BiT mice were implanted with B16 tumor cells and 21 days later CD36 and IL-10 expression (based on Thy1.1 staining) was assessed on CD8+ sp and CD8+ TILs using flow cytometry. Within each tumor analyzed, the percent of IL-10-expressing cells in the CD36- or CD36+ CD8+ TIL subsets is shown.
(D) As in Fig. 1, neutral lipid content (Bodipy 493) and uptake of polar lipids (Bodipy C12, Bodipy C16), cholesterol (NBD-Cholesterol), OxLDL or LDL were measured in B16 CD44+ CD8+ TILs subsets identified by the expression of SLAMF6, PD-1, TIM-3, and CD36 using flow cytometry. Heatmap shows the MFI for each molecule analyzed (shown as row Z-score).
(E) The expression of CD36 and TOX was measured by flow cytometry in PD-1+ CD8+ TILs from human melanomas. Within each tumor analyzed, the percent of CD36+ cells in the TOX- and TOX+ subsets of PD-1+ CD8+ TILs is shown.
(F) CD8+ TILs from human melanomas (GSE72056, (Tirosh et al., 2016)) were examined via scRNAseq analysis for CD36 and TIM-3 (HAVCR2) mRNA expression. The analysis was restricted to the cells whose log-normalized mRNA expression of CD3D, CD8A, PDCD1, CD36 and HAVCR2 were all greater than 0. Contour plot (left) and boxplot (right) shows CD36 mRNA abundance (lognormalized) in CD8+ TILs expressing either higher or lower amounts of HAVCR2. P-value was calculated by Wilcoxon test.
Data shown are mean ± SEM and statistical analyses were performed by two-tailed unpaired Student’s t-test (A), and two-tailed paired Student’s t-test (B, C, E), * p < 0.05, ** p < 0.01, ***p < 0.001.. Samples were pooled from 2–5 experiments with each group containing n=13–29 (A), n=9–17 (B), n=8 (C), n=4 (D) animals or n=7 (E) patients. †, anti-CD36 clone CRF D-2712 was used for CD36 staining; anti-CD36 clone HM36 showed non-specific staining on Cd36−/− cells and thus not used in this study (Figure S2B).
To investigate if CD36 is associated with more exhausted TILs in human tumors, we measured the expression of CD36, TOX, and PD-1 in cryopreserved CD8+ TILs isolated from melanomas. These experiments showed that PD-1+ TOX+ CD8+ TILs had higher CD36 expression relative to PD-1+ TOX- counterparts, albeit the frequency of CD36+ cells was lower than in murine tumors (Fig 2E). This reduction in CD36 can be due to loss of signal upon cryopreservation, since we observed substantial reduction of CD36 expression on human PBMCs after freezing and thawing (Fig S2J). To further characterize human CD8+ TILs, we reanalyzed publicly available single-cell RNA sequencing (scRNAseq) data of human melanoma infiltrating CD8+ T cells (Tirosh et al., 2016). These analyses identified a subpopulation of CD8+ TILs that co-expressed CD36, PDCD1 (PD-1) and HAVCR2 (TIM-3) (Fig 2F, left). PDCD1+ HAVCR2hi CD8+ TILs expressed higher levels of CD36 than PDCD1+ HAVCR2low counterparts (Fig 2F, right). Together, these data show that CD36 is a feature of both murine and human exhausted CD8+ TILs.
CD36 promotes CD8+ TIL dysfunction in tumors
We hypothesized that CD36 ablation on CD8+ TILs may rejuvenate anti-tumor functions of CD8+ T cells. To examine this hypothesis, we first implanted B16 or MC38 tumor cells subcutaneously into Cd36−/− and Cd36+/+ control (WT) mice and monitored tumor growth and TIL function. Both types of tumors grew slower in Cd36−/− mice, and Cd36−/− CD8+ TILs produced more TNF+ and co-produced TNF+ IFNγ+ (i.e., were more polyfunctional) compared to Cd36+/+ controls (Figs 3A-B, Figs S3A-B). Granzyme B (GZMB) expression was also elevated in Cd36−/− CD8+ TILs relative to Cd36+/+ TILs in B16 tumors, while not different in MC38 tumors. In addition, the expression of inhibitory receptors PD-1 or TIM-3 was lower in Cd36−/− CD8+ TILs relative to Cd36+/+ TILs in B16 or MC38 tumors (Figs S3D-E). Depletion of T cells via αCD4 plus αCD8 monoclonal antibodies largely restored B16 tumor growth in Cd36−/− mice, indicating that T cells play a crucial role in the enhanced tumor control of Cd36−/− mice (Fig 3C). Although CD36 was recently found to function in intratumoral Treg cells using conditional deletion strategies (Wang et al., 2020), we did not observe changes in the percentage of FOXP3+ Treg cells in B16 tumors, or the expression of TNF or IFNγ in the FOXP3- conventional CD4+ TILs between Cd36+/+ mice and Cd36−/− mice (Figs S3F-G).
Figure 3. CD36 promotes CD8+ TIL dysfunction.

(A-E) C57BL/6J mice were implanted with B16 or MC38 cells as indicated below and tumors or splenocytes were examined 21 days later.
(A-C) Cd36+/+ or Cd36−/− mice were implanted with B16 cells (A, C) or MC38 cells (B). Tumor growth was measured and the expression of PD-1, TNF, IFNγ, and GZMB in CD8+ TILs was measured by flow cytometry. In (C), Cd36+/+ or Cd36−/− mice were treated with IgG or α-CD4/α-CD8 antibodies to delete T cells.
(D) Mice were implanted with B16-gp33 cells and 10 days later 106 P14 Cd36+/+ or Cd36−/− naïve CD8+ cells were adoptively transferred. Tumor growth was measured and the expression of TNF, IFNγ, and GZMB was measured in donor P14 CD8+ TILs.
(E) Mice were implanted with B16-gp33 cells. 7–10 days later 106 P14 Ly5.1/Ly5.1 Cd36+/+ naïve CD8+ and 106 P14 Ly5.1/Ly5.2 Cd36−/− naïve CD8+ were mixed at 1:1 ratio, and adoptively transferred to the tumor-bearing mice. The expression of TNF, IFNγ, GZMB, SLAMF6, TCF-1, PD-1, and TIM3 was measured in donor P14 Cd36+/+ or Cd36−/−CD8+ TILs 10 days post adoptive transfer.
(F) Mice were implanted with B16 cells and treated with either IgA isotype control or α-CD36 Fab antibody (CRF D-2717, 200 μg, i.p., start on day 7 post tumor engraftment, every two days). Tumor growth was measured and the amounts of TNF and GZMB in CD8+ TILs and FOXP3 in CD4+ TILs were measured by flow cytometry.
Data shown are mean± SEM, and statistical analyses were performed by two-tailed unpaired Student’s t-test, *p < 0.05; **p < 0.01; ***p < 0.001. Results were pooled from 2–4 experiments with each group containing n=7–12 (A), n=7–12 (B), n=6–7 (C), n=4–20 (D), n=6–8 (E), or n=5–9 (F) animals.
Next, we examined the T cell-intrinsic function of CD36 in regulating anti-tumor functions by adoptively transferring naïve TCR transgenic P14 Cd36+/+ or Cd36−/− CD8+ T cells, which recognize the gp33–41 epitope from lymphocytic choriomeningitis virus (LCMV), into mice bearing B16-gp33 tumors that express the gp33 epitope. Similar to what was observed in the germline Cd36−/− mice, the B16-gp33 tumors grew slower in mice that contained P14 Cd36−/− T cells compared to P14 Cd36+/+ cells, and P14 Cd36−/− TILs produced more TNF, IFNγ and GZMB than P14 Cd36+/+ TILs (Fig 3D, Fig S3C). We also co-transferred congenically distinct P14 Cd36+/+ and P14 Cd36−/− cells into the same B16-gp33 tumor-bearing animals and again observed increased cytokine production by the Cd36−/− TILs relative to the controls (Fig 3E). This also revealed that the P14 Cd36−/− TILs contained a higher frequency of SLAMF6+ TCF1+ PD-1+ TIM-3- stem-like progenitor cells, which play a crucial role in anti-tumor CD8+ T cell responses (Im et al., 2016; Miller et al., 2019; Utzschneider et al., 2016); and conversely, a lower frequency of SLAMF6- TCF1- PD-1+ TIM-3+ terminal exhausted cells. We further performed scRNAseq analysis to examine how CD36 affects TIL transcriptomes (Figs S3H-K) and found that relative to WT cells, Cd36−/− cells contained higher amounts of Gzmb and Ifng mRNA and well as several other interferon signature genes (Ifit3, Ifit1, Tnfsf4, Ifitm3, Isg15), possibly indicative of greater exposure to IFNγ (Fig S3K). Altogether, this demonstrated that CD36 enhances the formation of terminally exhausted CD8+ T cells in tumors and suppresses effector molecule gene expression.
Lastly, we explored whether antibody-mediated blockade of CD36 (α-CD36) could increase anti-tumor functions of CD8+ TILs and decrease tumor burden by treating mice with an α-CD36 blocking antibody every three days from day 7 post tumor implantation (200 μg, intraperitoneal (i.p.)). This revealed that α-CD36 blockade suppressed B16 tumor growth, promoted TNF expression in CD8+ TILs, and reduced the frequency of intratumoral Treg cells (Fig 3F). Though α-CD36 blockade did not change the expression of PD-1 or TIM-3 in CD8+ TILs (Fig S3L), our result is consistent with a prior study showing blocking CD36 suppressed tumor growth (Wang et al., 2020). Combined together, these data reveal that CD36 expression promotes CD8+ TIL dysfunction and can be a therapeutic target for cancer in multiple tumor models.
CD36 mediates OxLDL uptake in CD8+ TILs
In discovering that CD36+ PD-1+ CD8+ TILs displayed the highest amount of LDL and OxLDL uptake and accumulation of lipids (Fig 2D), we next asked if these properties were dependent on CD36. To this end, we compared the neutral lipid content and uptake of labeled cholesterol or FFAs between Cd36+/+ and Cd36−/− CD8+ TILs, but did not observe any significant differences, albeit there was a trend for lower neutral lipid content (Figs S4A-D). Nor did we find any differences in mitochondria potential or FAO rates between Cd36+/+ and Cd36−/− CD8+ TILs (Figs S4E-F). These data suggest that the FAA transport function of CD36 was likely not involved in regulating TIL function. However, consistent with the ability of CD36 to mediate uptake of OxLDL, but not native LDL, we observed a selective loss of OxLDL, but not LDL, uptake in Cd36−/− CD8+ TILs compared to the WT controls (Figs 4A-B). Imaging flow cytometry confirmed the colocalization of OxLDL and CD36 in CD8+ TILs (Fig 4C and Fig S4G). Together, these data indicate that CD36 is required for OxLDL uptake in CD8+ TILs and correlates with greater TIL dysfunction.
Figure 4. CD36 mediates OxLDL uptake in CD8+ TILs.

(A-C) Cd36+/+ or Cd36−/− mice were implanted with B16 cells as indicated below and tumors were examined 21 days later.
(A-B) The expression of CD36 and uptake of OxLDL (A) or LDL (B) in Cd36+/+ or Cd36−/− CD8+ TILs were analyzed by flow cytometry. Note, the direct correlation between CD36 expression and OxLDL uptake on Cd36+/+ cells and lack of OxLDL, but not LDL, uptake in Cd36−/− TILs.
(C) The expression of CD3, CD8, PD-1, CD36, and OxLDL uptake in Cd36+/+ CD8+ TILs were measured by Amnis ImageSteam® flow cytometry. BF, bright field. Representative images are shown from 2 experiments. Note, the colocalization of CD36 and OxLDL in merged image (right most panel). The colocalization of CD36 and OxLDL was quantified in the Cd36+ CD8+ TILs based on the Bright Detail Similarity score computed by the Amnis.
Data shown are mean± SEM, and statistical analyses were performed by two-tailed unpaired Student’s t-test. ***p < 0.001, NS, non-significant. Results are pooled from 2–3 experiments with each group containing n=5–11 animals.
OxLDL inhibits CD8+ T cell effector function in a CD36-dependent manner
Given that OxPLs were abundant in the TME and OxLDL is enriched in OxPLs, we next examined the effects of increased oxidized lipid import on CD8+ functions. First, we treated human PBMCs activated in vitro with OxLDL, LDL, HDL, or sulfosuccinimidyl oleate (SSO), an irreversible inhibitor of CD36 (Kuda et al., 2013). This showed that OxLDL, but not LDL or HDL, dose-dependently suppressed TNF and IFNγ production in CD8+ T cells in vitro and interestingly, SSO interfered with this inhibitory effect of OxLDL on cytokine production (Fig 5A, Fig S5B). Second, we found that OxLDL dose-dependently inhibited secretion of TNF and IFNγ in mouse CD8+ T cells in vitro, which was rescued by SSO (Fig 5B, Fig S5D). GZMB production was only marginally affected by OxLDL (Fig S5D). We also found that OxLDL reduced proliferation in CD8+ T cells, as revealed by CFSE labeling (Fig S5E). Note, OxLDL exposure did not decrease T cell viability in these culture conditions (Figs 5A-B and Figs S5A–C). Third, OxLDL repressed cytokine production by CD8+ TILs ex vivo, and this was ameliorated in Cd36−/− CD8+ TILs (Fig 5C). Collectively, these data show that CD36-dependent OxLDL uptake inhibits effector functions of CD8+ T cells.
Figure 5. OxLDL inhibits CD8+ T cell function in a CD36-dependent manner.

(A) Human PBMCs were activated with CD3/CD28/CD2 T Cell Activator in the presence of either vehicle control (Ctrl), OxLDL (50 μg/ml), LDL (50 μg/ml), HDL (50 μg/ml), SSO (100 μM), or the combination of OxLDL (50 μg/ml) and SSO (100 μM) for 6 days. The expression of TNF and IFNγ, and cell viability were measured by flow cytometry 4 hrs after stimulation with PMA/Ionomycin.
(B) P14 CD8+ T cells were activated in vitro with gp33 peptide plus IL-2 for 48 hrs and then treated with either vehicle control (Ctrl), OxLDL (50 μg/ml), LDL (50 μg/ml), HDL (50 μg/ml), SSO (100 μM), or the combination of OxLDL (50 μg/ml) and SSO (100 μM), for another 16∼24 hrs. TNF, IFNγ and cell viability were then measured upon re-stimulation with gp33 for 6 hours and analyzed by flow cytometry.
(C) Cd36+/+ or Cd36−/− CD8+ TILs isolated from B16 tumors 21 days post implantation were purified by FACS and treated with either vehicle control (Ctrl) or OxLDL (50 μg/ml) for 24 hrs. TNF and IFNγ were measured by flow cytometry 4 hrs after stimulation with PMA/ionomycin.
Data shown are mean± SEM and statistical tests were performed by two-tailed unpaired Student’s t-test (A-C), * p < 0.05, ** p < 0.01, *** p < 0.001. Results are pooled from 2–3 experiments with each group containing n=3–6 replicates.
OxLDL induces lipid peroxidation and p38 phosphorylation in CD8+ T cells in a CD36-dependent manner
OxLDL and OxPLs induce oxidative stress in macrophages and endothelial cells, and promote lipid peroxidation in non-alcoholic fatty liver disease (Navab et al., 2004; Que et al., 2018; Sun et al., 2020; Witztum and Steinberg, 1991). Because we found that CD8+ TILs took up OxLDL in a CD36-dependent manner (Fig 4B), we wondered if this would increase lipid peroxidation in the T cells. First, we measured the impact of OxLDL on lipid peroxidation of mouse or human CD8+ T cells activated in vitro using the BODIPY® 581/591 C11 reagent and this revealed that OxLDL, but not LDL, enhanced lipid peroxidation in CD8+ T cells in a dose-dependent manner (Figs 6A-B). Next, to examine whether CD36 could affect CD8+ TIL lipid peroxidation in vivo, we compared the extent of lipid peroxidation between Cd36+/+ and Cd36−/− CD8+ TILs purified from murine B16 tumors, using the BODIPY® 581/591 C11 reagent, and found CD36-deficient TILs displayed a lower level of lipid peroxidation (Fig 6C, left). Similarly, reduced lipid peroxidation was seen in P14 Cd36−/− TILs compared to Cd36+/+ cells, indicating that lipid peroxidation depends directly on T cell-intrinsic CD36 expression (Fig 6C, right). The increase in lipid peroxidation by OxLDL in T cells in vitro was diminished by treatment with lipid anti-oxidant vitamin E (α-Tocopherol, Toco) (Fig 6D). Next we cultured T cells in the presence of OxLDL and Toco to teste if prevention of lipid peroxidation via Toco restores CD8+ T cell effector functions. Indeed, we found that the addition of Toco, rescued the secretion of TNF and IFNγ in CD8+ T cells (Fig 6E). Collectively, these data indicate that OxLDL import via CD36 controls lipid peroxidation in CD8+ TILs and subsequent T cell dysfunction.
Figure 6. OxLDL induces lipid peroxidation in CD8+ T cells in a CD36-dependent manner.

(A) P14 or OT-1 splenocytes were activated in vitro for 48 hrs and then treated with vehicle control (Ctrl), OxLDL (25 or 50 μg/ml), LDL (50 μg/ml) for 24 hrs. The cells were then washed in PBS and incubated with BODIPY® 581/591 C11 for lipid peroxidation assay.
(B) Human PBMCs treated with vehicle control (Ctrl), LDL (50 μg/ml), OxLDL (25 or 50 μg/ml ) for 24 hrs and then washed in PBS and incubated with BODIPY® 581/591 C11 for lipid peroxidation assay.
(C) BODIPY 581/591 C11 lipid peroxidation assay was performed directly ex vivo on CD8+ TILs isolated from B16 tumors implanted 21 days previously into Cd36+/+ or Cd36−/− mice (left) or B6 mice that contained P14 Cd36+/+ or Cd36−/− CD8+ TILs (right). Graphs show the fold change in BODIPY 581/591 C11 fluorescence in Cd36+/+ relative to Cd36−/− TILs.
(D-E) P14 or OT-1 splenocytes were activated in vitro for 48 hrs and then treated with vehicle control (Ctrl), OxLDL (50 μg/ml), α-Tocopherol (Toco, 200 μM), or the combination of OxLDL (50 μg/ml) and Toco (200 μM) for 24 hrs. The cells were washed in PBS and incubated with BODIPY® 581/591 C11 for lipid peroxidation assay (D). TNF and IFNγ were measured upon re-stimulation and analyzed by flow cytometry (E).
(F) P14 Cd36+/+ or Cd36−/− CD8+ T cells were activated in vitro with gp33 peptide plus IL-2 for 48 hrs and then treated with either vehicle control (Ctrl), OxLDL (50 μg/ml), Toco (200 μM), SSO (100 μM), the combination of OxLDL (50 μg/ml) and Toco (200 μM), or the combination of OxLDL (50 μg/ml) and SSO (100 μM), for another 24 hrs. p38 phosphorylation (p-p38) was measured by flow cytometry, and the MFI of p-p38 was normalized to Ctrl.
(G) P14 or OT-1 splenocytes were activated in vitro for 48 hrs and then treated with either vehicle control (Ctrl), OxLDL (50 μg/ml), SSO (100 μM), SB203580 (10 μM), the combination of OxLDL (50 μg/ml) and SSO (100 μM), or the combination of OxLDL (50 μg/ml) and SB203580 (100 μM) for another 24 hrs. TNF and IFNγ were measured upon re-stimulation and analyzed by flow cytometry.
Data shown in A-G are mean ± SEM and statistical analyses were performed by two-tailed unpaired Student’s t-test, * p < 0.05, ** p < 0.01, *** p < 0.001. Samples were pooled from 2–3 experiments with each group containing n=3–8 (A-G).
Oxidative stress including lipid peroxidation, can activate p38 kinase and its downstream signaling pathways (Inoue et al., 2005; McClung et al., 2010). Also activation of p38 induces death in CD8+ T cells, but not in CD4+ T cells (Rincon and Pedraza-Alva, 2003). Therefore, we examined whether OxLDL can activate p38 by measuring its phosphorylation in CD8+ T cells using flow cytometry. We found that OxLDL induced p38 phosphorylation in Cd36+/+ CD8+ T cells , but to a much lesser extent in Cd36−/− CD8+ T cells, and the addition of Toco or SSO diminished OxLDL-induced p38 phosphorylation (Fig 6F). This suggests that OxLDL promotes p38 activation through CD36 and lipid peroxidation. Next, we asked if p38 acts downstream of OxLDL-CD36 signaling to inhibit T cell effector functions by treating CD8+ T cells with OxLDL in the presence or absence of the p38 inhibitor SB203580 in vitro. This showed that p38 inhibition partially rescued the secretion of TNF and IFNγ in the presence of OxLDL (Fig 6G), indicating that OxLDL suppresses CD8 T cell effector functions in part through p38 activation.
GPX4 over-expression restores CD8+ T cell function in tumors
Lipid peroxidation can lead to ferroptosis, a unique form of programmed cell death that is characterized by iron overloading and increased lipid peroxides (Yang and Stockwell, 2016). Glutathione peroxidase 4 (GPX4) can rescue cells from ferroptosis by degrading lipid peroxides (Ingold et al., 2018; Yang et al., 2014). GPX4 is not required for T cell development but is indispensable for T cell homeostasis and T-cell dependent immune responses in acute viral infection (Matsushita et al., 2015). Correlating with reduced lipid peroxidation in Cd36−/− TILs, we observed an increase in Gpx4 mRNA in these cells relative to the Cd36+/+ CD8+ TILs (Fig 7A). Further, reanalyses of publicly available transcriptome data of CD8+ TILs isolated from B16 tumors indicated that Gpx4 mRNA expression declined in CD8+ TILs from B16 tumors (GSE114631) as they differentiated from TCF7+ TIM-3- progenitor-like to TCF7- TIM-3+ terminally exhausted T cells (Siddiqui et al., 2019), suggesting that reduced Gpx4 expression is associated with T cell exhaustion (Fig 7B).
Figure 7. GPX4 OE restores CD8+ T cell function in tumors.

(A) mRNA expression of Gpx4 was compared between P14 Cd36+/+ or Cd36−/− TILs isolated from B16 tumors 21 days post implantation and analyzed by scRNAseq. p-value was calculated by Wilcoxon test.
(B) Analysis of publicly available Gpx4 mRNA expression in naïve, PD-1+ TIM-3+ TCF7-, or PD-1+ TIM-3- TCF7+ P14 CD8+ TILs isolated from B16-gp33 tumors 6 days after tumors became palpable (GSE114631) (Siddiqui et al., 2019).
(C) P14 splenocytes were activated in vitro for 24 hrs, then transduced with either empty retrovirus (EV) or retrovirus overexpressing Gpx4 (GPX4 OE). 24 hrs post transduction, cells were treated with either vehicle control (Ctrl), OxLDL (50 μg/ml), SSO (100 μM), or the combination of OxLDL (50 μg/ml) and SSO (100 μM) for another 24 hrs. TNF and IFNγ were then measured upon re-stimulation and analyzed by flow cytometry.
(D-G) In vitro activated P14 CD8+ T cells were transduced with either empty retrovirus (EV) or a retrovirus overexpressing Gpx4 (GPX4 OE) and 5×10⁵ cells were adoptively transferred into C57BL/6J mice implanted with B16-gp33 cells 7 days prior. Tumor growth was measured (D), and EV and GPX4 OE P14 donor TILs were analyzed at day 21 post tumor implantation by flow cytometry for cell numbers (E), rate of lipid peroxidation (F) or IFNγ and TNF cytokine production (G).
Data shown are mean± SEM and statistical analysis was performed by two-tailed unpaired Student’s t-test *p < 0.05, **p < 0.01, ***p < 0.001. Samples were pooled from 2 experiments with each group containing n=3 (C), n=8 (D), n=3–4 (E, F), and n=5–7 (G) animals.
Because CD36-dependent uptake of OxLDL induced lipid peroxidation and suppressed T cell functions, we reasoned that prevention of lipid peroxidation via GPX4 over-expression (OE), may rescue effector functions of T cells upon OxLDL treatment. To test this idea, we over-expressed GPX4 in CD8+ T cells in vitro and found that GPX4 OE cells produced more TNF and IFNγ in the presence of OxLDL relative to the EV control cells (Fig 7C), suggesting that GPX OE confers resistance to OxLDL-mediated inhibition of cytokine secretion. To test whether GPX4 OE restores CD8+ T cell functionality in vivo, we performed adoptive T cell transfer of P14 GPX4 OE cells or EV control cells to mice bearing B16-gp33 tumors. GPX4 OE in CD8+ TILs resulted in enhanced tumor control compared to the control cells (Fig 7D). Specifically, GPX4 OE led to marked increase in the number of CD8+ TILs (Fig 7E), and decreased lipid peroxidation in CD8 TILs (Fig 7F). Moreover, GPX4 OE boosted anti-tumor effector functions of CD8 TILs by increasing the secretion of TNF and IFNγ+ (Fig 7G, and Fig S7). Together, our data suggest that suppression of lipid peroxidation rescues anti-tumor functions of CD8 TILs.
DISCUSSION
Identifying factors that cause immune suppression in the TME can lead to development of novel immunotherapies. While oxidized lipids are a common feature of inflamed tissues (Binder et al., 2016; Miller and Shyy, 2017), the role of oxidized lipids in the TME has not been well addressed before. Here our study suggests a new mode of immunosuppression in the TME: increased import of oxidized lipids by CD8+ TILs, likely caused by elevated lipid oxidation in tumors, leads to greater lipid peroxidation, activation of p38 kinase, and dysfunction in CD8+ TILs. We found that ablation of CD36 or over-expression of GPX4, suppressed lipid peroxidation, boosted CD8+ TILs effector functions and enhanced tumor control. Our study illuminates immune modulatory effects of oxidized lipids in cancer.
Deregulated lipid metabolism is a hallmark of the TME, and increased lipid uptake and accumulation is observed in many types of intratumoral immune cells, often associated with impaired anti-tumor immune function (Herber et al., 2010; Manzo et al., 2020; Su et al., 2020; Veglia et al., 2019; Wang et al., 2020; Zhang et al., 2017). The metabolic fitness of intratumoral CD4+ Treg cells depends on CD36 expression for heightened lipid uptake and accumulation (Wang et al., 2020). However, we did not observe significant differences in FFA analog uptake, neutral lipid accumulation, mitochondrial potential or fatty acid oxidation between Cd36+/+ and Cd36−/− CD8+ TILs in B16 or MC38 tumors, likely highlighting cell type-specific roles of CD36. Given the redundancy of different lipid transporters in lipid uptake and the importance of FABP4/5 for lipid homeostasis in the skin resident memory T cells (Pan et al., 2017), we postulate that FABP4/5 (and others) may be involved in the lipid uptake and accumulation in CD8+ TILs.
The role of CD36 in OxLDL uptake is well established in the progression of atherosclerosis (Jay et al., 2015; Kita et al., 2000; Mitra et al., 2011; Navab et al., 2004; Pepino et al., 2014). CD36-mediated OxLDL import by macrophages promotes lipid accumulation, particularly of cholesterol, triggers inflammation and apoptosis in macrophages and endothelial cells, which manifests as fatty streaks on artery walls and are notable features of advanced atherosclerosis (Boullier et al., 2001). Interestingly, endogenous OxPLs can activate hyper-inflammatory responses in dendritic cells or macrophages following LPS priming, but they cannot do so alone demonstrating that OxPLs can be immuno-stimulatory or immuno-suppressive in a context-dependent manner (Di Gioia et al., 2020; Zanoni et al., 2016). Along these lines, we found that OxPLs, via Ox-LDL, induced lipid peroxidation and suppressed CD8+ T cell effector functions in a CD36-dependent manner. LDL-bound PUFAs are prone to ROS-mediated lipid peroxidation (Yang et al., 2016). OxLDL or OxPLs cause oxidative stress, inhibit mitochondrial activity, and induce lipid peroxidation in primary hepatocytes (Sun et al., 2020). However, OxLDL per se is likely not the only source of oxidized lipids because as the E06 staining noted, OxPLs were highly abundant in the TME and dying tumor cell vesicles and apoptotic bodies could be other sources of CD36-mediated uptake of oxidized lipids. Phospholipid peroxidation can damage lipid membranes and also trigger ferroptosis, which is characterized by iron-dependent accumulation of lipid hydroperoxides (Stockwell et al., 2017). GPX4 is a key phospholipid hydroperoxidase that protects against lipid peroxidation-induced ferroptosis in tumor cells (Dixon et al., 2012; Yang et al., 2014), and plays a role in maintaining periphery homeostasis and antigen-stimulated proliferation of T cells in acute infection (Matsushita et al., 2015). Our data put forth a model wherein CD36 ligands found in the TME, like OxLDL and OxPLs, are internalized and trigger phospholipid peroxidation in CD36-expressing TILs, which can be ameliorated by enhanced GPX4 expression.
Mechanistically, we found that OxLDL activated p38 kinase in a CD36-dependent manner, and suppression of lipid peroxidation via Toco diminished OxLDL-induced p38 phosphorylation. We also showed that pharmaceutical inhibition of p38 rescued effector functions of CD8 T cells in the presence of OxLDL. Consistently, p38 regulates T cell DNA damage response, redox state and memory formation, and pharmaceutical inhibition of p38 reduces lipid peroxidation and boosts antitumor effector functions of CD8+ T cells in adoptive T cell therapies (Gurusamy et al., 2020). Thus, our work expands on this prior work by identifying actual triggers in the TME that induce p38 activation in TILs and highlighting the role of oxidative stress-responses in CD8+ T cell exhaustion.
Our study unveils a mode of immunosuppression in the TME, opening unappreciated links to explore between lipid oxidation and cancer immunotherapy. The substantial increases in lipid peroxidation in CD8+ TILs could induce their ferroptosis locally in the TME, limiting their numbers. Indeed, a recent paper shows that CD36 promotes lipid peroxidation and ferroptosis in intratumoral CD8+ T cells (Ma et al., 2021). Specifically, Ma et al identify that CD36-dependent lipid uptake suppresses effector functions of CD8 T cells. Given that most lipids are bound to lipoproteins or albumin in tissue or circulation and apoptotic cells in tumors in situ generate a great amount of OxPLs, we argue that oxidized lipids and oxidized LDL, are likely physiological regulators of CD36 activity in the TME. Our study suggests targeting oxidized lipids in the TME with lipid antioxidants may serve as therapeutic adjuvant to immunotherapy. We further elucidated that p38 kinase acted downstream of OxLDL/CD36-dependent lipid peroxidation to suppress effector functions. As our work suggests the role of GPX4 in regulation of anti-tumor functions of CD8+ TILs, therapeutic induction of ferroptosis in cancer cells needs to be approached with caution to avoid unwanted offtarget effects on T cells. Recent studies show that genetic ablation or antibody-mediated blockade of CD36 retards tumor growth (Al-Khami et al., 2017; Su et al., 2020; Wang et al., 2020). Our study along with Ma et al present the evidence that CD36 acts in a CD8+ T cell autonomous manner to suppress TIL effector functions and genetic ablation of CD36 reduces melanoma growth in a T cell-dependent manner. Consistently, we also show that systemic blockade of CD36 with blocking mAb reduced tumor burden (Wang et al., 2020). Interestingly, CD36 is a marker for some types of cancer stem cells, and cancer-specific ablation of CD36 suppresses murine leukemia growth, and metastasis of murine glioblastoma or human oral cancer (Hale et al., 2014; Pascual et al., 2017; Ye et al., 2016). Taken together, these data suggest that CD36 is a promising immunotherapeutic target, acting on many cell types in a concerted manner to impair anti-tumor immune responses whilst simultaneously enhancing tumor progression and spread.
Limitations of the study
It is important to emphasize that while our data implicate a role for oxidized lipids and CD36 signaling in TILs, it is well known that CD36 interacts with other cell surface receptors, such as TLR2/TLR6 or TLR4/TLR6 heterodimers, or with other ligands such as thrombospondin-1, to mediate biological effects, and these too need to be examined (Cursiefen et al., 2011; Seimon et al., 2010; Stewart et al., 2010). While we show that CD36 promoted intratumoral CD8+ T cell exhaustion by restricting differentiation states of progenitor-like exhausted T cells, the cell intrinsic role of CD36 in the regulation of T cell differentiation and exhaustion in viral infection remains to be explored. Additionally, we tried but were unsuccessful in measuring the intracellular concentrations of lipid peroxides in CD8+ TILs by mass spectrometry due to limited detection sensitivity, but we encourage future investigators to examine this especially in human tumors.
STAR METHODS
RESOURCE AVAILABILITY
Lead Contact
Further information and requests for resources and reagents should be directed to and will be fulfilled by the lead contact, Susan M. Kaech (skaech@salk.edu).
Materials Availability
This study did not generate new unique reagents.
Data and Code Availability
The single-cell RNA sequencing data from this paper are available in the GEO database with the accession code GSE171194.
EXPERIMENTAL MODEL AND SUBJECT DETAILS
Mice
C57BL/6/J mice, Ly5.1 (B6.SJL-Ptprca Pepcb/BoyJ), Thy1.1 mice, OT-1 mice, and Alb-Cre (B6.Cg-Tg(Alb-cre)21Mgn/J) mice were purchased from Jackson Laboratories. Cd36−/− mice (Coburn et al., 2000), 10BiT mice (Maynard et al., 2007), P14 mice (Kaech et al., 2003), AST (Albumin-floxStop-SV40 large T antigen (TAG)) mice (Philip et al., 2017), and TCRTAG transgenic mice (B6.Cg-Tg(TcraY1,TcrbY1)416Tev/J) (Staveley-O’Carroll et al., 2003) have been previously described. P14 Cd36−/− mice were generated by crossing P14 mice with Cd36−/− mice. TCRTAG mice were crossed to Thy.1.1 mice to generate TCRTAG Thy.1.1 mice. AST mice were crossed to Alb-Cre mice to generate AST-Alb-Cre mice. Animals were housed in specific-pathogen-free facilities at the Salk Institute and all experimental studies were approved and performed in accordance with guidelines and regulations implemented by the Salk Institute Animal Care and Use Committee.
Cell lines
B16-F10 melanoma cell line (B16) was cultured in DMEM with 10% fetal bovine serum and 1% penicillin-streptomycin (Invitrogen). B16-F10 melanoma cell line that expresses gp33 (B16-gp33), was cultured in DMEM with 10% fetal bovine serum, 1% penicillin-streptomycin and 250 μg/ml G418 (Invitrogen #10131027). B16 and B16-gp33 were a gift from Hanspeter Pircher (University of Freiburg, Germany) (Prevost-Blondel et al., 1998). MC38 colon adenocarcinoma cell line was maintained in DMEM/F12 medium with 10% fetal bovine serum, 1% penicillin-streptomycin and MEM Non-Essential Amino Acids. All the tumor cell lines were used for implantation when in exponential growth phase.
Human sample assessment
Human peripheral blood mononuclear cells (PBMC) were collected from healthy donors, and isolated from buffy coats by density gradient cell separation. All patients signed an approved informed consent before providing tissue samples. Patient samples were collected on a tissue-collection protocol approved by the MSK Institutional Review Board.
METHOD DETAILS
Cell cultures
Oxidization of LDL in vitro was prepared as previously described (Que et al., 2018). Briefly, native LDL was diluted to 100 μg/ml in PBS, and incubated with 10 μM CuSO4 for 24 hrs at 37°C. OxLDL was then concentrated in Amicon Ultra 100K Centrifugal filter.
For in vitro T cell culture, naïve P14 or OT-1 splenocytes were activated in RPMI 1640 medium containing 10% fetal bovine serum, 1% penicillin-streptomycin, 2 mM L-glutamine, 10 U/ml IL-2, with 0.1 μg/ml gp33 (GenScript) or 0.02 μg/ml OVA peptide (GenScript), respectively. At 48 hrs post activation, splenocytes were then treated with vehicle control (PBS), or 50 μg/ml OxLDL, or 50 μg/ml LDL, or 50 μg/ml HDL, or 100 μM SSO, or 200 μM α-Tocopherol (Toco), or 10 μM SB203580, or the combination of 50 μg/ml OxLDL and 100 μM SSO, or the combination of 50 μg/ml OxLDL and 200 μM Toco, or the combination of 50 μg/ml OxLDL and 10 μM SB203580 for another 20∼24 hrs. To detect cytokine production in vitro, activated CD8 T cells were re-stimulated with cognate peptide (0.1 μg/ml gp33 or 0.02 μg/ml OVA peptide) in the presence 2.5 μg/ml Brefeldin A for 6 h at 37°C, followed by surface and intracellular staining described below. For CFSE labeling, naïve splenocytes were incubated with 1 μM CellTrace CFSE dye (Invitrogen # C34554) for 15 min at 37°C prior to in vitro activation.
For ex vivo CD8+ TILs cell culture, sorted CD8+ TILs were treated with vehicle control (PBS) or 50 μg/ml OxLDL for 24 hrs. To detect cytokine production ex vivo, CD8+ TILs were then stimulated with 10 ng/ml PMA and 3 μM Ionomycin in the presence 2.5 μg/ml Brefeldin A Solution for 4 h at 37°C, followed by surface and intracellular staining described below.
Human PBMC in vitro culture
The cryopreserved PBMCs were thawed, and activated with ImmunoCult™ Human CD3/CD28/CD2 T Cell Activator (STEMCELL) in the presence of either vehicle control (Ctrl), OxLDL (50 μg/ml), LDL (50 μg/ml), HDL (50 μg/ml), SSO (100 μM), or the combination of OxLDL (50 μg/ml) and SSO (100 μM), for 6 days. Cell viability was measured by Live Dead staining (Invitrogen) by flow cytometry. TNF and IFNγ were measured by flow cytometry 4 hrs after stimulation with PMA/Ionomycin in the presence of Brefeldin A (Invitrogen).
TIF and serum collection
TIF was collected from tumors using a previously described approach (Ho et al., 2015; Sullivan et al., 2019). Tumors were briefly rinsed in PBS and blotted on filter paper (VWR, Radnor, PA, 28298–020). The tumors were then put onto 70 μm cell strainers (VWR) affixed atop 50mL conical tubes, and centrifuged for 10 min at 4°C at 100 g. TIF was then collected from the conical tube, frozen in liquid nitrogen and stored at −80°C until further analysis. Blood was collected from the same animal via retro-orbital bleeding, and centrifuged at 845 g for 10 minutes at 4°C to separate serum, which was frozen in liquid nitrogen and stored at −80°C until further analysis.
Fatty acid measurements using LC/MS
Lipids were extracted using a modified version of the Bligh-Dyer method (Bligh and Dyer, 1959). Briefly, TIF and serum samples were diluted in 1 mL PBS and shaken in a glass vial (VWR) with 1 mL methanol and 2 mL chloroform containing internal standards (13C16-palmitic acid, d7-Cholesterol) for 30s. The resulting mixture was vortexed for 15s and centrifuged at 2400 × g for 6 min to induce phase separation. The organic (bottom) layer was retrieved using a Pasteur pipette, dried under a gentle stream of nitrogen, and reconstituted in 2:1 chloroform:methanol for LC/MS analysis. Lipidomic analysis was performed on a Vanquish HPLC online with a Q-Exactive quadrupoleorbitrap mass spectrometer equipped with an electrospray ion source (Thermo). Data was acquired in positive and negative ionization modes. Solvent A consisted of 95:5 water:methanol, solvent B was 60:35:5 isopropanol:methanol:water. For positive mode, solvents A and B contained 5 mM ammonium formate with 0.1% formic acid; for negative mode, solvents contained 0.028% ammonium hydroxide. A Bio-Bond (Dikma) C4 column (5 μm, 4.6 mm × 50 mm) was used. The gradient was held at 0% B between 0 and 5 min, raised to 20% B at 5.1 min, increased linearly from 20% to 100% B between 5.1 and 55 min, held at 100% B between 55 min and 63 min, returned to 0% B at 63.1 min, and held at 0% B until 70 min. Flow rate was 0.1 mL/min from 0 to 5 min, 0.4 mL/min between 5.1 min and 55 min, and 0.5 mL/min between 55 min and 70 min. Spray voltage was 3.5 kV and 2.5 kV for positive and negative ionization modes, respectively. Sheath, auxiliary, and sweep gases were 53, 14 and 3, respectively. Capillary temperature was 275°C. Data was collected in full MS/dd-MS2 (top 5). Full MS was acquired from 100–1500 m/z with resolution of 70,000, AGC target of 1×10⁶ and a maximum injection time of 100 ms. MS2 was acquired with resolution of 17,500, a fixed first mass of 50 m/z, AGC target of 1×10⁵ and a maximum injection time of 200 ms. Stepped normalized collision energies were 20, 30 and 40%. Lipid identification was performed with LipidSearch (Thermo). Mass accuracy, chromatography and peak integration of all LipidSearch-identified lipids were verified with Skyline (MacLean et al., 2010). Peak areas were used in data reporting, data was normalized using internal standards.
Tumor engraftment and treatment of tumor-bearing mice
For tumor engraftment, 105 B16, or 105 MC38 tumor cells were injected subcutaneously in 100μl PBS. Tumors were measured via caliper every 2–3 days post tumor engraftment with or without the indicated treatments and tumor volume was calculated by volume = (length × width2)/2. For antibodybased treatment, tumor-bearing mice were i.p. treated with α-CD4 antibody (200 μg per injection, clone GK1.5, BioXcell) and α-CD8 antibody (200 μg per injection, clone 2.43, BioXcell) every three days from day 7 post tumor implantation, or α-CD36 antibody (200 μg per injection, clone CRF D2717 (Wang et al., 2020)) every two days from day 7 post tumor implantation.
Tumor digestion and cell isolation
Tumors were minced into small pieces in RPMI containing 2% fetal bovine serum, 0.5 μg/ml DNase I (Sigma-Aldrich), and 0.5 mg/ml collagenase Type I (Sigma-Aldrich) and kept for digestion for 30 min at 37°C, followed by filtration with 70 μm cell strainers. Filtered cells were incubated with ACK lysis buffer (Invitrogen) to lyse red blood cells, mixed with excessive RPMI 1640 medium containing 10% fetal bovine serum and 1% penicillin-streptomycin, and centrifuged at 400g for 5 min to obtain single-cell suspension.
Uptake of fatty acids, cholesterol, or lipoproteins, neutral lipid content assay, lipid peroxidation assay, and mitochondrion staining
For measuring uptake of fatty acids or cholesterol, cells were incubated in PBS containing 0.5 μg/ml C1-BODIPY® 500/510 C12 (ThermoFisher, D3823), or PBS containing 0.1 μg/ml BODIPY™ FL C16 (ThermoFisher, D3821) for 20 min at 37°C. For measuring uptake of cholesterol, cells were incubated in PBS containing NBD Cholesterol (ThermoFisher, N1148) at final concentration of 10 μM for 15 min at 37°C. For measuring LDL uptake, cells were incubated in PBS containing 0.3% BSA and 20 μg/ml BODIPY™ FL LDL (ThermoFisher, L3483) for 30 min at 37°C. For measuring OxLDL uptake, cells were incubated in PBS containing OxLDL-DyLight™-488 (1:20 dilution, Oxidized LDL Uptake Assay Kit, Cayman Chemical, #601180), or PBS containing 50 μg/ml DiIlabeled human high oxidized low density lipoprotein (Kalenbiomed, Cat# 770262–9) for 30 min at 37°C. After incubation, cells were washed with MACS buffer (PBS containing 2% FBS) for surface staining. For neutral lipid content detection, after permeabilization and fixation, cells were stained using BODIPY® 493/503 (ThermoFisher, D3922) at a final concentration of 250 ng/ml , or LipidTOX (ThermoFisher, H34477, 1:1000 dilution) together with other intracellular proteins. For measuring lipid peroxidation, cells were incubated in PBS containing 2 μM BODIPY® 581/591 C11 reagent (ThermoFisher, C10445) for 30 min at 37°C before live dead and surface staining. Intratumoral CD8+ T cells or splenic CD8+ T cells were sorted prior to C11 lipid peroxidation assay to avoid interference of tumor cells in the assay. For measuring mitochondrial membrane potential, cells were washed and incubated with PBS containing 10 nM MitoTracker® Deep Red FM (ThermoFisher) for 15min. After staining, the cells were washed and resuspended in fresh MACS buffer (PBS containing 2% FBS) for surface marker staining as described above.
Flow cytometry, cell sorting and antibodies
Single cell suspensions were incubated with Fc receptor-blocking anti-CD16/32 (BioLegend) on ice for 10 min before staining. Cell suspensions were first stained with LIVE/DEAD® Fixable Violet or Red Dead Cell Stain Kit (ThermoFisher) for 5 min at room temperature. Surface proteins were then stained in FACS buffer (PBS containing 2% FBS and 0.1% sodium azide) for 30 min at 4°C. To detect cytokine production ex-vivo, cell suspensions were re-suspended in RPMI 1640 containing 10% FBS, stimulated by 50 ng/ml PMA and 3 μM Ionomycin in the presence 2.5 μg/ml Brefeldin A (BioLegend #420601) for 4 h at 37°C. Cells were processed for surface marker staining as described above. For intracellular cytokine staining, cells were fixed in BD Cytofix/Cytoperm (BD #554714) for 30 min at 4 °C, then washed with 1× Permeabilization buffer (Invitrogen #00–8333-56). For transcription factor staining, cells were fixed in Foxp3 / Transcription Factor Fixation/Permeabilization buffer (Invitrogen #00–5521-00) for 30 min at 4 °C, then washed with 1× Permeabilization buffer. Cells were then stained with intraceulluar antibodies for 30 min at 4 °C. Samples were processed on LSR-II flow cytometer (BD Biosciences) and data were analyzed with FlowJo V10 (TreeStar). Cells were sorted either on FACSAria™ III sorter or Fusion sorter (BD Biosciences). The following antibodies against mouse proteins were used: anti-CD45 (30-F11), anti-CD3ε (17-A2), anti-CD4 (GK1.5), anti-CD8a (53–6.7), anti-CD44 (IM7), anti-PD-1 (29F.1A12), antiTIM-3 (RMT3–23), anti-Ly5.1 (A20), anti-Ly5.2 (104), anti-Thy1.1 (OX-7), anti-Thy1.2 (30-H12), anti-CD36 (CRF D-2712), anti-IgA (mA-6E1), anti-FoxP3 (FJK-16S), anti-IFN-γ (XMG1.2), antiTNF-α (MP6-XT22), anti-GZMB (GB11), anti-TCF1 (Cell Signaling #90511), anti-SLAMF6 (13G3). These antibodies were purchased from Invitrogen, Biolegend, Cell Signaling, or eBiosciences. To be noted, the clone CRF D-2712 specifically recognizes CD36 because the staining was found on Cd36+/+ cells but not on Cd36−/− cells; in comparison, clone HM36 showed non-specific staining on Cd36−/− cells, thus was not used in the study (Figure S2B).
To detect cytokine production ex-vivo in human PBMC, cell suspensions were re-suspended in RPMI 1640 containing 10% FBS, stimulated with Staphylococcal enterotoxin B (SEB) and incubated for 16 hrs in the presence of Brefeldin A. The cells were washed with PBS and stained with LIVE/DEAD™ Fixable Red Dead Cell Stain Kit (ThermoFisher) for 5 minutes at room temperature. Cells were then stained with surface antibodies CD3, CD4, CD8, CD45RA, CCR7, PD-1 and CD36 for 30 minutes at 4°C and cells were washed with FACS buffer. For intracellular staining, the PBMC were treated with Intracellular Fixation & Permeabilization Buffer Set (Invitrogen# 88–8824-00) for 20 minutes at 4°C. The PBMC were then incubated with IFN-γ and TNF antibody for 1 hour at 4°C. The PBMCs were washed with permeabilization buffer and fixed in 1% paraformaldehyde. Data was acquired on BD Fortesa and analyzed with Flowjo. Antibodies for flow cytometry against human CD3 (UCHT1), CD4 (SK3), CD45RA (HI100), CCR7 (CO43H7), PD-1 (EH12.2H7), CD36 (5–271) were purchased from BioLegend; CD8 (SK1) and IFN-γ (B27) from BD Biosciences; and TNF (Clone MAb11) from Invitrogen.
Single cell suspensions from patients’ tumors were obtained by digesting tumor samples with type I collagenase (2 mg/mL), type V hyaluronidase (2 mg/mL) and type IV deoxyribonuclease I (200 U/mL) in serum-free RPMI 1640 using a GentleMACS Octo Dissociator (Miltenyi Biotec). Human samples were analyzed following safety regulation and stained with the following antibodies for FACS analysis: anti-CD45 (2D1), anti-CD3 (SK7), anti-CD4 (SK3), anti-CD8 (RPA-T8), anti-CD36 (TR9), anti-PD1 (MIH4), and anti-TOX (TXRX10). Samples were acquired using a Cytek Aurora flow cytometer and data analyzed with FlowJo 10.6 software.
PCR and Cloning
Murine GPX4 transcript variant 1 (NM_008162.4) was amplified from cDNA synthesized with SuperScript II reverse transcriptase (Invitrogen) from total RNA purified from mouse testis (TRIzol, Invitrogen). The following primers were used: forward primer 5’ GGTGGTGCGGC CGCATGAGCTGGGGCCGTC; and reverse primer 5’ GGTGGTGTCGAC TATTCCCACAAGGCAGCCAG. The murine GPX4 cDNA, which includes an SECIS element at 3’ UTR necessary for selenocysteine incorporation, was cloned into the NotI and SalI sites of MSCV-Thy1.1 retroviral vector (a gift from Richard A. Flavell at Yale University).
Human CD36 cDNA was sub-cloned from pBABE vector expressing human CD36 (Kuda et al., 2013) to the EcoRV site of pLenti-EF1A-PGK-puro (a gift from Geoffery Wahl at Salk Institute of Biological Sciences).
Adoptive T cell transfer and T cell transduction
106 naïve gp33-specific Cd36+/+ or Cd36−/− P14 TCR transgenic CD8+ cells were transferred to tumor-bearing mice 7 days post tumor engraftment (retro-orbital). For the transfer of naive TCRTAG T cells, 1 × 10⁵ to 2.5 × 10⁶ CD8+ splenocytes from TCRTAG Thy1.1 transgenic mice were adoptively transferred into AST-Alb-Cre mice.
For GPX4 over-expression, 293T cells were transfected with Eco-helper and either MSCV control vector or vector over-expressing GPX4. 48 hr later, supernatant containing retroviral particles was ready for transduction. P14 donor splenocytes were in vitro activated by 0.1 μg/ml gp33 and 10 U/ml IL-2 at 37°C for 24 h, then spin-transduced (1500 g) with retrovirus supernatant from 293T cells for 90 min at 30 °C in the presence of 5 μg/ml polybrene. Shortly after viral transduction 5×10⁵ P14 congenic CD8+ T cells were transferred into C57BL/6 mice that were implanted with B16-gp33 cells 7–10 days ago.
For CD36 over-expression, 293T cells was transfected with lentiviral vector, PAX2, and vesicular stomatitis virus G glycoprotein using the X-tremeGENE 9 reagent (Sigma). Twenty-four hours later, the medium was removed and replaced with 4 ml fresh medium, and the medium was collected after an additional 24 h and filtered through a 0.45 μM filter prior to transduction. Human PBMCs were activated by ImmunoCult™ Human CD3/CD28/CD2 T Cell Activator (STEMCELL) for 3 days, and then spin-transduced (1500 g) with lentivirus supernatant from 293T cells for 90 min at 30 °C in the presence of 5 μg/ml polybrene. After transduction, the PBMCs were cultured with human IL-2 (10 U/ml) for 2∼3 days before downstream analysis.
Polychromatic imaging cytometry
For Imagestream (Amnis) analysis, CD8+ T cells stained with antibodies as above were sorted. Single stained cells were used as compensation controls. Images were captured at 60× magnification and analysis was performed using IDEAS v6 software (Amnis). The colocalization was calculated based on Bright Detail Similarity score, a log transformed Pearson’s correlation coefficient computed by the Amnis.
Histology and immunostaining of oxidized phospholipids
Tissues were fixed in formalin for 24 hrs, and then dehydrated in 70% EtOH for 24 hrs before further embedding in molten paraffin wax. Paraffin sections were completed at the Tissue Technology Shared Resource at the UCSD Cancer Center. Sections were blocked sequentially by donkey serum and biotin/avidin blocking, and incubated with biotinylated E06 for 12 hrs at 4°C, followed by alkaline phosphatase conjugated avidin for 30 min at RT. The nuclei were stained with hematoxylin. Stained tissue was visualized with NanoZoomer Slide Scanner.
Single-cell RNA sequencing
Sorted cells were partitioned into an emulsion of nanoliter-sized droplets using a 10x Genomics Chromium Single Cell Controller and RNA sequencing libraries were constructed using the Chromium Single Cell 3′ Library & Gel Bead Kit v2 (10X Genomics, Cat# PN-120237). Briefly, droplets containing individual cells, reverse transcription reagents and a gel bead were loaded with poly(dT) primers that include a 16 base cell barcode and a 10 base unique molecular index (UMI). Reverse transcription reactions were engaged to generate barcoded full-length cDNA followed by the disruption of emulsions using the recovery agent and cDNA clean up with DynaBeads MyOne Silane Beads (Thermo Fisher Scientific, Cat# 37002D). Bulk cDNA was amplified, and indexed sequencing libraries were constructed using the reagents from the Chromium Single Cell 3′ v2 Reagent Kit. Libraries were sequenced on NextSeq 500 Sequencing System (Illumina Cambridge).
Single-cell RNA sequencing data processing and analysis
Cell Ranger (version 2.1.1) (from 10x genomics) was used to process Chromium single cell 3′ v2 RNA-seq output files. First, fastq files were generated for the Read1 for cell barcode and UMI and Read2 for transcript applying cellranger mkfastq (with default parameters). Second, the Read2 was aligned to the mouse genome (GRCm38/mm10) with cell ranger count (with default parameters). Further analysis was performed using Seurat package (version 3.1.5) in R (version 3.6.1) (Butler et al., 2018). Before performed analysis, we applied the following filtering step: only genes expressed in 3 or more cells were preserved and cells with less than 200 or more than 3000 unique expressed genes were discarded to exclude low-quality cells or cell doublets. Cells expressing more than 8% reads mapped to mitochondria genes were also discarded to exclude low-quality or dying cells. Gene expression matrix was normalized and natural log-transformed, and highly variable features were identified via standard Seurat workflow (Stuart et al., 2019). Then samples of Cd36+/+ and Cd36−/− TILs were integrated to obtain an expression matrix comprising 14924 genes across 3400 cells (1561 Cd36+/+ TILs, and 1839 Cd36−/− TILs) for the rest of the analysis. Differentially expressed genes were identified using FindMarkers from Seurat package. Boxplots and Violin plots were performed using the combination of Seurat and ggplot.
The analyses of publicly available single-cell RNAseq data (GSE72056) (Tirosh et al., 2016) was performed in Seurat. Only genes expressed in 3 or more cells were preserved and cells with less than 200 or more than 7500 unique expressed genes were discarded. Gene expression matrix was normalized and natural log-transformed, and highly variable features were identified via standard Seurat workflow. Gene expression levels (E) in these data consist of log-normalized count via default Seurat algorithm. The analysis was restricted to PD-1-expressing CD8+ TILs based on the expression of CD3D, CD8A and PDCD1 (E > 0) but not CD4 (E =0). The cells showing no expression of HAVCR2 or CD36 (E=0) were also excluded in the analysis.
Infection and immune cell isolation from liver
For infections of mice, 2 × 10⁵ PFU of the LCMV Armstrong strain were administered intraperitoneally. To generate P14 chimeric mice, 10,000 P14 CD8+ T cells were transferred to B6 mice intravenously one day before LCMV infection. Immune cell isolation from liver was described previously (Philip et al., 2017). Briefly, liver tissue was mechanically disrupted in 100 μM strainers, and the liver homogenate was spun down at 400 g for 5 min at 4 °C. The pellet was resuspended in 5 ml 44% Percoll (Sigma), which was then underlaid with 56% Percoll, spun at 850 g for 20 min at 20°C. The interface was isolated, and spun at 500 g for 10 min at 4 °C. Pellet was lysed with ammonium chloride potassium (ACK) buffer and cells were further processed for downstream applications.
Bulk RNAseq analysis
The transcriptome of naïve P14 CD8+ T cells, P14 CD8+ TCF7+ TIM-3- progenitor-like cells, CD8+ TCF7- TIM-3+ terminally exhausted T cells was downloaded from NCBI GEO (GSE114631) (Siddiqui et al., 2019). The data was processed with the edgeR-Limma Package (Ritchie et al., 2015; Robinson et al., 2010).
Fatty acid oxidation
Fatty acid oxidation (FAO) assay was performed as described previously (Ye et al., 2016). Briefly, equal numbers of sorted CD8+ T cells were plated in 96-well plates supplemented with FAO assay medium (RPMI 1640 medium containing 2% FBS, 10 μM palmitic acid, 1% fatty acid free BSA (Sigma), 500 μM carnitine (Sigma)). Cells were pulsed for 6 hours with 0.5 μCi [9,10-3H(N)]-palmitic acid (Perkinelmer) and the medium was collected to analyze the released 3H2O, formed during cellular oxidation of [3H] palmitate. Briefly, medium was precipitated by 10% trichloroacetic acid (Sigma) and then supernatant was neutralized with 6N NaOH (Sigma) and loaded into ion exchange columns packed with DOWEX 1X2–400 resin (Sigma). The radioactive product was eluted with water and quantitated by liquid scintillation counting.
QUANTIFICATION AND STATISTICAL ANALYSIS
Statistical analyses were performed using the two-tailed, unpaired, Student’s t-test unless otherwise specified . Each point represented a biological replicate and all data were presented as the mean ± SEM. The P values were represented as follows: NS, none-significant, ***P < 0.001, **P < 0.01 and *P < 0.05.
Supplementary Material
KEY RESOURCES TABLE
| REAGENT RESOURCE | SOURCE | IDENTIFIER |
|---|---|---|
| Antibodies | ||
| Brilliant Violet 711™ anti-mouse CD45 | BioLegend | Cat# 103147; RRID: AB_2564383 |
| APC-eFluor® 780 anti-Mouse CD3 | Invitrogen | Cat# 47-0032-82; RRID: AB_1272181 |
| BUV737 anti-mouse CD4 | BD | Cat# 612761; RRID: AB_2870092 |
| BUV395 anti-mouse CD8a | BD | Cat# 563786; RRID: AB_2732919 |
| V500 anti-mouse CD44 | BD | Cat# 560781; RRID: AB_1937328 |
| Brilliant Violet 605 anti-mouse PD-1 | BioLegend | Cat# 135220; RRID: AB_2562616 |
| Brilliant Violet 711 anti-mouse Tim-3 | BioLegend | Cat# 119727 ; RRID: AB_2716208 |
| Brilliant Violet 421anti-mouse CD45.1 | BioLegend | Cat# 110722; RRID: AB_10896425 |
| PerCP-Cy5.5 anti-mouse CD45.2 | BioLegend | Cat# 109828; RRID: AB_893350 |
| Brilliant Violet 421 anti-rat CD90/mouse CD90.1 | BioLegend | Cat# 202529; RRID: AB_2571945 |
| PerCP/Cyanine5.5 anti-mouse CD90.2 | BioLegend | Cat# 105338; RRID: AB_2571945 |
| PE anti-mouse CD36 | BD | Cat# 562702 ; RRID: AB_2737732 |
| APC anti-mouse CD36 | BD | Cat# 562744; RRID: AB_2737763 |
| Brilliant Violet 605 anti-mouse SLAMF6 (Ly-108) | BD | Cat# 745250; RRID: AB_2742834 |
| APC anti-mouse FOXP3 | ThermoFisher | Cat# 77-5775-40; RRID: AB_469981 |
| PE/Cy7 anti-mouse IFN-γ | BioLegend | Cat# 505826; RRID: AB_2295770 |
| PE anti-mouse TNF | BioLegend | Cat# 506306; RRID: AB_315426 |
| FITZ anti-mouse GZMB | BioLegend | Cat# 515403; RRID: AB_2114575 |
| Anti-mouse CD16/32 | BioLegend | Cat# 101302; RRID: AB_312801 |
| PE anti-mouse/human TOX | ThermoFisher | Cat# 12-6502-82; RRID: AB_10855034 |
| PerCP-Cy5.5 anti-human CD3 | BioLegend | Cat# 300430; RRID: AB_893299 |
| BUV395 Mouse Anti-Human CD3 | BD | Cat# 564000; RRID: AB_2744382 |
| Alexa Fluor® 647 anti-human CD4 Antibody | BioLegend | Cat# 344636; RRID: AB_2566032 |
| BV650 Mouse Anti-Human CD4 | BD | Cat# 563876; RRID: AB_2561351 |
| Brilliant Violet 421™ anti-human CD45RA Antibody | BioLegend | Cat# 304130; RRID: AB_10900421 |
| APC/Cyanine7 anti-human CD197 (CCR7) Antibody | BioLegend | Cat# 353212; RRID: AB_10916390 |
| Brilliant Violet 605™ anti-human CD279 (PD-1) Antibody | BioLegend | Cat# 329924; RRID: AB_2563212 |
| PerCP-eFluor 710 anti-human CD279 (PD-1) Antibody | ThermoFisher | Cat# 46-2799-42; RRID: AB_1834415 |
| Brilliant Violet 421™ anti-human CD36 | BioLegend | Cat# 336230; RRID: AB_2814228 |
| FITZ anti-human CD36 | ThermoFisher | Cat# MA1-19771; RRID: AB_1955262 |
| APC anti-human CD8a | ThermoFisher | Cat# 17-0087-42; RRID: AB_1311204 |
| BUV563 Mouse Anti-Human CD8 | BD | Cat# 612914; RRID: AB_2870199 |
| PE-Cy™7 Mouse Anti-Human IFN-γ | BD | Cat# 560924; RRID: AB_2033978 |
| APC anti-human TNF | Invitrogen | Cat# 17-7349-41; RRID: AB_1548821 |
| Phospho-p38 MAPK (Thrl 80/Tyr 182) (D3F9) XP® Rabbit mAb | Cell Signaling | Cat# 4511; RRID: AB_2139682 |
| α-CD36 (Clone CRF D-2717) | (Wang et al., 2020) | NA |
| Buffers, chemicals, Peptides, and Recombinant Proteins | ||
| BODIPY™ 493/503 | ThermoFisher | Cat# D3922 |
| NBD Cholesterol | ThermoFisher | Cat# N1148 |
| BODIPY™ FL C16 | ThermoFisher | Cat# D3821 |
| BODIPY™500/510 C1, C12 | ThermoFisher | Cat# 3823 |
| E06 mAb-biotinylated | Avanti Polar lipids | Cat# 330002 |
| Oxidized LDL Uptake Assay Kit | Cayman Chemical | Cat# 601180 |
| Human DiI High Oxidized Low Density Lipoprotein | Kalenbiomed | Cat# 770262-9 |
| Image-iT™ Lipid Peroxidation Kit | ThermoFisher | Cat# C10445 |
| HCS LipidTOX™ Deep Red Neutral Lipid Stain | ThermoFisher | Cat# H34477 |
| BODIPY™ FL LDL | ThermoFisher | Cat# L3483 |
| penicillin-streptomycin | Invitrogen | Cat# 15140148 |
| G418 Sulfate | Invitrogen | Cat# 10131027 |
| DMEM | GIBCO | Cat# 11965118 |
| DMEM/F-12 | GIBCO | Cat# 11320082 |
| PBS | GIBCO | Cat# 20012-068 |
| RPMI 1640 Medium | GIBCO | Cat# 21875034 |
| Non-essential amino acids | GIBCO | Cat# 11140-035 |
| Fetal bovine serum | Sigma-Aldrich | Cat# F0804 |
| 2-Mercaptoethanol | GIBCO | Cat# 21985023 |
| L-Glutamine | GIBCO | Cat# 25030081 |
| Recombinant Murine IL-2 | PEPROTECH | Cat# 212-12 |
| DnaseI | Sigma | Cat# DN25-5G |
| 10× Permeabilization buffer | Invitrogen | Cat# 00-8333-56 |
| BD Cytofix/Cytoperm | BD | Cat# 554714 |
| eBioscience Foxp3/Transcription factor staining buffer set |
eBioscience | Cat# 00-5523-00 |
| gp (33-41) peptide | GenScript | Cat# RP20091 |
| OVA Peptide (257-264) | GenScript | Cat# RP10610-1 |
| ACK buffer | Thermo | Cat# A1049201 |
| Percoll | GE Healthcare | Cat# 17-0891-01 |
| Collegenase | Sigma-Aldrich | Cat# 11088882001 |
| OxLDL | Kalenbiomed | Cat# 770252-7 |
| LDL | Kalenbiomed | Cat# 770200-4 |
| HDL | Kalenbiomed | Cat# 770300-4 |
| PMA (Phorbol 12-myristate 13-acetate) | Sigma | Cat# P8139-1MG |
| Ionomycin | Sigma | Cat# 10634-MG |
| Brefeldin A | BioLegend | Cat# 420601 |
| α-Tocopherol | Cayman Chemical | Cat# 30776 |
| SB203580 | Cayman Chemical | Cat# 13067 |
| Other resources | ||
| 70 μM cell strainers | Corning Falcon | Cat# 352350 |
| Single Cell 3′ Library & Gel Bead Kit v2 | 10X Genomics | Cat# PN-120237 |
| Amicon Ultra 100K Centrifugal filter | Millipore Sigma | Cat# UFC910024 |
| Experimental Models: Organisms/Strains | ||
| Mouse: C57BL/6J | Jackson | Strain# 027; RRID: IMSR_JAX:000664 |
| Mouse: Cd36−/− | (Coburn et al., 2000) | JAX Strain# 019006 |
| Mouse: Tg(TcrLCMV)327Sdz (P14) | (Pircher et al.,1989) | MGI:2665105 |
| Mouse: 10BiT | (Kaech et al., 2003) | MGI:3767675 |
| Recombinant DNA | ||
| MSCV-Thy1.1 retroviral | This paper | NA |
| vector | ||
| Software and Algorithms | ||
| Flowjo | FlowJo, LLC | https://www.flowjo.com/ |
| R 3.6.1 | CRAN | https://cran.r-project.org/mirrors.html |
| RStudio 1.2 | RStudio | https://rstudio.com/ |
| IDEAS V6 | Aminis | https://www.luminexcorp.com/ |
| Seurat V3 | (Stuart et al., 2019) | https://satijalab.org/seurat/v3.0/ |
| edgeR | (Robinson et al., 2010) | https://bioconductor.org/packages/release/bioc/html/edgeR.html |
| Limma | (Ritchie et al., 2015) | https://www.bioconductor.org/packages/release/bioc/html/limma.html |
Highlights.
The tumor microenvironment is enriched with lipids and oxidized lipids
Dysfunctional CD8+ TILs increase CD36 expression and OxLDL uptake
OxLDL uptake via CD36 inhibits T cell effector functions through lipid peroxidation
GPX4 over-expression promotes CD8 TIL functionality
ACKNOWLEDGEMENT
We thank Dr. Marcus W. Bosenberg for discussion; Dr. Annelise G Snyder for graphical assistance; Dr. Anna-Maria Globig for assistance in RNAseq; Dr. Hubert Tseng for grant application; Drs. Thomas H Mann and Heather M McGee for manuscript review; Dr. Xuchu Que for technical assistance in the preparation of oxidized LDL; C. O’Connor, Lara Boggeman and C. Fitzpatrick at the Salk FACS core; Nasun Hah and Tzu-Wen Wang at the Salk Sequencing core; the UCSD FACS core for cell sorting; Dr. M. Valeria Estrada at UCSD Histology core; and Faye McDonald for administrative assistance. We thank Dr. Yoav Altman from the Sanford Burnham Prebys Flow Cytometry Core, NCI grant P30 CA030199, and the James B. Pendleton Charitable Trust (helped purchase the Amnis) for Amnis analysis. The NGS Core Facility of the Salk Institute is supported with funding from NIH-NCI CCSG: P30 014195, the Chapman Foundation and the Helmsley Charitable Trust. The Razavi Newman Integrative Genomics and Bioinformatics Core is supported by NIH/NGMS R01 GM102491-07, NIH/NCI P30 CA014195-46, NIA/NMG 1RF1AG064049-01, and the Helmsley Trust. The Mass Spectrometry Core of the Salk Institute is supported with funding from NIH-NCI CCSG: P30 014195 and the Helmsley Center for Genomic Medicine. The MS data described here was gathered on a ThermoFisher Q Exactive Hybrid Quadrupole Orbitrap mass spectrometer funded by NIH grant (1S10OD021815-01). Tissue Technology Shared Resource is supported by a National Cancer Institute Cancer Center Support Grant (CCSG Grant P30CA23100). R.Z. is supported by the Parker Institute for Cancer Immunotherapy Bridge Scholar award. X.S. is supported by NIH grant K99HL148504. R.M.E is an investigator of the Howard Hughes Medical Institute and March of Dimes Chair in Molecular and Developmental Biology at the Salk Institute and supported by the NIH (DK057978, HL105278, ES010337), the Cancer Center (CA014195), a NOMIS Foundation Distinguished Scientist and Scholar Award, Lustgarten Foundation, the Don and Lorraine Freeberg Foundation. G.C. is supported by a Helmholtz Young Investigator Award (Helmholtz Gemeinschaft, #VH-NG-1113) and German Research Foundation (Deutsche Forschungsgemeinschaft, #CU375/7-1). This work was supported by NIH (R01CA240909 to S.M.K, R01 CA206483 to S.M.K and B.E., R01 CA206483 supplemental to P.R.M and R01HL148188 to X.S, and J.L.W.), and Melanoma Research Alliance (S.M.K, M.W.B), Genentech Foundation Fellowship (S.X.), and Salk Innovation Grant (S.M.K, R.M.E).
DECLARATION OF INTERESTS
G.C. receives research funding from Bayer AG and Boehringer Ingelheim, but the funding is not relevant to the current study. J.L.W and X.S. are named inventors on patent applications or patents related to the use of oxidation-specific antibodies held by UCSD. R.Z. is inventor on patent applications related to work on GITR, PD-1 and CTLA-4. R.Z. is consultant for Leap Therapeutics and iTEOS. T.M. is a cofounder and holds an equity in IMVAQ Therapeutics. T.M. is a consultant of Immunos Therapeutics, Pfizer and Immunogenesis. T.M. has research support from Bristol-Myers Squibb; Surface Oncology; Kyn Therapeutics; Infinity Pharmaceuticals, Inc.; Peregrine Pharmaceuticals, Inc.; Adaptive Biotechnologies; Leap Therapeutics, Inc.; and Aprea. T.M. has patents on applications related to work on oncolytic viral therapy, alpha virus-based vaccine, neoantigen modeling, CD40, GITR, OX40, PD-1, and CTLA-4. J.D.W. is consultant for: Adaptive Biotech; Amgen; Apricity; Ascentage Pharma; Astellas; AstraZeneca; Bayer; Beigene; Boehringer Ingelheim; Bristol Myers Squibb; Celgene; Chugai; Elucida; Eli Lilly; F Star; Georgiamune; Imvaq; Kyowa Hakko Kirin; Linneaus; Merck Pharmaceuticals; Neon Therapuetics; Polynoma; Psioxus; Recepta; Takara Bio; Trieza; Truvax; Sellas Life Sciences; Serametrix; Surface Oncology; Syndax; Syntalogic, Werewolf Therapeutics. J.D.W. reports grants from: Bristol Myers Squibb; Sephora. J.D.W. has equity in: Tizona Pharmaceuticals; Adaptive Biotechnologies; Imvaq; Beigene; Linneaus; Apricity; Arsenal IO; Georgiamune. J.D.W. is inventor on patent applications related to work on DNA vaccines in companion animals with cancer, assays for suppressive myeloid cells in blood, oncolytic viral therapy, alphavirus-based vaccines, neo-antigen modeling, CD40, GITR, OX40, PD-1 and CTLA-4. All other authors declare no conflict of interest.
INCLUSION AND DIVERSITY
We worked to ensure gender balance and ethnic or other types of diversity in the recruitment of human subjects, to ensure that the study questionnaires were prepared in an inclusive way, to ensure sex balance in the selection of non-human subjects, to ensure diversity in experimental samples through the selection of the cell lines, and to ensure diversity in experimental samples through the selection of the genomic datasets. One or more of the authors of this paper self-identifies as an underrepresented ethnic minority in science. One or more of the authors of this paper received support from a program designed to increase minority representation in science. While citing references scientifically relevant for this work, we also actively worked to promote gender balance in our reference list.
Footnotes
Publisher's Disclaimer: This is a PDF file of an unedited manuscript that has been accepted for publication. As a service to our customers we are providing this early version of the manuscript. The manuscript will undergo copyediting, typesetting, and review of the resulting proof before it is published in its final form. Please note that during the production process errors may be discovered which could affect the content, and all legal disclaimers that apply to the journal pertain.
Reference
- Abumrad N, Harmon C, and Ibrahimi A. (1998). Membrane transport of long-chain fatty acids: evidence for a facilitated process. Journal of lipid research 39, 2309–2318. [PubMed] [Google Scholar]
- Al-Khami AA, Zheng L, Del Valle L, Hossain F, Wyczechowska D, Zabaleta J, Sanchez MD, Dean MJ, Rodriguez PC, and Ochoa AC. (2017). Exogenous lipid uptake induces metabolic and functional reprogramming of tumor-associated myeloid-derived suppressor cells. Oncoimmunology 6, e1344804. [DOI] [PMC free article] [PubMed] [Google Scholar]
- Alfei F, Kanev K, Hofmann M, Wu M, Ghoneim HE, Roelli P, Utzschneider DT, von Hoesslin M, Cullen JG, Fan Y, et al. (2019). TOX reinforces the phenotype and longevity of exhausted T cells in chronic viral infection. Nature 571, 265–269. [DOI] [PubMed] [Google Scholar]
- Binder CJ, Papac-Milicevic N, and Witztum JL. (2016). Innate sensing of oxidation-specific epitopes in health and disease. Nat Rev Immunol 16, 485–497. [DOI] [PMC free article] [PubMed] [Google Scholar]
- Bligh EG, and Dyer WJ. (1959). A rapid method of total lipid extraction and purification. Can J Biochem Physiol 37, 911–917. [DOI] [PubMed] [Google Scholar]
- Boullier A, Bird DA, Chang MK, Dennis EA, Friedman P, Gillotre-Taylor K, Horkko S, Palinski W, Quehenberger O, Shaw P, et al. (2001). Scavenger receptors, oxidized LDL, and atherosclerosis. Ann N Y Acad Sci 947, 214–222; discussion 222–213. [DOI] [PubMed] [Google Scholar]
- Boullier A, Friedman P, Harkewicz R, Hartvigsen K, Green SR, Almazan F, Dennis EA, Steinberg D, Witztum JL, and Quehenberger O. (2005). Phosphocholine as a pattern recognition ligand for CD36. Journal of lipid research 46, 969–976. [DOI] [PubMed] [Google Scholar]
- Brand A, Singer K, Koehl GE, Kolitzus M, Schoenhammer G, Thiel A, Matos C, Bruss C, Klobuch S, Peter K, et al. (2016). LDHA-Associated Lactic Acid Production Blunts Tumor Immunosurveillance by T and NK Cells. Cell metabolism 24, 657–671. [DOI] [PubMed] [Google Scholar]
- Buck MD, Sowell RT, Kaech SM, and Pearce EL. (2017). Metabolic Instruction of Immunity. Cell 169, 570–586. [DOI] [PMC free article] [PubMed] [Google Scholar]
- Butler A, Hoffman P, Smibert P, Papalexi E, and Satija R. (2018). Integrating single-cell transcriptomic data across different conditions, technologies, and species. Nature biotechnology 36, 411–420. [DOI] [PMC free article] [PubMed] [Google Scholar]
- Chang CH, Qiu J, O’Sullivan D, Buck MD, Noguchi T, Curtis JD, Chen QY, Gindin M, Gubin MM, van der Windt GJW, et al. (2015). Metabolic Competition in the Tumor Microenvironment Is a Driver of Cancer Progression. Cell 162, 1229–1241. [DOI] [PMC free article] [PubMed] [Google Scholar]
- Coburn CT, Knapp FF Jr., Febbraio M, Beets AL, Silverstein RL, and Abumrad NA. (2000). Defective uptake and utilization of long chain fatty acids in muscle and adipose tissues of CD36 knockout mice. The Journal of biological chemistry 275, 32523–32529. [DOI] [PubMed] [Google Scholar]
- Cubillos-Ruiz JR, Silberman PC, Rutkowski MR, Chopra S, Perales-Puchalt A, Song M, Zhang S, Bettigole SE, Gupta D, Holcomb K, et al. (2015). ER Stress Sensor XBP1 Controls Anti-tumor Immunity by Disrupting Dendritic Cell Homeostasis. Cell 161, 1527–1538. [DOI] [PMC free article] [PubMed] [Google Scholar]
- Cursiefen C, Maruyama K, Bock F, Saban D, Sadrai Z, Lawler J, Dana R, and Masli S. (2011). Thrombospondin 1 inhibits inflammatory lymphangiogenesis by CD36 ligation on monocytes. J Exp Med 208, 1083–1092. [DOI] [PMC free article] [PubMed] [Google Scholar]
- Di Gioia M, Spreafico R, Springstead JR, Mendelson MM, Joehanes R, Levy D, and Zanoni I. (2020). Endogenous oxidized phospholipids reprogram cellular metabolism and boost hyperinflammation. Nature Immunology 21, 42–53. [DOI] [PMC free article] [PubMed] [Google Scholar]
- Dixon SJ, Lemberg KM, Lamprecht MR, Skouta R, Zaitsev EM, Gleason CE, Patel DN, Bauer AJ, Cantley AM, Yang WS, et al. (2012). Ferroptosis: an iron-dependent form of nonapoptotic cell death. Cell 149, 1060–1072. [DOI] [PMC free article] [PubMed] [Google Scholar]
- Dixon SJ, Patel DN, Welsch M, Skouta R, Lee ED, Hayano M, Thomas AG, Gleason CE, Tatonetti NP, Slusher BS, and Stockwell BR. (2014). Pharmacological inhibition of cystine-glutamate exchange induces endoplasmic reticulum stress and ferroptosis. Elife 3, e02523. [DOI] [PMC free article] [PubMed] [Google Scholar]
- Dixon SJ, and Stockwell BR. (2014). The role of iron and reactive oxygen species in cell death. Nat Chem Biol 10, 9–17. [DOI] [PubMed] [Google Scholar]
- Gurusamy D, Henning AN, Yamamoto TN, Yu Z, Zacharakis N, Krishna S, Kishton RJ, Vodnala SK, Eidizadeh A, Jia L, et al. (2020). Multi-phenotype CRISPR-Cas9 Screen Identifies p38 Kinase as a Target for Adoptive Immunotherapies. Cancer cell 37, 818–833 e819. [DOI] [PMC free article] [PubMed] [Google Scholar]
- Hajri T, and Abumrad NA. (2002). FATTY ACID TRANSPORT ACROSS MEMBRANES: Relevance to Nutrition and Metabolic Pathology. Annual Review of Nutrition 22, 383–415. [DOI] [PubMed] [Google Scholar]
- Hale JS, Otvos B, Sinyuk M, Alvarado AG, Hitomi M, Stoltz K, Wu Q, Flavahan W, Levison B, Johansen ML, et al. (2014). Cancer stem cell-specific scavenger receptor CD36 drives glioblastoma progression. Stem Cells 32, 1746–1758. [DOI] [PMC free article] [PubMed] [Google Scholar]
- Herber DL, Cao W, Nefedova Y, Novitskiy SV, Nagaraj S, Tyurin VA, Corzo A, Cho HI, Celis E, Lennox B, et al. (2010). Lipid accumulation and dendritic cell dysfunction in cancer. Nat Med 16, 880–886. [DOI] [PMC free article] [PubMed] [Google Scholar]
- Ho PC, Bihuniak JD, Macintyre AN, Staron M, Liu X, Amezquita R, Tsui YC, Cui G, Micevic G, Perales JC, et al. (2015). Phosphoenolpyruvate Is a Metabolic Checkpoint of Anti-tumor T Cell Responses. Cell 162, 1217–1228. [DOI] [PMC free article] [PubMed] [Google Scholar]
- Hossain F, Al-Khami AA, Wyczechowska D, Hernandez C, Zheng L, Reiss K, Valle LD, Trillo-Tinoco J, Maj T, Zou W, et al. (2015). Inhibition of Fatty Acid Oxidation Modulates Immunosuppressive Functions of Myeloid-Derived Suppressor Cells and Enhances Cancer Therapies. Cancer Immunol Res 3, 1236–1247. [DOI] [PMC free article] [PubMed] [Google Scholar]
- Im SJ, Hashimoto M, Gerner MY, Lee J, Kissick HT, Burger MC, Shan Q, Hale JS, Lee J, Nasti TH, et al. (2016). Defining CD8+ T cells that provide the proliferative burst after PD-1 therapy. Nature 537, 417–421. [DOI] [PMC free article] [PubMed] [Google Scholar]
- Ingold I, Berndt C, Schmitt S, Doll S, Poschmann G, Buday K, Roveri A, Peng X, Porto Freitas F, Seibt T, et al. (2018). Selenium Utilization by GPX4 Is Required to Prevent Hydroperoxide-Induced Ferroptosis. Cell 172, 409–422.e421. [DOI] [PubMed] [Google Scholar]
- Inoue H, Hisamoto N, An JH, Oliveira RP, Nishida E, Blackwell TK, and Matsumoto K. (2005). The C. elegans p38 MAPK pathway regulates nuclear localization of the transcription factor SKN-1 in oxidative stress response. Genes & development 19, 2278–2283. [DOI] [PMC free article] [PubMed] [Google Scholar]
- Jay AG, Chen AN, Paz MA, Hung JP, and Hamilton JA. (2015). CD36 binds oxidized low density lipoprotein (LDL) in a mechanism dependent upon fatty acid binding. The Journal of biological chemistry 290, 4590–4603. [DOI] [PMC free article] [PubMed] [Google Scholar]
- Jin HT, Anderson AC, Tan WG, West EE, Ha SJ, Araki K, Freeman GJ, Kuchroo VK, and Ahmed R. (2010). Cooperation of Tim-3 and PD-1 in CD8 T-cell exhaustion during chronic viral infection. Proc Natl Acad Sci U S A 107, 14733–14738. [DOI] [PMC free article] [PubMed] [Google Scholar]
- Kaech SM, Tan JT, Wherry EJ, Konieczny BT, Surh CD, and Ahmed R. (2003). Selective expression of the interleukin 7 receptor identifies effector CD8 T cells that give rise to long-lived memory cells. Nat Immunol 4, 1191–1198. [DOI] [PubMed] [Google Scholar]
- Khan O, Giles JR, McDonald S, Manne S, Ngiow SF, Patel KP, Werner MT, Huang AC, Alexander KA, Wu JE, et al. (2019). TOX transcriptionally and epigenetically programs CD8(+) T cell exhaustion. Nature 571, 211–218. [DOI] [PMC free article] [PubMed] [Google Scholar]
- Kita T, Kume N, Yokode M, Ishii K, Arai H, Horiuchi H, Moriwaki H, Minami M, Kataoka H, and Wakatsuki Y. (2000). Oxidized-LDL and atherosclerosis. Role of LOX-1. Ann N Y Acad Sci 902, 95–100; discussion 100–102. [DOI] [PubMed] [Google Scholar]
- Kuda O, Pietka TA, Demianova Z, Kudova E, Cvacka J, Kopecky J, and Abumrad NA. (2013). Sulfo-N-succinimidyl oleate (SSO) inhibits fatty acid uptake and signaling for intracellular calcium via binding CD36 lysine 164: SSO also inhibits oxidized low density lipoprotein uptake by macrophages. The Journal of biological chemistry 288, 15547–15555. [DOI] [PMC free article] [PubMed] [Google Scholar]
- Ma X, Bi E, Lu Y, Su P, Huang C, Liu L, Wang Q, Yang M, Kalady MF, Qian J, et al. (2019). Cholesterol Induces CD8(+) T Cell Exhaustion in the Tumor Microenvironment. Cell metabolism 30, 143–156.e145. [DOI] [PMC free article] [PubMed] [Google Scholar]
- Ma X, Xiao L, Liu L, Ye L, Su P, Bi E, Wang Q, Yang M, Qian J, and Yi Q. (2021). CD36-mediated ferroptosis dampens intratumoral CD8+ T cell effector function and impairs their antitumor ability. Cell metabolism. [DOI] [PMC free article] [PubMed] [Google Scholar]
- MacLean B, Tomazela DM, Shulman N, Chambers M, Finney GL, Frewen B, Kern R, Tabb DL, Liebler DC, and MacCoss MJ. (2010). Skyline: an open source document editor for creating and analyzing targeted proteomics experiments. Bioinformatics 26, 966–968. [DOI] [PMC free article] [PubMed] [Google Scholar]
- Manzo T, Prentice BM, Anderson KG, Raman A, Schalck A, Codreanu GS, Nava Lauson CB, Tiberti S, Raimondi A, Jones MA, et al. (2020). Accumulation of long-chain fatty acids in the tumor microenvironment drives dysfunction in intrapancreatic CD8+ T cells. J Exp Med 217. [DOI] [PMC free article] [PubMed] [Google Scholar]
- Matsushita M, Freigang S, Schneider C, Conrad M, Bornkamm GW, and Kopf M. (2015). T cell lipid peroxidation induces ferroptosis and prevents immunity to infection. J Exp Med 212, 555–568. [DOI] [PMC free article] [PubMed] [Google Scholar]
- Maynard CL, Harrington LE, Janowski KM, Oliver JR, Zindl CL, Rudensky AY, and Weaver CT. (2007). Regulatory T cells expressing interleukin 10 develop from Foxp3+ and Foxp3- precursor cells in the absence of interleukin 10. Nat Immunol 8, 931–941. [DOI] [PubMed] [Google Scholar]
- McClung JM, Judge AR, Powers SK, and Yan Z. (2010). p38 MAPK links oxidative stress to autophagy-related gene expression in cachectic muscle wasting. Am J Physiol Cell Physiol 298, C542–549. [DOI] [PMC free article] [PubMed] [Google Scholar]
- McLane LM, Abdel-Hakeem MS, and Wherry EJ. (2019). CD8 T Cell Exhaustion During Chronic Viral Infection and Cancer. Annual Review of Immunology 37, 457–495. [DOI] [PubMed] [Google Scholar]
- Miller BC, Sen DR, Al Abosy R, Bi K, Virkud YV, LaFleur MW, Yates KB, Lako A, Felt K, Naik GS, et al. (2019). Subsets of exhausted CD8(+) T cells differentially mediate tumor control and respond to checkpoint blockade. Nat Immunol 20, 326–336. [DOI] [PMC free article] [PubMed] [Google Scholar]
- Miller YI, and Shyy JY. (2017). Context-Dependent Role of Oxidized Lipids and Lipoproteins in Inflammation. Trends Endocrinol Metab 28, 143–152. [DOI] [PMC free article] [PubMed] [Google Scholar]
- Mitra S, Goyal T, and Mehta JL. (2011). Oxidized LDL, LOX-1 and atherosclerosis. Cardiovasc Drugs Ther 25, 419–429. [DOI] [PubMed] [Google Scholar]
- Navab M, Ananthramaiah GM, Reddy ST, Van Lenten BJ, Ansell BJ, Fonarow GC, Vahabzadeh K, Hama S, Hough G, Kamranpour N, et al. (2004). The oxidation hypothesis of atherogenesis: the role of oxidized phospholipids and HDL. Journal of lipid research 45, 993–1007. [DOI] [PubMed] [Google Scholar]
- Pacella I, Procaccini C, Focaccetti C, Miacci S, Timperi E, Faicchia D, Severa M, Rizzo F, Coccia EM, Bonacina F, et al. (2018). Fatty acid metabolism complements glycolysis in the selective regulatory T cell expansion during tumor growth. Proc Natl Acad Sci U S A 115, E6546-E6555. [DOI] [PMC free article] [PubMed] [Google Scholar]
- Pan Y, Tian T, Park CO, Lofftus SY, Mei S, Liu X, Luo C, O’Malley JT, Gehad A, Teague JE, et al. (2017). Survival of tissue-resident memory T cells requires exogenous lipid uptake and metabolism. Nature 543, 252–256. [DOI] [PMC free article] [PubMed] [Google Scholar]
- Pascual G, Avgustinova A, Mejetta S, Martin M, Castellanos A, Attolini CSO, Berenguer A, Prats N, Toll A, Hueto JA, et al. (2017). Targeting metastasis-initiating cells through the fatty acid receptor CD36. Nature 541, 41-+. [DOI] [PubMed] [Google Scholar]
- Pepino MY, Kuda O, Samovski D, and Abumrad NA. (2014). Structure-function of CD36 and importance of fatty acid signal transduction in fat metabolism. Annu Rev Nutr 34, 281–303. [DOI] [PMC free article] [PubMed] [Google Scholar]
- Philip M, Fairchild L, Sun L, Horste EL, Camara S, Shakiba M, Scott AC, Viale A, Lauer P, Merghoub T, et al. (2017). Chromatin states define tumour-specific T cell dysfunction and reprogramming. Nature 545, 452–456. [DOI] [PMC free article] [PubMed] [Google Scholar]
- Pircher H, Bürki K, Lang R, Hengartner H, and Zinkernagel RM. (1989). Tolerance induction in double specific T-cell receptor transgenic mice varies with antigen. Nature 342, 559. [DOI] [PubMed] [Google Scholar]
- Platten M, Wick W, and Van den Eynde BJ. (2012). Tryptophan catabolism in cancer: beyond IDO and tryptophan depletion. Cancer research 72, 5435–5440. [DOI] [PubMed] [Google Scholar]
- Prevost-Blondel A, Zimmermann C, Stemmer C, Kulmburg P, Rosenthal FM, and Pircher H. (1998). Tumor-infiltrating lymphocytes exhibiting high ex vivo cytolytic activity fail to prevent murine melanoma tumor growth in vivo. J Immunol 161, 2187–2194. [PubMed] [Google Scholar]
- Que X, Hung MY, Yeang C, Gonen A, Prohaska TA, Sun X, Diehl C, Maatta A, Gaddis DE, Bowden K, et al. (2018). Oxidized phospholipids are proinflammatory and proatherogenic in hypercholesterolaemic mice. Nature 558, 301–306. [DOI] [PMC free article] [PubMed] [Google Scholar]
- Reuter S, Gupta SC, Chaturvedi MM, and Aggarwal BB. (2010). Oxidative stress, inflammation, and cancer: how are they linked? Free radical biology & medicine 49, 1603–1616. [DOI] [PMC free article] [PubMed] [Google Scholar]
- Rincon M, and Pedraza-Alva G. (2003). JNK and p38 MAP kinases in CD4+ and CD8+ T cells. Immunol Rev 192, 131–142. [DOI] [PubMed] [Google Scholar]
- Ritchie ME, Phipson B, Wu D, Hu Y, Law CW, Shi W, and Smyth GK. (2015). limma powers differential expression analyses for RNA-sequencing and microarray studies. Nucleic acids research 43, e47. [DOI] [PMC free article] [PubMed] [Google Scholar]
- Robinson MD, McCarthy DJ, and Smyth GK. (2010). edgeR: a Bioconductor package for differential expression analysis of digital gene expression data. Bioinformatics 26, 139–140. [DOI] [PMC free article] [PubMed] [Google Scholar]
- Schietinger A, Philip M, Krisnawan VE, Chiu EY, Delrow JJ, Basom RS, Lauer P, Brockstedt DG, Knoblaugh SE, Hammerling GJ, et al. (2016). Tumor-Specific T Cell Dysfunction Is a Dynamic Antigen-Driven Differentiation Program Initiated Early during Tumorigenesis. Immunity 45, 389–401. [DOI] [PMC free article] [PubMed] [Google Scholar]
- Scott AC, Dundar F, Zumbo P, Chandran SS, Klebanoff CA, Shakiba M, Trivedi P, Menocal L, Appleby H, Camara S, et al. (2019). TOX is a critical regulator of tumour-specific T cell differentiation. Nature 571, 270–274. [DOI] [PMC free article] [PubMed] [Google Scholar]
- Seimon TA, Nadolski MJ, Liao X, Magallon J, Nguyen M, Feric NT, Koschinsky ML, Harkewicz R, Witztum JL, Tsimikas S, et al. (2010). Atherogenic lipids and lipoproteins trigger CD36-TLR2-dependent apoptosis in macrophages undergoing endoplasmic reticulum stress. Cell metabolism 12, 467–482. [DOI] [PMC free article] [PubMed] [Google Scholar]
- Seo H, Chen J, Gonzalez-Avalos E, Samaniego-Castruita D, Das A, Wang YH, Lopez-Moyado IF, Georges RO, Zhang W, Onodera A, et al. (2019). TOX and TOX2 transcription factors cooperate with NR4A transcription factors to impose CD8(+) T cell exhaustion. Proc Natl Acad Sci U S A 116, 12410–12415. [DOI] [PMC free article] [PubMed] [Google Scholar]
- Shaw PX, Hörkkö S, Chang MK, Curtiss LK, Palinski W, Silverman GJ, and Witztum JL. (2000). Natural antibodies with the T15 idiotype may act in atherosclerosis, apoptotic clearance, and protective immunity. The Journal of clinical investigation 105, 1731–1740. [DOI] [PMC free article] [PubMed] [Google Scholar]
- Siddiqui I, Schaeuble K, Chennupati V, Fuertes Marraco SA, Calderon-Copete S, Pais Ferreira D, Carmona SJ, Scarpellino L, Gfeller D, Pradervand S, et al. (2019). Intratumoral Tcf1(+)PD-1(+)CD8(+) T Cells with Stem-like Properties Promote Tumor Control in Response to Vaccination and Checkpoint Blockade Immunotherapy. Immunity 50, 195–211 e110. [DOI] [PubMed] [Google Scholar]
- Staveley-O’Carroll K, Schell TD, Jimenez M, Mylin LM, Tevethia MJ, Schoenberger SP, and Tevethia SS. (2003). In vivo ligation of CD40 enhances priming against the endogenous tumor antigen and promotes CD8+ T cell effector function in SV40 T antigen transgenic mice. J Immunol 171, 697–707. [DOI] [PubMed] [Google Scholar]
- Stewart CR, Stuart LM, Wilkinson K, van Gils JM, Deng J, Halle A, Rayner KJ, Boyer L, Zhong R, Frazier WA, et al. (2010). CD36 ligands promote sterile inflammation through assembly of a Toll-like receptor 4 and 6 heterodimer. Nature immunology 11, 155–161. [DOI] [PMC free article] [PubMed] [Google Scholar]
- Stockwell BR, Friedmann Angeli JP, Bayir H, Bush AI, Conrad M, Dixon SJ, Fulda S, Gascon S, Hatzios SK, Kagan VE, et al. (2017). Ferroptosis: A Regulated Cell Death Nexus Linking Metabolism, Redox Biology, and Disease. Cell 171, 273–285. [DOI] [PMC free article] [PubMed] [Google Scholar]
- Stuart T, Butler A, Hoffman P, Hafemeister C, Papalexi E, Mauck WM 3rd, Hao Y, Stoeckius M, Smibert P, and Satija R. (2019). Comprehensive Integration of Single-Cell Data. Cell 177, 1888–1902 e1821. [DOI] [PMC free article] [PubMed] [Google Scholar]
- Su P, Wang Q, Bi E, Ma X, Liu L, Yang M, Qian J, and Yi Q. (2020). Enhanced Lipid Accumulation and Metabolism Are Required for the Differentiation and Activation of Tumor-Associated Macrophages. Cancer research 80, 1438–1450. [DOI] [PMC free article] [PubMed] [Google Scholar]
- Sullivan MR, Danai LV, Lewis CA, Chan SH, Gui DY, Kunchok T, Dennstedt EA, Vander Heiden MG, and Muir A. (2019). Quantification of microenvironmental metabolites in murine cancers reveals determinants of tumor nutrient availability. Elife 8. [DOI] [PMC free article] [PubMed] [Google Scholar]
- Sun X, Seidman JS, Zhao P, Troutman TD, Spann NJ, Que X, Zhou F, Liao Z, Pasillas M, Yang X, et al. (2020). Neutralization of Oxidized Phospholipids Ameliorates Non-alcoholic Steatohepatitis. Cell metabolism 31, 189–206.e188. [DOI] [PMC free article] [PubMed] [Google Scholar]
- Tirosh I, Izar B, Prakadan SM, Wadsworth MH, Treacy D, Trombetta JJ, Rotem A, Rodman C, Lian C, Murphy G, et al. (2016). Dissecting the multicellular ecosystem of metastatic melanoma by single-cell RNA-seq. Science 352, 189–196. [DOI] [PMC free article] [PubMed] [Google Scholar]
- Utzschneider DT, Charmoy M, Chennupati V, Pousse L, Ferreira DP, Calderon-Copete S, Danilo M, Alfei F, Hofmann M, Wieland D, et al. (2016). T Cell Factor 1-Expressing Memory-like CD8(+) T Cells Sustain the Immune Response to Chronic Viral Infections. Immunity 45, 415–427. [DOI] [PubMed] [Google Scholar]
- Veglia F, Tyurin VA, Blasi M, De Leo A, Kossenkov AV, Donthireddy L, To TKJ, Schug Z, Basu S, Wang F, et al. (2019). Fatty acid transport protein 2 reprograms neutrophils in cancer. Nature 569, 73–78. [DOI] [PMC free article] [PubMed] [Google Scholar]
- Veglia F, Tyurin VA, Mohammadyani D, Blasi M, Duperret EK, Donthireddy L, Hashimoto A, Kapralov A, Amoscato A, Angelini R, et al. (2017). Lipid bodies containing oxidatively truncated lipids block antigen cross-presentation by dendritic cells in cancer. Nat Commun 8, 2122. [DOI] [PMC free article] [PubMed] [Google Scholar]
- Wang H, Franco F, Tsui YC, Xie X, Trefny MP, Zappasodi R, Mohmood SR, Fernandez-Garcia J, Tsai CH, Schulze I, et al. (2020). CD36-mediated metabolic adaptation supports regulatory T cell survival and function in tumors. Nat Immunol 21, 298–308. [DOI] [PMC free article] [PubMed] [Google Scholar]
- Wang W, Green M, Choi JE, Gijon M, Kennedy PD, Johnson JK, Liao P, Lang X, Kryczek I, Sell A, et al. (2019). CD8(+) T cells regulate tumour ferroptosis during cancer immunotherapy. Nature 569, 270–274. [DOI] [PMC free article] [PubMed] [Google Scholar]
- Wherry EJ, and Kurachi M. (2015). Molecular and cellular insights into T cell exhaustion. Nat Rev Immunol 15, 486–499. [DOI] [PMC free article] [PubMed] [Google Scholar]
- Witztum JL, and Steinberg D. (1991). Role of oxidized low density lipoprotein in atherogenesis. The Journal of clinical investigation 88, 1785–1792. [DOI] [PMC free article] [PubMed] [Google Scholar]
- Yan D, Adeshakin AO, Xu M, Afolabi LO, Zhang G, Chen YH, and Wan X. (2019). Lipid Metabolic Pathways Confer the Immunosuppressive Function of Myeloid-Derived Suppressor Cells in Tumor. Front Immunol 10, 1399. [DOI] [PMC free article] [PubMed] [Google Scholar]
- Yang WS, Kim KJ, Gaschler MM, Patel M, Shchepinov MS, and Stockwell BR. (2016). Peroxidation of polyunsaturated fatty acids by lipoxygenases drives ferroptosis. Proc Natl Acad Sci U S A 113, E4966–4975. [DOI] [PMC free article] [PubMed] [Google Scholar]
- Yang WS, SriRamaratnam R, Welsch ME, Shimada K, Skouta R, Viswanathan VS, Cheah JH, Clemons PA, Shamji AF, Clish CB, et al. (2014). Regulation of ferroptotic cancer cell death by GPX4. Cell 156, 317–331. [DOI] [PMC free article] [PubMed] [Google Scholar]
- Yang WS, and Stockwell BR. (2016). Ferroptosis: Death by Lipid Peroxidation. Trends Cell Biol 26, 165–176. [DOI] [PMC free article] [PubMed] [Google Scholar]
- Ye H, Adane B, Khan N, Sullivan T, Minhajuddin M, Gasparetto M, Stevens B, Pei S, Balys M, Ashton JM, et al. (2016). Leukemic Stem Cells Evade Chemotherapy by Metabolic Adaptation to an Adipose Tissue Niche. Cell Stem Cell 19, 23–37. [DOI] [PMC free article] [PubMed] [Google Scholar]
- Zajac AJ, Blattman JN, Murali-Krishna K, Sourdive DJ, Suresh M, Altman JD, and Ahmed R. (1998). Viral immune evasion due to persistence of activated T cells without effector function. The Journal of experimental medicine 188, 2205–2213. [DOI] [PMC free article] [PubMed] [Google Scholar]
- Zanoni I, Tan Y, Di Gioia M, Broggi A, Ruan J, Shi J, Donado CA, Shao F, Wu H, Springstead JR, and Kagan JC. (2016). An endogenous caspase-11 ligand elicits interleukin-1 release from living dendritic cells. Science 352, 1232. [DOI] [PMC free article] [PubMed] [Google Scholar]
- Zhang Y, Kurupati R, Liu L, Zhou XY, Zhang G, Hudaihed A, Filisio F, Giles-Davis W, Xu X, Karakousis GC, et al. (2017). Enhancing CD8(+) T Cell Fatty Acid Catabolism within a Metabolically Challenging Tumor Microenvironment Increases the Efficacy of Melanoma Immunotherapy. Cancer cell 32, 377–391 e379. [DOI] [PMC free article] [PubMed] [Google Scholar]
Associated Data
This section collects any data citations, data availability statements, or supplementary materials included in this article.
Supplementary Materials
Data Availability Statement
The single-cell RNA sequencing data from this paper are available in the GEO database with the accession code GSE171194.