Abstract
Background:
We investigated the impact of cancer incidence on CHE in Iran by considering spatial variation across provinces as well as temporal trends.
Methods:
Data from Household Income-Expenditure Survey were merged with cancer incidence rates during 2011–2016. We developed a Bayesian hierarchical model to explore the spatial and temporal patterns of CHE and its associated factors at provincial level. We used a Besag-York-Mollie2 prior and a random walk prior for spatial and temporal random effects respectively. All statistical analysis was carried out in R software.
Results:
All-type cancer incidence (OR per SD (95% CrI) = 1.16 (1.02, 1.32)), unemployment rate (1.08 (1.01, 1.15)) and income equity (0.88 (0.81, 0.97)) have important association with CHE. Percentage of urbanization and percentage of poverty were not statistically significant.
Conclusion:
The results suggest the development of new policies to protect cancer patients against financial hardship, narrow the gap in income inequality and solve the problem of high unemployment rate to reduce the level of CHE at provincial level.
Keywords: Catastrophic health expenditures, Cancer incidence, Spatio-temporal model
Introduction
Universal health coverage (UHC), is defined as a state of access to essential healthcare services without financial hardship for all people, regardless of their socioeconomic differences (1). Under the estimates of the WHO, 100 million people each year experience catastrophic health expenditures (CHE) globally and become poor because of healthcare payments (2). Whenever medical spending is above a certain threshold that results in financial hardship, catastrophic payments occur (3). An important duty of healthcare systems is therefore to provide equitable financing for people to protect them from incurring financial hardship due to the treatment of their illness (1).
Incidence of CHE has been reported differently in different studies in Iran ranging from 1.56 to 72.7 (4, 5). This large uncertainty in estimates, largely due to variation in the setting of studies generalizes difficult. Researchers may set the study in a particular geographic area, with specific cultural beliefs, socioeconomic status (6) and considerable geographical variation in health service use (7). Supporting evidence is also available for considerable regional variation of the incidence of CHE (2). On the other hand, non-communicable diseases (NCDs) like cancer are the leading causes of morbidity and mortality worldwide. However, the burden imposed on society by NCDs extends beyond these and will incur CHE on the households (8, 9).
These diseases have a geographical variation too (10, 11). Cancer, as an important part of non-communicable disease, has the highest rank in mean health care expenditure per person among the 5 costliest conditions in the United States (12) and is fourth medical condition from the top ten estimated annual health spending in the US population (13). In Iran, as a developing country, the population aging and cancer risk factors have been increased during the recent decades so that cancer is the third leading cause of death (14). Unfortunately, the consequences of cancer are destructive and the economic well-being of patients may be compromised to such an extent that they may experience CHE or even go bankrupt (15, 16). Several papers have been published on household CHE or the impact of cancer on household CHE across the globe, but little is known about cancer’s economic impact in different geographical regions especially in low-middle income countries. To the best of our knowledge, none of the studies in Iran investigated the spatial or temporal variation in impact of cancer on CHE. We address this gap by conducting spatiotemporal modeling of CHE, relating variation to cancer incidence, impoverishment and some other related factors in Iran.
We aimed to investigate the proportion of CHE in provinces of Iran and explore the possible influence of cancer incidence on CHE, controlling for other potential determinants of CHE.
Methods
In this study, we integrated data from the Household Income and Expenditure Survey (HIES) (17), conducted annually by the Statistical Center of Iran (SCI), with cancer incidence rates, obtained from the Iran Cancer Registry database. HIES is a nationally representative cross-sectional survey, from both rural and urban areas of all provinces of Iran. Data collection is conducted by personal interview with household heads via a questionnaire consisting of 4 sections: household socio-demographic information, major living facilities and supplies, food and non-food expenses, and household income.
We used the third part of the questionnaire to assess whether a household is involved in CHE or not. We included data from 2011 to 2016 from all provinces. The annual sample sizes of households were 38513, 38192, 38316, 38275, 38252, and 38146 respectively. The other covariates including the percentage of urbanization, percentage of poverty and income equity in each province were also calculated. Furthermore, we extracted unemployment rate from SCI (17). We aggregated the percentage of households with CHE, percentage of poverty and percentage of urbanization at the provincial level to prepare the data for the analysis. Data on all-type cancer incidence is obtained from cancer registry data. To address duplicates, incompleteness and missing values of this variable, we used all-type cancer estimates from National and Sub-National Burden of Disease (NASBOD) project in Iran (18). In this project, incidence rates per 100,000 populations were reported at national and provincial levels from 1990 to 2016 in 18 main groups and 70 subgroups of cancers. These estimates are accessible freely through the website (19, 20).
The required data for our study was all-type cancer incidence rates in all provinces of Iran from 2011 to 2016.
Catastrophic health expenditures
We used the method proposed by World Bank to calculate the CHE (21). In this method, a household has suffered CHE when total health expenditures across 12 months’ equals or exceed 20% of annual total household expenditures
Percentage of poverty
The poverty line was considered based on food expenditures. Adjusted food expenditures were obtained by dividing food expenditures by the equivalent household size (calculated as household size to the power of 0.56). Then on the 45 to 55 percentile of the share of food expenditures from total expenditures per household, the average weight of adjusted food expenditures was calculated and considered as the poverty line. Poverty line for each household was calculated by multiplying poverty line of 45th to 55th percentile by equivalent household size (22). If total expenditures of a household were below the estimated poverty line, household was considered poor. Then the percentage of households under the poverty line in each province was calculated.
Income equity
Different methods for measuring income equity have been suggested. We selected one of these, which measures the relative amount of income equity among the highest and lowest income deciles of society (23). The index is defined as the ratio of the mean of the income in first decile to the mean of the income in last decile.
Statistical modeling
Bayesian hierarchical modeling framework with a Binomial response distribution was used. We considered provinces as the areal units. Data were aggregated within each areal unit. For considering the spatial effect, we used Besag-York-Mollie (BYM2) model (24) and for adding temporal correlation, Random Walk2 (RW2) was used. Let yit and nit denote the number of households experiencing CHE and the total number of households in province i (i = 1 … 31) at year t (t = 1 … 6) respectively. We assumed yit follows a Binomial distribution. The model with spatial and temporal variation is as follows:
where πit is the proportion of households with CHE in area i at time t, X is the matrix of covariates, (θi + φi) are structured and unstructured spatial random effects, (γt + υt) are structured and unstructured temporal random effects and δit denotes the space-time interaction random effect to account for any residual spatio-temporal variation that was not captured by the spatial or temporal main effects (25). We fitted models with four different types of interactions and compared with Deviance Information Criterion (DIC) and Watanabe-Akaike Information Criterion (WAIC), with lower values of both indicating better fit. The best model in terms of DIC and WAIC, considered interaction as a conditional autoregressive structure on the provinces for each year independently from all the other years. The results of model comparison are in Supplementary material, part B.
The covariates included all-type cancer incidence rates, percentage of urbanization, unemployment rate, percentage of poverty and ratio of income equity. To avoid multi-collinearity, we standardized all covariates. We used diffuse priors for the model parameters.
Parameter estimation was implemented using Integrated Nested Laplace Approximation (INLA) in the INLA package in R statistical software (ver. 3.6.1).
Results
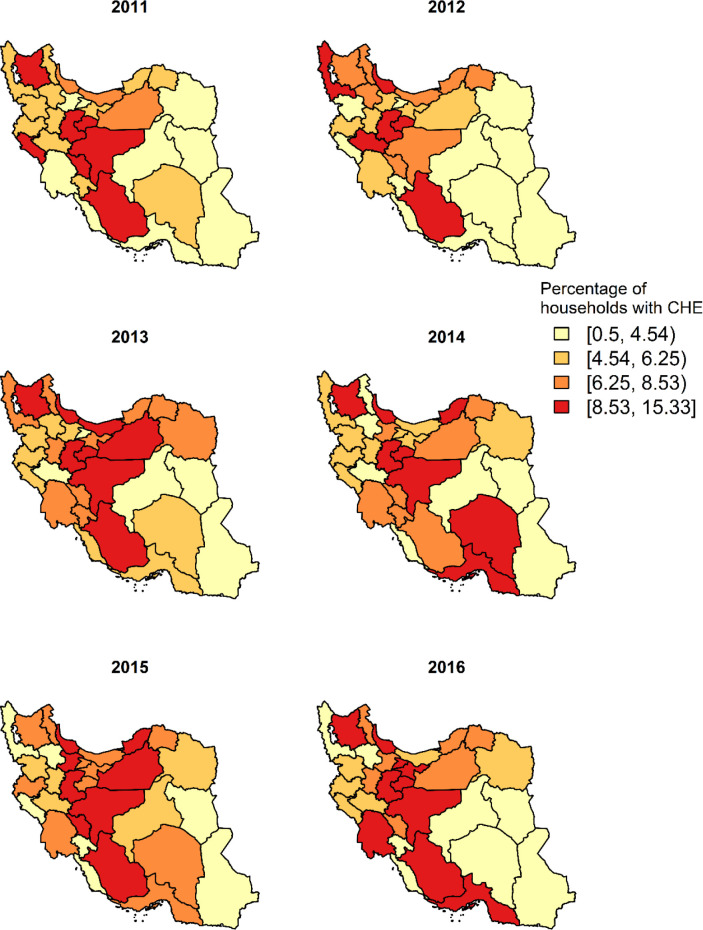
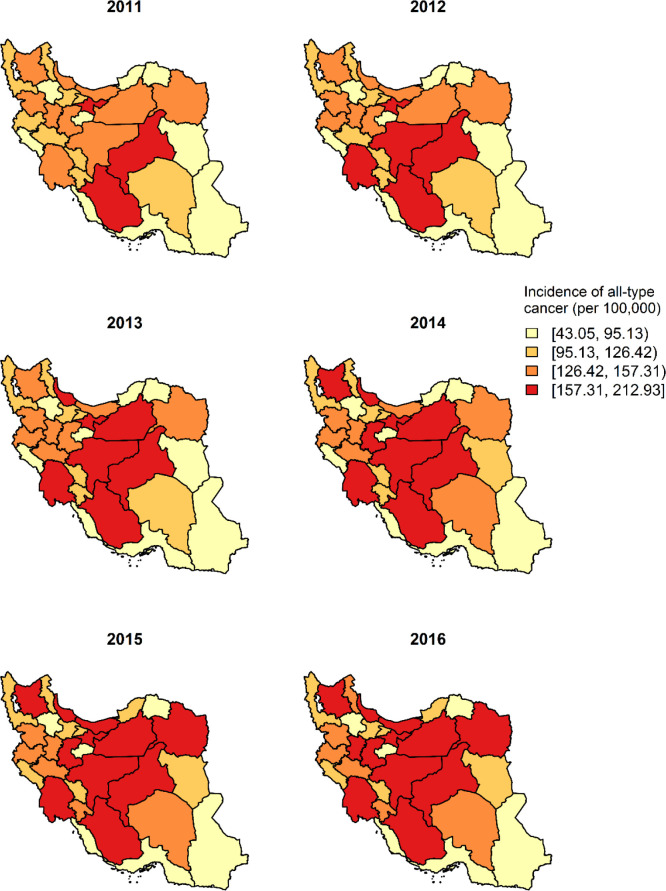
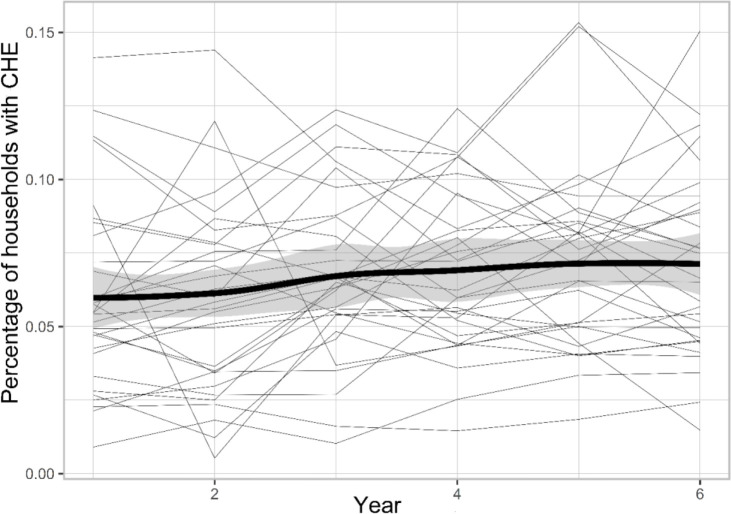
Annual national percentages of households with CHE from 2011–2016 were 6.1%, 6.2%, 6.8%, 7.2%, 7.5% and 7.5% respectively. The percentage of households with CHE observed at the province level are depicted in Fig. 1. The map shows regional variation suggesting the existence of spatial and temporal dependence structures in the observed data. The spatial distribution has revealed that the proportion of households with CHE was higher in the central western provinces and lower in the eastern provinces. On the other hand, according to Fig. 2, the incidence of all-type cancer was higher in the central provinces during the years 2011–2016. The spatial maps of unemployment rate, income equity, percentage of poverty and percentage of urbanization are presented in the Supplementary material, part C. In general, the unemployment rate and income equity were both higher in the central and western parts of the country. However, the proportion of poor households was higher in the southeast of the country. Figure 3 shows the evolution of the observed proportion of CHE during 2011 to 2016 in each of the 31 provinces. The bold line is smooth represents the average proportion of CHE across provinces with a very slight increase during the study period. The highlighted area shows the confidence interval.
Fig. 1:
The proportion of households with CHE during 2011–2016
Fig. 2:
Incidence rate of all-type cancer (per 100,000) during 2011–2016
Fig. 3:
Temporal trend of the proportion of households with CHE in Iran from 2011 to 2016
Identifying spatial autocorrelation
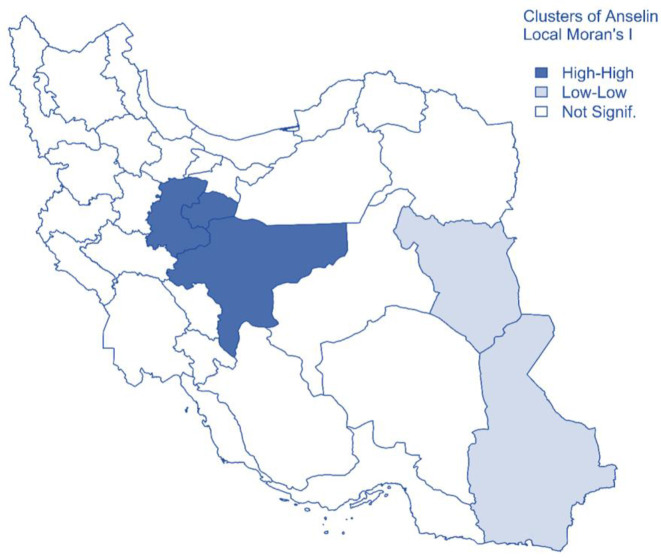
We employed Anselin Local Moran’s I of spatial association to identify the hotspots and coldspots of CHE. The theory behind this statistic is in the supplementary material, part D. The statistics identified two clusters based on data from 2011 to 2016. Central provinces including Isfahan, Qom and Markazi were identified as High-High cluster, which means their neighboring provinces, also had a high percentage of CHE. South-Khorasan and Sistan-Baluchistan provinces were identified as Low-Low cluster, which means their neighboring provinces also had a low percentage of CHE. Other provinces showed no significant difference based on Local Moran’s I test (Fig. 4).
Fig. 4:
Clusters of CHE in Iran from 2011 to 2016 using Anselin Local Moran’s I statistics
Spatiotemporal model
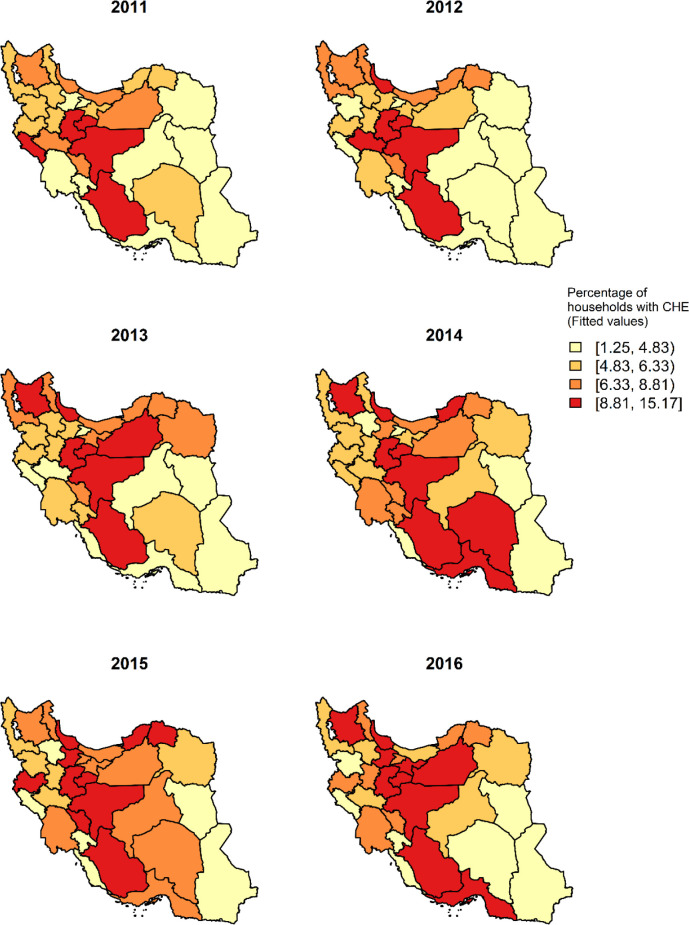
Since all the covariates are standardized, we interpret the amount of Odds Ratios (ORs) based on one standard deviation (SD) increase in the covariates. Based on the results of the model in Table 1, an increase of 0.06 (one SD) in the incidence of cancer, is associated with an increase of around 16% (OR=1.16, 95% Credible Interval (CrI): (1.02, 1.32)) in the odds of CHE at provincial level. An increase in unemployment rate by one SD (0.03) is associated with an increase of 8% (1.08, (1.01, 1.15)) in the odds of CHE. The ratio of income equity (first/last) has a statistically significant effect on the odds of CHE so that one SD (0.04) increase in income equity would decrease the odds of CHE by 12% (0.88, (0.81, 0.97)). Moreover, with increasing poverty by one SD, odds of CHE will increase by 3% and with increasing urbanization by one SD, odds of CHE will increase by 8%. These last two factors were not statistically significant. Furthermore, we presented the maps for the estimated values of CHE based on the model in Fig. 5. Maps in both Fig. 1 (observed values) and 5 (fitted values) are very close to each other, so we can say that the spatial pattern is well remodeled using the model.
Table 1:
Estimated posterior mean, Odds Ratio (OR), and 95% Credible Interval (CrI) of the spatio-temporal binomial model
| Variables † | Coefficient (95% CrI) | SD | OR (95% CrI) |
|---|---|---|---|
| Incidence of cancer (per 100,000) | 0.15 (0.02, 0.28) * | 0.06 | 1.16 (1.02, 1.32) * |
| Unemployment rate | 0.07 (0.01, 0.14) * | 0.03 | 1.08 (1.01, 1.15) * |
| Ratio of income equity (first/last) | −0.12 (−0.21, −0.03) * | 0.04 | 0.88 (0.81, 0.97) * |
| Percentage of poverty | 0.03 (−0.08, 0.14) | 0.05 | 1.03 (0.92, 1.15) |
| Percentage of urbanization | 0.08 (−0.06, 0.23) | 0.07 | 1.08 (0.94, 1.25) |
Variables are standardized
Significant at 0.05
SD: Standard deviation
Fig. 5:
Estimated posterior mean of CHE using the model, from 2011 to 2016
Discussion
Catastrophic expenditure is an undeniable challenge for any country regardless of level of its development. This challenge is much higher in middle-income countries, countries in transition, and in several low-income countries (26). In Iran, large variations in the percentage of catastrophic expenditures in health care have been reported, largely dependent on the setting of the studies (4, 5), which makes it difficult to generalize to a national level. In our study, we used a Bayesian hierarchical spatio-temporal analysis, an ecological approach to investigate the pattern of CHE in Iran and the factors affecting it at provincial level. Moreover, we drew spatial and temporal maps of CHE and other covariates. Moreover, the maps for posterior mean of CHE estimated by the model are presented, which confirm that the spatial pattern reconstructed by the model is very close to the observed values.
Based on the spatial maps, geographical distribution of CHE varies across years, which is an empirical proof of the need for such an analysis. The proportion of households incurring CHE almost in all years is higher in the middle columnar strip of the country and it is consistent with a published paper, which estimated the CHE for all provinces in 2014 but based on WHO formula, with different thresholds (22). We expected to see higher proportion of CHE in less developed border provinces, not in central regions. Likely, reduced access to health facilities and higher poverty in border provinces can be one of the main reasons because CHE is not just determined by the out-of-pocket payments, but rather the poverty and health-service access and use (27).
Generally, the proportion of households with CHE during the study years has increased with a very gentle slope, with large variation across regions. This is in accord with other studies at country level, in which the trend was upward but with a steeper slope (26, 28). Maybe because our setting is at provincial level, unlike other studies that are at country level. Moreover, we considered the CHE with the World Bank formula, based on total household expenditure, while most of the other studies estimated CHE based on household’s capacity to pay (WHO formula with different thresholds). Incidence of all-type cancer is importantly associated with CHE in our study. In other words, with increasing the incidence of cancer in any province, the proportion of households experiencing CHE would increase too. A recent study on end-of-life cancer patients in China found that most cancer patients experience severe CHE (29). Other studies at household level had been reported that cancer diagnosis can result in CHE, and due to the economic burden of treatment or side effects, patients may not be able to continue working further, thus reducing their household income (30). Spatial and temporal pattern of incidence of all-type cancer (per 100,000) showed higher prevalence in the middle columnar strip of the country similar to the proportion of CHE.
The important relationship between unemployment rate and CHE shows that with increasing the unemployment rate, the proportion of households incurring CHE will also increase. In a recently published systematic review in low- to high-income countries, to identify the key determinants of CHE among households, out of 17 papers, 11 found that an unemployed head of household is a risk factor for CHE (2). In addition, in Iran, households with at least one unemployed person (whether head of the household or not) was an important risk factor for CHE (31). There are no studies at provincial level for the relationship between unemployment rate and CHE.
As we expected, income equity was another important predictor of CHE in our study, which is also consistent with some studies (29). However, in some other studies using the concentration index for calculating income equity, the relationship was not statistically significant (28). Our results show that being in a province with high-income equity can significantly decrease the risk of facing CHE.
According to our results, the probability of CHE is not significantly related to poverty when other variables are accounted for. However, different papers in both developing and developed countries have confirmed the effect of the households’ economic status on facing CHE (29, 32). Kien et al studied impoverishment associated with NCD and found that poor households were at higher risk of experiencing CHE (32). The difference in results could be due to poverty being associated with other factors in this model that are better predictors. In addition, free services provided by public primary care facilities, low copayment in state-own hospitals, and eliminated or reduced copayments for receiving treatment for specific diseases also are factors that help poor households to have less out of pocket payment for health care and as a result less exposed to CHE in Iran (33). Percentage of urbanization also did not have a statistically significant effect on CHE.
In Sistan-Baluchistan, a southeastern province of Iran, the proportion of CHE is low but the poverty is high. Besides, this province has a lower percentage of urbanization in samples of HIES for all 6 years of the study.
Perhaps the reason for high poverty in this area is a reduced percentage of urbanization. In a study in India, to compare poverty rate due to CHE in different states, a lower proportion of poverty attributed to CHE was in states with a higher percentage of poor households, low literacy level and limited access to health services (34). Less developed provinces such as Sistan-Baluchistan, have less access to and are hence less likely to utilize health services, so the CHE is low. This point has already been shown in research by Dunlop et al.(35). Hence, many people refuse to accept healthcare services due to their inability to pay (36). Studies of radiation usage patterns have also shown that using radiotherapy to treat breast cancer is less likely for patients with low economic status (37).
In terms of study limitations, as with other household surveys, all information about income and expenditures are self-reported by households’ members so the results may be influenced by recall bias. Moreover, whether households are poor is calculated based on their current costs, not their savings and wealth. This could overestimate the proportion of poor households in society.
Conclusion
The crucial finding of this study is that incidence of cancer plays an important role in the proportion of CHE in provinces of Iran. Provinces with a high unemployment rate or low-income equity are at higher risk of households being exposed to CHE consequently. The findings of this study suggest the development of new policies to protect patients with costly diseases like cancers against financial hardship, narrow the gap in income inequality and solve the problem of high unemployment rate to reduce the level of CHE in the country.
Ethical considerations
Ethical issues (Including plagiarism, informed consent, misconduct, data fabrication and/or falsification, double publication and/or submission, redundancy, etc.) have been completely observed by the authors.
Acknowledgements
The authors would like to thank Dr. Ali Akbar Rasekhi for help and advice. The present research was a part of research towards a Ph.D. degree in Biostatistics at the School of Public Health, TUMS.
This research did not receive any grant from funding agencies in the public, commercial, or not-for-profit sectors.
Footnotes
Conflict of interest
The authors declare no conflict of interest.
References
- 1.Organization WH (2000). The world health report 2000: health systems: improving performance. ed. World Health Organization. [Google Scholar]
- 2.Azzani M, Roslani AC, Su TT. (2019). Determinants of Household Catastrophic Health Expenditure: A Systematic Review. Malays J Med Sci, 26 (1): 15–43. [DOI] [PMC free article] [PubMed] [Google Scholar]
- 3.Niëns L, Van de Poel E, Cameron A, et al. (2012). Practical measurement of affordability: an application to medicines. Bull World Health Organ, 90 (3): 219–227. [DOI] [PMC free article] [PubMed] [Google Scholar]
- 4.Piroozi B, Zarei B, Ghaderi B, et al. (2019). Catastrophic health expenditure and its determinants in households with gastrointestinal cancer patients: evidence from new health system reform in Iran. International Journal of Human Rights in Healthcare, 12 (4):249–257. [Google Scholar]
- 5.Masaeli A, Sadeghih H, Ghanbari A. (2011). High health costs, financial catastrophic and impoverishment expenditures: concepts for policy formation. HEALTH INFORMATION MANAGEMENT, 12: 244 To 254. [Google Scholar]
- 6.Aryankhesal A, Etemadi M, Mohseni M, Azami-Aghdash S, Nakhaei M. (2018). Catastrophic health expenditure in Iran: a review article. Iran J Public Health, 47:166. [PMC free article] [PubMed] [Google Scholar]
- 7.Neelon B, Chang HH, Ling Q, et al. (2016). Spatiotemporal hurdle models for zero-inflated count data: exploring trends in emergency department visits. Stat Methods Med Res, 25 (6):2558–2576. [DOI] [PubMed] [Google Scholar]
- 8.Alwan A. (2011). Global status report on noncommunicable diseases 2010. ed. World Health Organization. [Google Scholar]
- 9.Bloom DE, Chisholm D, Jané-Llopis E, et al. (2011). From Burden to “Best Buys”: Reducing the Economic Impact of Non-Communicable Diseases. [Google Scholar]
- 10.Sun X, Liabsuetrakul T, Xie X, et al. (2019). Catastrophic health expenditure and impoverishment for type 2 diabetes mellitus patients in a multiethnic province in China using a Blinder–Oaxaca decomposition: A cross-sectional study. Medicine (Baltimore), 98 (39):e17376. [DOI] [PMC free article] [PubMed] [Google Scholar]
- 11.Group AS. (2015). Catastrophic health expenditure and 12-month mortality associated with cancer in Southeast Asia: results from a longitudinal study in eight countries. BMC Medicine, 13:190. [DOI] [PMC free article] [PubMed] [Google Scholar]
- 12.Soni A. (2009). The five most costly conditions, 1996 and 2006: Estimates for the US civilian noninstitutionalized population. Statistical Brief# 248. July 2009. Rockville, MD: Agency for Healthcare Research and Quality. [Google Scholar]
- 13.Roehrig C. (2016). Mental disorders top the list of the most costly conditions in the United States: $201 billion. Health Aff (Millwood), 35 (6):1130–5. [DOI] [PubMed] [Google Scholar]
- 14.Mousavi SM, Gouya MM, Ramazani R, et al. (2009). Cancer incidence and mortality in Iran. Ann Oncol, 20 (3):556–63. [DOI] [PubMed] [Google Scholar]
- 15.USA Today KFF, Harvard School of Public Health (2006). Toplines: National survey of households affected by cancer. [Google Scholar]
- 16.Ramsey S, Blough D, Kirchhoff A, et al. (2013). Washington State cancer patients found to be at greater risk for bankruptcy than people without a cancer diagnosis. Health Aff (Millwood), 32 (6):1143–52. [DOI] [PMC free article] [PubMed] [Google Scholar]
- 17.Iran SCo Household, Expenditure and Income. Statistical Center of Iran,
- 18.Parsaeian M, Farzadfar F, Zeraati H, et al. (2014). Application of spatio-temporal model to estimate burden of diseases, injuries and risk factors in Iran 1990–2013. Arch Iran Med, 17 (1):28–33. [PubMed] [Google Scholar]
- 19.(1990–2016) Data visualization, Cancer. Non-Communicable Diseases Research Center, Endocrinology and Metabolism Research Institute, Tehran University of Medical Sciences, [Google Scholar]
- 20.Sardari F. (2019). National and subnational pattern of cancers incidence in Islamic republic of Iran from 1990 to 2016. Non-Communicable Diseases Research Center, Endocrinology and Metabolism Research Institute, Tehran University of Medical Sciences, [Google Scholar]
- 21.Van Lerberghe W. (2008). The world health report 2008: primary health care: now more than ever. ed. World Health Organization. [Google Scholar]
- 22.Ghiasvand H, Gorji HA, Maleki M, et al. (2015). Catastrophic health expenditure among Iranian rural and urban households, 2013–2014. Iran Red Crescent Med J, 17 (9):e30974. [DOI] [PMC free article] [PubMed] [Google Scholar]
- 23.Raghfar H, Ebrahimi A. (2008). Income inequality in Iran during 1984–2006. Social Welfare Quarterly, 7 (28): 9–34. [Google Scholar]
- 24.Riebler A, Sørbye SH, Simpson D, et al. (2016). An intuitive Bayesian spatial model for disease mapping that accounts for scaling. Stat Methods Med Res, 25:1145–1165. [DOI] [PubMed] [Google Scholar]
- 25.Blangiardo M, Cameletti M. (2015). Spatial and spatio-temporal Bayesian models with RINLA. ed. John Wiley & Sons. [Google Scholar]
- 26.Khodamoradi A, Ghaffari S, Fazaeli AA, et al. (2019). Measuring Equity in Iranian Healthcare System Financing: Experiences of Recent Health Reform Plan. Evidence Based Health Policy, Management and Economics, 3 (2):87–95. [Google Scholar]
- 27.Xu K, Evans DB, Kawabata K, Zeramdini R, et al. (2003). Household catastrophic health expenditure: a multicountry analysis. Lancet, 362 (9378):111–7. [DOI] [PubMed] [Google Scholar]
- 28.Yazdi-Feyzabadi V, Mehrolhassani MH, Darvishi A. (2019). Measuring Catastrophic Health Expenditures and its Inequality: Evidence from Iran’s Health Transformation Program. Health Policy Plan, 34:316–325. [DOI] [PubMed] [Google Scholar]
- 29.Leng A, Jing J, Nicholas S, Wang J. (2019). Catastrophic health expenditure of cancer patients at the end-of-life: a retrospective observational study in China. BMC Palliat Care, 18 (1):43. [DOI] [PMC free article] [PubMed] [Google Scholar]
- 30.Bona K, Dussel V, Orellana L, Kang T, et al. (2014). Economic impact of advanced pediatric cancer on families. J Pain Symptom Manage, 47 (3):594–603. [DOI] [PMC free article] [PubMed] [Google Scholar]
- 31.Fazaeli AA, Ghaderi H, Fazaeli AA, Lotfi F, et al. (2015). Main determinants of catastrophic health expenditures: a Bayesian logit approach on Iranian household survey data (2010). Glob J Health Sci, 7 (4):335–40. [DOI] [PMC free article] [PubMed] [Google Scholar]
- 32.Kien VD, Van Minh H, Giang KB, et al. (2016). Socioeconomic inequalities in catastrophic health expenditure and impoverishment associated with noncommunicable diseases in urban Hanoi, Vietnam. International Journal for Equity in Health volume, 15:169. [DOI] [PMC free article] [PubMed] [Google Scholar]
- 33.Ahmadnezhad E, Murphy A, Alvandi R, et al. (2019). The impact of health reform in Iran on catastrophic health expenditures: Equity and policy implications. Int J Health Plann Manage, 34 (4):e1833–e1845. [DOI] [PubMed] [Google Scholar]
- 34.Berman P, Ahuja R, Bhandari L. (2010). The impoverishing effect of healthcare payments in India: new methodology and findings. Economic and Political Weekly, 65–71. [Google Scholar]
- 35.Dunlop S, Coyte PC, McIsaac W. (2000). Socio-economic status and the utilisation of physicians’ services: results from the Canadian National Population Health Survey. Soc Sci Med, 51 (1):123–33. [DOI] [PubMed] [Google Scholar]
- 36.Organization WH (2015). Tracking universal health coverage: first global monitoring report. ed. World Health Organization. [Google Scholar]
- 37.Holowaty E. (1998). Radiotherapy for breast cancer in Ontario: rate variation associated with region, age and income. Clin Invest Med, 21 (3):125–34. [PubMed] [Google Scholar]


