Abstract
Background
Nomogram can be used to accurately predict the prognosis of patients and guide treatment according to the individual situation of patients. This study is to investigate the independent prognostic factors for multi-organ metastases in gastric cancer (GC) patients, and construct and validate prognostic nomograms for overall survival (OS) and cancer-specific survival (CSS).
Methods
The clinical data of GC patients with multi-organ metastases from 2010 to 2018 were extracted from the Surveillance, Epidemiology, and End Results (SEER) database. The independent prognostic factors affecting the OS and CSS of the patients were screened using univariate and multivariate Cox’s proportional hazards model and the Fine-Gray competing risk model. Corresponding nomogram models were constructed to predict the OS and CSS of the patients. The reliability and accuracy of the prediction model were evaluated by consistency index (C-index), area under receiver operating characteristic (ROC) curve (AUC) and calibration curve.
Results
A total of 1,386 patients were included and randomly divided into a training group (972 cases) and a validation group (414 cases) in a 7:3 ratio. Cox proportional hazards analysis showed that age [P<0.001, hazard ratio (HR) =1.29 (1.11–1.49)], race (P=0.018, HR =0.79 (0.65–0.96)], metastases [P=0.036, HR =1.96 (1.05–3.67)], tumor size [P=0.045, HR =1.35 (1.01–1.82)], degree of differentiation [P=0.002, HR =1.99 (1.30–3.06)] and metastasis surgery (P=0.005, HR =0.52 (0.33–0.82)] were independent prognostic factors for OS in GC patients with multi-organ metastases. The Fine-Gray competing risk analysis showed that age [P=0.006, HR =1.23 (1.06–1.42)], histological type [P=0.037, HR =1.53 (1.03–2.27)], metastases [P=0.009, HR =2.02 (1.19–3.41)], tumor size [P=0.028, HR =1.33 (1.03–1.70)], degree of differentiation [P=0.009, HR =1.65 (1.13–2.40)] and metastasis surgery [P=0.001, HR =0.50 (0.32–0.76)] were independent prognostic factors for CSS in GC patients with multi-organ metastases. The above factors were used to construct nomogram models for predicting OS and CSS. Both C-index and AUC of the training group and the validation group showed that the models had an acceptable predictive performance. The calibration curve showed that the predicted and ideal curves fit well, indicating that the constructed models were well-calibrated.
Conclusions
Using data from the SEER database, this study established and validated nomogram models for OS and CSS in GC patients with multi-organ metastases, to help clinicians formulate accurate and individualized treatment plans.
Keywords: Gastric cancer (GC); multi-organ metastases; Surveillance, Epidemiology, and End Results (SEER); prognosis; nomogram
Introduction
Gastric cancer (GC) is one of the most common malignancies of the digestive system worldwide and was responsible for more than one million new cases and approximately 783,000 deaths in 2018 (1,2). It has high rates of fatality, recurrence, and distant metastasis (3). Due to its atypical early symptoms, most patients are already at an advanced stage when first diagnosed (4), and advanced GC patients are prone to distant metastases, where treatment options are limited. Several studies have shown that approximately 40% of newly diagnosed GC patients have synchronized distant metastases at the time of initial diagnosis (5,6). A recent study showed that compared with T1N+M1 GC patients, superficial GC patients with distant metastases without lymph node metastases had a worse prognosis because of more aggressive behaviors (7). The most common distant metastatic organs of GC are liver, lung and brain, etc. GC patients with multi-organ metastases have a lower survival rate and a worse prognosis, with a median survival time of only 6 months, which brings a huge burden to the family and society (8-10). Some previous studies showed that age, gender, race, primary tumor site, histological type, grade, T stage and N stage were prognostic factors for GC patients with distant metastases (11,12). To date, researchers have yet to explore the prognostic factors in GC patients with multi-organ metastases, so this study has clinical value, which can help improve the survival rate of patients and reduce the mortality rate (13).
A nomogram is a model that predicts the probability of a patient’s clinical events based on multivariate regression analysis, which can quickly and intuitively predict the prognosis of patients, and is widely used in tumor-related research (14). A key advantage of nomograms is their ability to estimate personalized risk based on patient and disease characteristics (15). By establishing a direct evaluation system, the predictive nomogram may also help patients and physicians make the optimal decisions for disease management (16). These nomograms will be part of the Cancer Survival Query System, a resource for clinicians and patients. The Surveillance, Epidemiology, and End Results (SEER) database registered by the National Cancer Institute is a recognized resource for information about the survival of cancer patients. The SEER website provides information including survival statistics divided by race, age, gender, disease stage and cancer site.
Currently, there has been published nomogram models for the prognosis of GC based on SEER (17), but researchers have not yet constructed a prognostic model for GC patients with multi-organ metastases. Therefore, in this study, we used the data extracted from SEER database to investigate prognostic factors of GC patients with multi-organ metastasis. Then we established a survival prediction model for such patients, to provide clinicians with a practical individualized prediction tool to optimize treatment plans and improve patient prognosis. As far as we know, this is the first predictive model to explore the prognosis of GC patients with multi-organ metastatic. We present the following article in accordance with the TRIPOD reporting checklist (available at https://tcr.amegroups.com/article/view/10.21037/tcr-21-2569/coif).
Methods
Data source
This study analyzed data obtained from searching the SEER database {SEER Research Data, 18 Registries, Nov 2020 Sub [2000–2018]}. All the data were downloaded using SEER*Stat 8.3.9 software (www.seer.cancer.gov). Data released by the SEER database has been granted patients’ informed consent and is freely available, so an ethical review and obtainment of informed consent were not required. The study was conducted in accordance with the Declaration of Helsinki (as revised in 2013).
Inclusion and exclusion criteria
The inclusion criteria for our study were as follows: (I) patients diagnosed with GC between 2010 and 2018, inclusive; (II) age over 18 years; (III) pathological or imaging diagnosis of multi-organ metastasis (the SEER database only contains information about liver, lung, bone and brain metastases, so this study defined multi-organ metastasis as two or more metastases from those particular organs); (IV) a single primary tumor; (V) patient records clearly showing survival time and survival status. The exclusion criteria were as follows: (I) incomplete clinical or pathological data, such as age, race, histological grade, T stage, and surgical status; (II) patients diagnosed with multiple primary cancers; (III) metastases outside the liver, lung, bone, or brain, such as peritoneal metastasis or distant lymph node metastasis; (IV) a single metastatic site. After being screened according to these inclusion and exclusion criteria, the qualifying patients were randomly divided into a training group (n=972) and a validation group (n=414).
Factors included in the analysis
The research factors included in the analysis included age, gender, race, primary site, histological type, number of lymph nodes detected, metastases, tumor size, degree of differentiation, T stage, N stage, primary tumor surgery, metastasis surgery, survival time, survival status, and cause of death. Age was changed from a continuous variable to a categorical variable using X-tile software and divided into 2 groups: <70 and ≥70 years. Tumors were also classified into 2 size-related groups: <90 and ≥90 mm. Information about tumor size was drawn from the pathology report, operative report, imaging/radiographic techniques, and physical examination. The race parameter included black, white, and other races (American Indian/AK Native and Asian/Pacific Islander). The degree of tumor differentiation was divided into 4 groups, or grades, by the SEER database: well-differentiated (grade I), moderately differentiated (grade II), poorly differentiated (grade III), and undifferentiated (grade IV). We combined poorly differentiated and undifferentiated tumors into a single group (“grade III or IV”). Following the seventh and eighth edition of the American Joint Committee on Cancer (AJCC) guidelines, T stages were divided into T0–1, T2, T3, T4, and TX, and N stages were divided into N0, N1, N2, N3, and NX. The most common histological type of GC is adenocarcinoma; mucinous adenocarcinoma and signet-ring cell carcinoma are the most malignant, yet clinically common. Therefore, we divided the histological types into 4 groups, following the third edition of the International Classification of Diseases for Oncology (ICD-O-3): adenocarcinoma, mucinous adenocarcinoma, signet-ring cell carcinoma, and other types. The primary site code for the stomach (C16.0–C16.9) was based on the ICD-O-3 code. As only liver, lung, bone, and brain metastases are included in the SEER database, we classified the metastases into 11 groups according to the various combinations of 2 or more organs. Primary and metastasis surgeries were categorized as having been performed (yes) or not performed (no). Our main observation indicators were overall survival (OS) and cancer-specific survival (CSS). In this study, the most recent patient information was released in December 2018. Therefore, OS was defined as the number of months from GC diagnosis to either death from any cause or the end of follow-up (31 December, 2018). We defined CSS as the time from GC diagnosis to death from GC. The follow-up time for this study was 107 months.
Construction and verification of nomograms
After univariate and multivariate analysis, independent prognostic factors were determined using the forward stepwise selection method. In the univariate analysis, the variables were further analyzed using the Cox proportional hazards regression model when P<0.05. A nomogram was then constructed to predict the 15-, 19-, and 23-month OS for patients with multi-organ metastases of GC. Based on the Kaplan-Meier and log-rank test methods, the OS survival curves of the main variables were drawn. In addition, the Fine-Gray competing risk model was used to screen out independent risk factors affecting CSS in patients with GC and multi-organ metastasis. A nomogram was constructed to predict the 15-, 19-, and 23-month CSS for patients with multi-organ metastases of GC to evaluate the outcome after eliminating the impact of competing risk events. Based on the cumulative risk model and Fine-Gray test methods, the cumulative incidence curve of each main variable was drawn.
The performance of OS and CSS nomograms was evaluated by discrimination and calibration. Discrimination was evaluated using Harrell’s consistency index (C-index). Discrimination of the nomogram models was further evaluated using the area under the receiver operating characteristic (ROC) curve (AUC). Calibration plots between the predicted and actual values were drawn to evaluate the prediction efficiency of the nomograms.
Statistical analysis
In this study, statistical analysis was performed using the software packages X-tile 3.6.1, SPSS 26.0, and R 4.1.1. The test level was α=0.05, and a P value <0.05 indicated a statistically significant difference.
Results
Baseline characteristics of the training and validation group
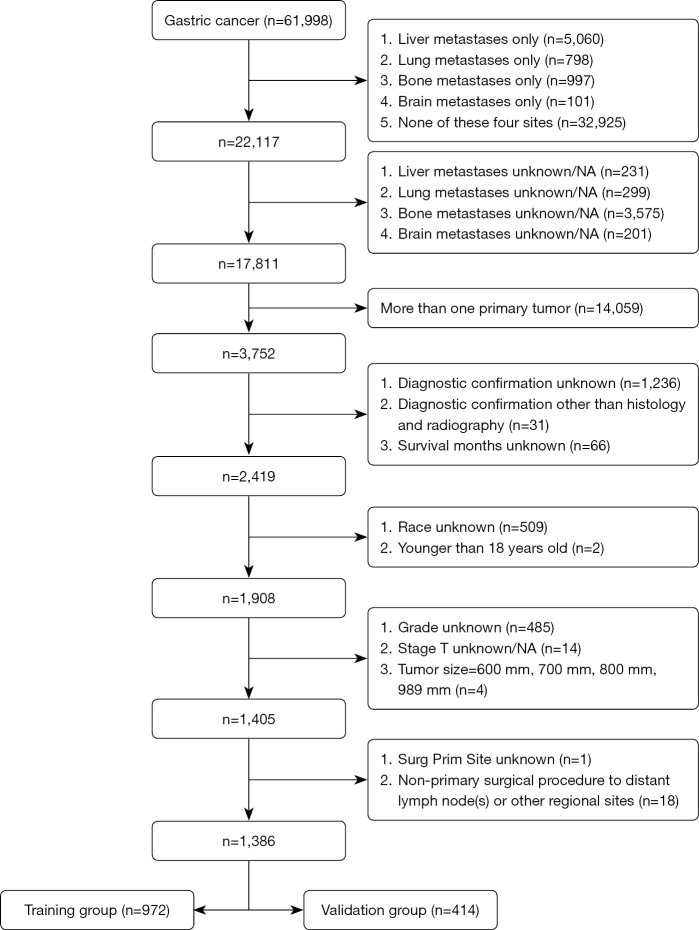
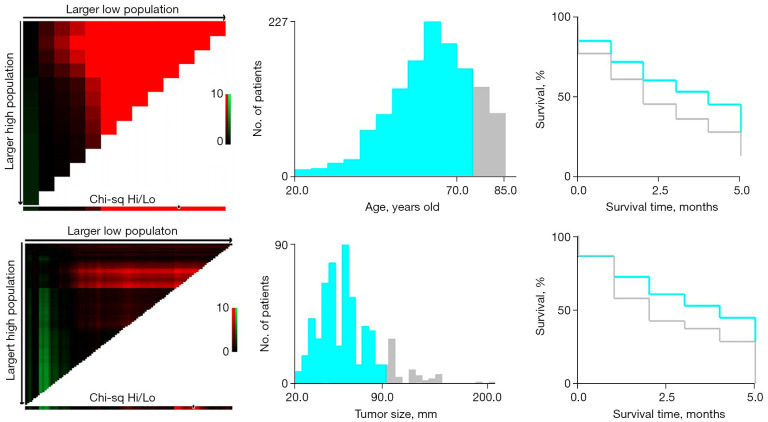
After applying the inclusion and exclusion criteria, we collected data from a total of 1,386 GC patients with multi-organ metastasis from 2010 to 2018 and randomly grouped them into a training group (972 patients) and a verification group (414 patients), at a ratio of 7:3 (Figure 1). The cutoff age value was 70 years (Figure 2, low subset = blue, high subset = gray) and the cutoff value for tumor size was 90 mm (Figure 2, low subset = blue, high subset = gray). There were no statistical differences in the basic characteristics of the 2 patient groups (P>0.05), and they were considered comparable (Table 1).
Figure 1.
The inclusion flowchart of recruited GC patients with multi-organ metastases. GC, gastric cancer.
Figure 2.
Determination of best-cutoff points of age and tumor size variables by the X-tile software.
Table 1. Baseline characteristics of the training and validation group.
| Variables | Training group (n=972) | Validation group (n=414) | Total (n=1,386) | P |
|---|---|---|---|---|
| Age, n (%) | 0.708 | |||
| <70 years | 665 (68.4) | 279 (67.4) | 944 (68.1) | |
| ≥70 years | 307 (31.6) | 135 (32.6) | 442 (31.9) | |
| Sex, n (%) | 0.938 | |||
| Female | 272 (28.0) | 115 (27.8) | 387 (27.9) | |
| Male | 700 (72.0) | 299 (72.2) | 999 (72.1) | |
| Race, n (%) | 0.230 | |||
| Black | 134 (13.8) | 44 (10.6) | 178 (12.8) | |
| White | 711 (73.1) | 309 (74.6) | 1,020 (73.6) | |
| Other* | 127 (13.1) | 61 (14.7) | 188 (13.6) | |
| Primary site*, n (%) | 0.763 | |||
| Cardia | 488 (50.2) | 217 (52.4) | 705 (50.9) | |
| Fundus | 59 (6.1) | 26 (6.3) | 85 (6.1) | |
| Body | 69 (7.1) | 24 (5.8) | 93 (6.7) | |
| Antrum | 86 (8.8) | 34 (8.2) | 120 (8.7) | |
| Pylorus | 10 (1.0) | 3 (0.7) | 13 (0.9) | |
| Lesser | 49 (5.0) | 21 (5.1) | 70 (5.1) | |
| Greater | 30 (3.1) | 6 (1.4) | 36 (2.6) | |
| Overlapping | 66 (6.8) | 28 (6.8) | 94 (6.8) | |
| Stomach, NOS | 115 (11.8) | 55 (13.3) | 170 (12.3) | |
| Histological type*, n (%) | 0.870 | |||
| Adenocarcinoma | 750 (77.2) | 315 (76.1) | 1,065 (76.8) | |
| Mucinous adenocarcinoma | 10 (1.0) | 5 (1.2) | 15 (1.1) | |
| Signet ring cell carcinoma | 106 (10.9) | 43 (10.4) | 149 (10.8) | |
| Other | 106 (10.9) | 51 (12.3) | 157 (12.3) | |
| Regional nodes examined, n (%) | 0.882 | |||
| ≤15 | 933 (96.0) | 397 (95.9) | 1,330 (96.0) | |
| >15 | 3 (0.3) | 2 (0.5) | 5 (0.4) | |
| Unknown | 36 (3.7) | 15 (3.6) | 51 (3.7) | |
| Metastases, n (%) | 0.410 | |||
| Liver + Lung | 448 (46.1) | 205 (49.5) | 653 (47.1) | |
| Liver + Bone | 229 (23.6) | 101 (24.4) | 330 (23.8) | |
| Liver + Brain | 20 (2.1) | 2 (0.5) | 22 (1.6) | |
| Lung + Bone | 97 (10.0) | 35 (8.5) | 132 (9.5) | |
| Lung + Brain | 11 (1.1) | 5 (1.2) | 16 (1.2) | |
| Bone + Brain | 13 (1.3) | 2 (0.5) | 15 (1.1) | |
| Liver + Lung + Bone | 106 (10.9) | 48 (11.6) | 154 (11.1) | |
| Liver + Lung + Brain | 19 (2.0) | 5 (1.2) | 24 (1.7) | |
| Liver + Bone + Brain | 12 (1.2) | 6 (1.4) | 18 (1.3) | |
| Lung + Bone + Brain | 7 (0.7) | 1 (0.2) | 8 (0.6) | |
| Liver + Lung + Bone + Brain | 10 (1.0) | 4 (1.0) | 14 (1.0) | |
| Tumor size, n (%) | 0.197 | |||
| <90 mm | 356 (36.6) | 149 (36.0) | 505 (36.4) | |
| ≥90 mm | 57 (5.9) | 15 (3.6) | 72 (5.2) | |
| Unknown | 559 (57.5) | 250 (60.4) | 809 (58.4) | |
| Grade, n (%) | 0.582 | |||
| Grade I | 28 (2.9) | 9 (2.2) | 37 (2.7) | |
| Grade II | 282 (29.0) | 129 (31.2) | 411 (29.7) | |
| Grade III, Grade IV | 662 (68.1) | 276 (66.7) | 938 (67.7) | |
| Stage T, n (%) | 0.561 | |||
| T0-1 | 179 (18.4) | 66 (15.9) | 245 (17.7) | |
| T2 | 28 (2.9) | 13 (3.1) | 41 (3.0) | |
| T3 | 104 (10.7) | 53 (12.8) | 157 (11.3) | |
| T4 | 167 (17.2) | 79 (19.1) | 246 (17.7) | |
| TX | 494 (50.8) | 203 (49.0) | 697 (50.3) | |
| Stage N, n (%) | ||||
| N0 | 292 (30.0) | 108 (26.1) | 400 (28.9) | 0.137 |
| N1 | 402 (41.4) | 150 (36.2) | 552 (39.8) | 0.074 |
| N2 | 49 (5.0) | 24 (5.8) | 73 (5.3) | 0.564 |
| N3 | 46 (4.7) | 25 (6.0) | 71 (5.1) | 0.313 |
| NX | 183 (18.8) | 107 (25.8) | 290 (20.9) | 0.003 |
| Surg prim site, n (%) | 0.397 | |||
| No | 943 (97.0) | 398 (96.1) | 1,341 (96.8) | |
| Yes | 29 (3.0) | 16 (3.9) | 45 (3.2) | |
| Surg dis site, n (%) | 0.413 | |||
| No | 946 (97.3) | 406 (98.1) | 1,352 (97.5) | |
| Yes | 26 (2.7) | 8 (1.9) | 34 (2.5) |
Other*: American Indian/Alaska Native, Asian/Pacific Islander; Primary site*: C16.0-Cardia, NOS, C16.1-Fundus of stomach, C16.2-Body of stomach, C16.3-Gastric antrum, C16.4-Pylorus, C16.5-Lesser curvature of stomach NOS, C16.6-Greater curvature of stomach NOS, C16.8-Overlapping lesion of stomach, C16.9-Stomach, NOS; Histological type*: Adenocarcinoma: Adenocarcinoma other than mucinous adenocarcinoma and signet-ring cell carcinoma; Other: Squamous cell carcinoma, Carcinoid tumor, Adenosquamous carcinoma, Neuroendocrine carcinoma et al.
Prognostic factors affecting patient OS and CSS
Prognostic factors affecting the OS of patients
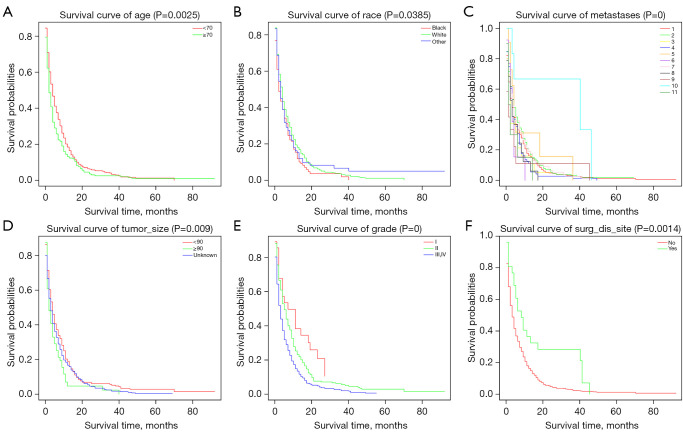
According to univariate analysis, age, race, metastasis, tumor size, degree of differentiation and metastasis surgery were prognostic factors affecting OS in GC patients with multi-organ metastasis (all P<0.05). Survival curves for the main variables were drawn based on the Kaplan-Meier and log-rank tests (Figure 3). The results of multivariate analysis showed that being aged ≥70 years, being of black race, having liver+bone+brain metastasis, having a tumor size ≥90 mm, having a degree of differentiation of grade III or IV, and not undergoing metastasis surgery were independent prognostic factors for OS in GC patients with multi-organ metastasis (all P<0.05) (Table 2).
Figure 3.
Survival curve of GC patients with multi-organ metastasis by age (A), race (B), metastasis (C), tumor size (D), grade (E) and metastasis surgery (F). GC, gastric cancer.
Table 2. Univariate and multivariate analysis of OS in gastric cancer patients with multi-organ metastases.
| Variables | Univariate analysis | Multivariate analysis | |||
|---|---|---|---|---|---|
| HR (95% CI) | P value | HR (95% CI) | P value | ||
| Age | |||||
| <70 years | Reference | Reference | |||
| ≥70 years | 1.25 (1.09–1.44) | 0.002* | 1.29 (1.11–1.49) | <0.001* | |
| Sex | |||||
| Female | Reference | – | – | ||
| Male | 1.00 (0.87–1.16) | 0.972 | – | – | |
| Race | |||||
| Black | Reference | Reference | |||
| White | 0.82 (0.67–0.99) | 0.038* | 0.79 (0.65–0.96) | 0.018* | |
| Other | 0.85 (0.65–1.09) | 0.203 | 0.82 (0.63–1.07) | 0.146 | |
| Primary site | |||||
| Cardia | Reference | – | – | ||
| Fundus | 1.10 (0.83–1.46) | 0.519 | – | – | |
| Body | 1.06 (0.81–1.40) | 0.671 | – | – | |
| Antrum | 1.14 (0.89–1.46) | 0.304 | – | – | |
| Pylorus | 0.86 (0.45–1.67) | 0.661 | – | – | |
| Lesser | 0.86 (0.62–1.19) | 0.353 | – | – | |
| Greater | 1.29 (0.88–1.90) | 0.187 | – | – | |
| Overlapping | 1.20 (0.92–1.57) | 0.170 | – | – | |
| Stomach, NOS | 1.03 (0.84–1.28) | 0.755 | – | – | |
| Histological type | |||||
| Adenocarcinoma | Reference | – | – | ||
| Mucinous adenocarcinoma | 1.32 (0.71–2.47) | 0.380 | – | – | |
| Signet ring cell carcinoma | 1.19 (0.96–1.48) | 0.112 | – | – | |
| Other | 1.12 (0.90–1.38) | 0.316 | – | – | |
| Regional nodes examined | |||||
| ≤15 | Reference | – | – | ||
| >15 | 0.81 (0.26–2.53) | 0.723 | – | – | |
| Unknown | 1.36 (0.97–1.92) | 0.077 | – | – | |
| Metastases | |||||
| Liver + Lung | Reference | Reference | |||
| Liver + Bone | 0.89 (0.75–1.05) | 0.162 | 0.85 (0.71–1.00) | 0.054 | |
| Liver + Brain | 1.17 (0.73–1.87) | 0.525 | 1.25 (0.78–2.02) | 0.357 | |
| Lung + Bone | 1.09 (0.87–1.38) | 0.447 | 0.98 (0.77–1.24) | 0.844 | |
| Lung + Brain | 0.75 (0.38–1.44) | 0.383 | 0.74 (0.38–1.44) | 0.374 | |
| Bone + Brain | 1.38 (0.78–2.46) | 0.271 | 1.22 (0.68–2.18) | 0.503 | |
| Liver + Lung + Bone | 0.94 (0.75–1.18) | 0.603 | 0.93 (0.74–1.17) | 0.540 | |
| Liver + Lung + Brain | 1.26 (0.78–2.01) | 0.345 | 1.58 (0.98–2.55) | 0.062 | |
| Liver + Bone + Brain | 1.37 (0.75–2.51) | 0.303 | 1.96 (1.05–3.67) | 0.036* | |
| Lung + Bone + Brain | 0.25 (0.09–0.67) | 0.006* | 0.41 (0.15–1.12) | 0.081 | |
| Liver + Lung + Bone + Brain | 1.47 (0.76–2.85) | 0.252 | 1.35 (0.69–2.62) | 0.379 | |
| Tumor size | |||||
| <90 mm | Reference | Reference | |||
| ≥90 mm | 1.40 (1.05–1.88) | 0.023* | 1.35 (1.01–1.82) | 0.045* | |
| Unknown | 1.14 (0.99–1.32) | 0.061 | 1.08 (0.94–1.25) | 0.275 | |
| Grade | |||||
| Grade I | Reference | Reference | |||
| Grade II | 1.44 (0.93–2.23) | 0.103 | 1.25 (0.80–1.94) | 0.324 | |
| Grade III, Grade IV | 2.09 (1.37–3.21) | 0.001* | 1.99 (1.30–3.06) | 0.002* | |
| Stage T | |||||
| T0-1 | Reference | – | – | ||
| T2 | 0.98 (0.64–1.51) | 0.937 | – | – | |
| T3 | 0.92 (0.71–1.18) | 0.495 | – | – | |
| T4 | 1.05 (0.84–1.31) | 0.658 | – | – | |
| TX | 1.05 (0.88–1.26) | 0.561 | – | – | |
| Stage N | |||||
| N0 | Reference | – | – | ||
| N1 | 0.98 (0.84–1.15) | 0.818 | – | – | |
| N2 | 0.94 (0.69–1.27) | 0.670 | – | – | |
| N3 | 1.23 (0.90–1.69) | 0.195 | – | – | |
| NX | 1.13 (0.92–1.39) | 0.242 | – | – | |
| Surg prim site | |||||
| No | Reference | – | – | ||
| Yes | 0.78 (0.53–1.17) | 0.232 | – | – | |
| Surg dis site | |||||
| No | Reference | Reference | |||
| Yes | 0.51 (0.33–0.78) | 0.002* | 0.52 (0.33–0.82) | 0.005* | |
*, P<0.05. OS, overall survival; HR, hazard ratio; CI, confidence interval.
Prognostic factors affecting the CSS of patients
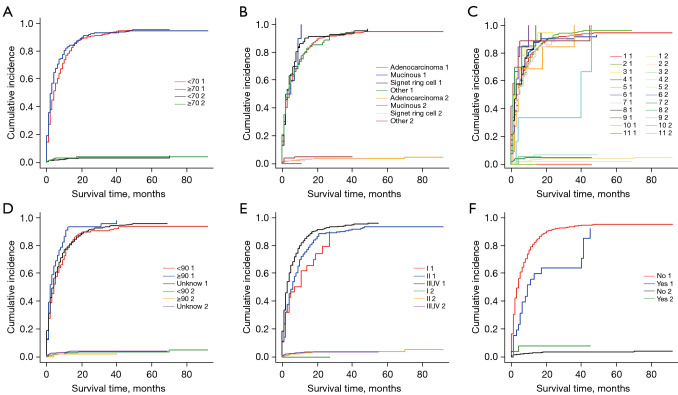
In this study, the Fine-Gray competing risk model was used to analyze CSS in GC patients with multi-organ metastases. In survival analysis, a competing risk is an event that precludes the primary event of interest and can easily lead to the miscalculation of the survival function (18). These events are said to be competing. In our study, death from other causes precluded the outcome of death from GC. Among the 972 patients in the training group, 880 died, of whom 846 were cancer-specific deaths and 34 were competing deaths. The results of stepwise screening based on the Fine-Gray competitive risk model and multivariate analysis showed that independent prognostic factors related to patient CSS were age, histological type, metastasis, tumor size, degree of differentiation, and metastasis surgery (all P<0.05) (Table 3). We also drew the cumulative incidence curve of the main variables (Figure 4).
Table 3. Multivariate analysis of CSS in gastric cancer patients with multi-organ metastases.
| Variables | HR (95% CI) | P value |
|---|---|---|
| Age | ||
| <70 years | Reference | |
| ≥70 years | 1.23 (1.06–1.42) | 0.006* |
| Histological type | ||
| Adenocarcinoma | Reference | |
| Mucinous adenocarcinoma | 1.53 (1.03–2.27) | 0.037* |
| Signet ring cell carcinoma | 1.06 (0.86–1.31) | 0.580 |
| Other | 0.93 (0.74–1.18) | 0.560 |
| Metastases | ||
| Liver + Lung | Reference | |
| Liver + Bone | 0.92 (0.79–1.09) | 0.340 |
| Liver + Brain | 1.30 (0.91–1.84) | 0.150 |
| Lung + Bone | 0.91 (0.71–1.16) | 0.440 |
| Lung + Brain | 0.82 (0.47–1.41) | 0.460 |
| Bone + Brain | 1.31 (0.88–1.96) | 0.190 |
| Liver + Lung + Bone | 0.87 (0.69–1.09) | 0.220 |
| Liver + Lung + Brain | 1.40 (0.96–2.03) | 0.083 |
| Liver + Bone + Brain | 2.02 (1.19–3.41) | 0.009* |
| Lung + Bone + Brain | 0.53 (0.28–1.03) | 0.060 |
| Liver + Lung + Bone + Brain | 1.44 (0.82–2.55) | 0.210 |
| Tumor size | ||
| <90 mm | Reference | |
| ≥90 mm | 1.33 (1.03–1.70) | 0.028* |
| Unknown | 1.02 (0.89–1.18) | 0.730 |
| Grade | ||
| Grade I | Reference | |
| Grade II | 1.14 (0.77–1.68) | 0.500 |
| Grade III, Grade IV | 1.65 (1.13–2.40) | 0.009* |
| Surg dis site | ||
| No | Reference | |
| Yes | 0.50 (0.32–0.76) | 0.001* |
*, P<0.05. CSS, cancer-specific survival; HR, hazard ratio; CI, confidence interval.
Figure 4.
Cumulative incidence curve of age (A), histological type (B), metastasis (C), tumor size (D), grade (E) and metastasis surgery (F) of GC patients with multi-organ metastases. 1, cancer-specific death; 2, competitive death; GC, gastric cancer.
Construction and verification of the nomogram prediction model
Construction of nomogram prediction models
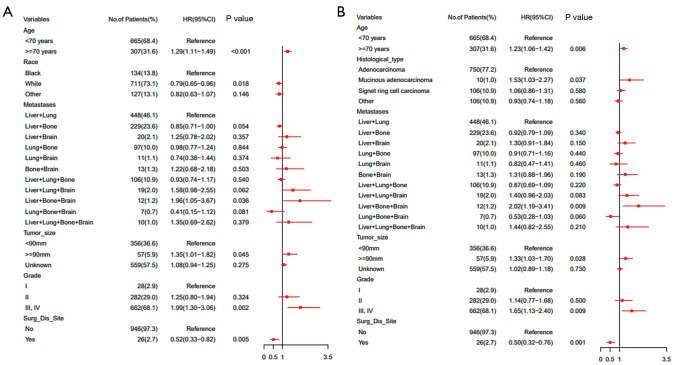
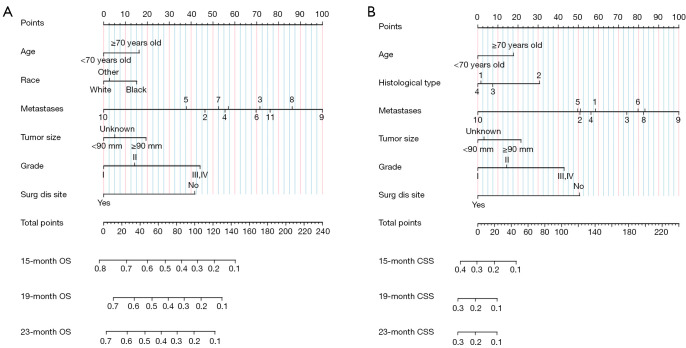
Based on the selected independent prognostic factors affecting patient OS and CSS (Figure 5), we constructed nomogram models to predict patient OS and CSS (Figure 6). In the prediction models, the prognostic factors scores (Table 4) were added together to obtain a total score, and the value corresponding to the total score could be used to predict a patient’s 15-, 19-, and 23-month OS and CSS.
Figure 5.
Forest plot of all variables with hazard ratios in GC patients with multi-organ metastasis with OS (A) and CSS (B). GC, gastric cancer; OS, overall survival; CSS, cancer-specific survival.
Figure 6.
Establishment of nomograms regarding both OS (A) and CSS (B). OS, overall survival; CSS, cancer-specific survival.
Table 4. Scores of prognostic factors in the OS and CSS nomograms.
| Variables | OS nomogram | CSS nomogram |
|---|---|---|
| Age | ||
| <70 years | 0 | 0 |
| ≥70 years | 16 | 18 |
| Race | ||
| Black | 15 | – |
| White | 0 | – |
| Other | 3 | – |
| Histological type | ||
| Adenocarcinoma | – | 2 |
| Mucinous adenocarcinoma | – | 31 |
| Signet ring cell carcinoma | – | 7 |
| Other | – | 0 |
| Metastases | ||
| Liver + Lung | 57 | 59 |
| Liver + Bone | 46 | 51 |
| Liver + Brain | 71 | 74 |
| Lung + Bone | 56 | 56 |
| Lung + Brain | 38 | 50 |
| Bone + Brain | 70 | 80 |
| Liver + Lung + Bone | 53 | 51 |
| Liver + Lung + Brain | 86 | 82 |
| Liver + Bone + Brain | 100 | 100 |
| Lung + Bone + Brain | 0 | 0 |
| Liver + Lung + Bone + Brain | 76 | 83 |
| Tumor size | ||
| <90 mm | 0 | 0 |
| ≥90 mm | 19 | 21 |
| Unknown | 5 | 3 |
| Grade | ||
| Grade I | 0 | 0 |
| Grade II | 14 | 14 |
| Grade III, Grade IV | 44 | 43 |
| Surg dis site | ||
| No | 42 | 51 |
| Yes | 0 | 0 |
OS, overall survival; CSS, cancer-specific survival.
Verification of the nomogram prediction models
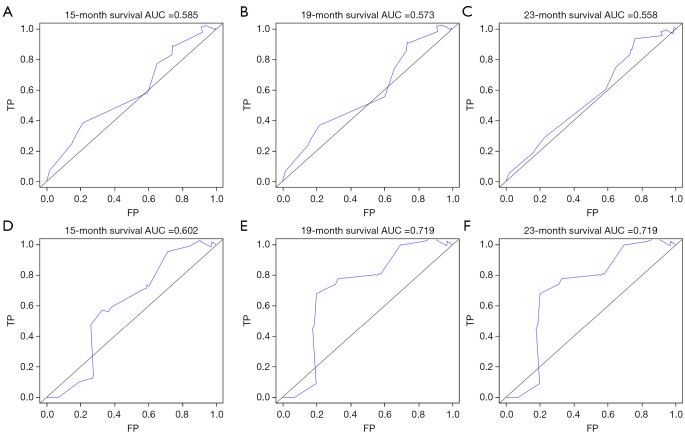
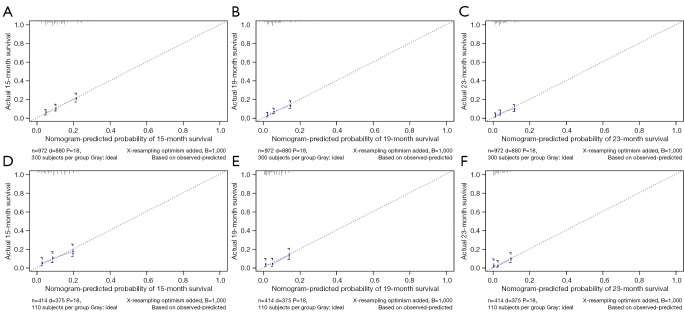
The bootstrap method was used to repeatedly sample 1,000 times to verify the modeling effect of the nomogram. The C-indices of the OS nomogram prediction model in the training and validation group were 0.608 [95% confidence interval (CI): 0.584–0.632] and 0.615 (95% CI: 0.582–0.648), respectively. We drew the ROC curve of the training group’s nomogram to predict the OS of patients at 15, 19, and 23 months, and calculated their AUC values to be 0.585, 0.573, 0.558, respectively (Figure 7A-7C). At the same time, the AUC values of the verification group at 15, 19, and 23 months were 0.602, 0.719, and 0.719, respectively (Figure 7D-7F). In addition, the prediction curve and the ideal curve in the calibration diagrams for the 2 groups fitted well, indicating that the model had good accuracy (Figure 8).
Figure 7.
ROC of nomogram using OS of the training group (A-C) and the validation group (D-F) in 15-, 19- and 23-month. TP, true positive; FP, false positive; ROC, receiver operating characteristic; OS, overall survival.
Figure 8.
Evaluation of calibration plots based on OS of the training group (A-C) and the validation group (D-F) in 15-, 19- and 23-month. OS, overall survival.
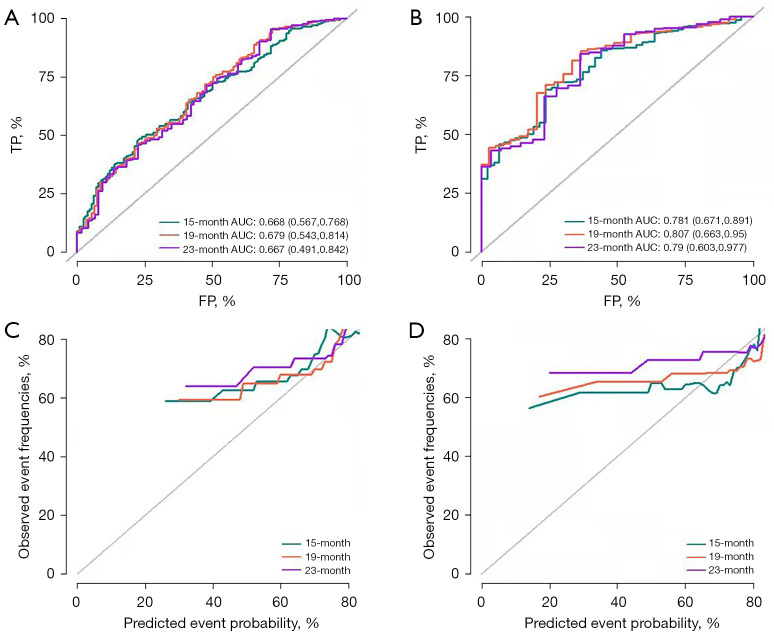
The C-indices of the CSS nomogram prediction model for the training and validation groups were 0.605 (95% CI: 0.581–0.629) and 0.646 (95% CI: 0.622–0.670), respectively. The AUC values of the 15-, 19- and 23-month ROC curves of the CSS for the training group were 0.668, 0.679 and 0.667, respectively (Figure 9A), while in the validation group they were 0.781, 0.807 and 0.790, respectively (Figure 9B). In addition, the calibration curves of the 2 groups also showed a good fit between the predicted curve and the ideal curve, indicating that the model was well calibrated (Figure 9C,9D).
Figure 9.
ROC of nomogram and evaluation of calibration plots based on CSS of the training group (A,C) and the validation group (B,D) in 15-, 19- and 23-month. TP, true positive; FP, false positive; ROC, receiver operating characteristic; CSS, cancer-specific survival.
Discussion
Although GC is one of the most common malignant tumors, in the past decade, continuous improvements in diagnosis and treatment level have led to a decline in the incidence and mortality of GC (19). However, as the population ages, the number of cases of GC may increase. In addition, the onset of GC is insidious, leading to advanced disease stages at first diagnosis. Patients with advanced GC are prone to metastasis, leading to increased patient mortality (20). Therefore, it is of great significance to explore the prognostic factors for GC patients with multi-organ metastases.
A nomogram is a visual statistical graph used to predict the prognosis of various diseases. It can score each independent prognostic factor based on the results of multivariate analysis, and the sum of the points of each factor corresponds to the incidence of the endpoint event to predict the probability of the patient’s endpoint event (21). To date, researchers have constructed a nomogram model for predicting the prognosis of advanced GC, and confirmed that the model has good predictive ability (22,23). In the present study, a nomogram model was constructed to predict OS and CSS in GC patients with multi-organ metastasis. The model’s C-indices and AUC values were approximately 0.6 and 0.7, respectively. Considering that multi-organ metastatic tumors are affected by confounding variables, the predictive ability of the model constructed in this study could be considered relatively good. To our knowledge, this was the first study to highlight the potential value of nomograms using a population dataset of GC patients with multi-organ metastasis. By including the patient’s personal clinical and pathological information, the model constructed herein could briefly and intuitively predict the patient’s OS and CSS.
This study showed that the older the GC patients with multi-organ metastasis, the lower their OS and CSS. A previous study also showed that age was an independent prognostic factor for many cancer patients, including those with advanced GC (24). There are 2 possible factors for the low survival rate of elderly patients. First, elderly patients are prone to severe complications and have low immunity (25). Secondly, because younger patients are generally in better physical condition, they can easily tolerate extensive lymphadenectomy and standardized chemotherapy, while older patients cannot tolerate these treatments so easily (26). The results of this study indicated that tumor metastasis was an independent prognostic factor affecting OS and CSS in GC patients with multi-organ metastasis. Among the patients studied, those with liver, lung, bone and brain metastases had the least favorable prognoses, with a median survival time of only 1 month, consistent with the results of previous studies in hepatocellular carcinoma (27). This could be because patients with systemic metastases have almost passed the radical surgery window, and such patients have a heavier tumor burden and achieve poor chemotherapy effects, which leads to a very low survival rate. The nomogram of this study showed that race was an independent prognostic factor in OS for GC patients with multi-organ metastasis, which could increase the impact weight by 15 points. The poor prognosis of black people might be related to genetic differences, economic status, living habits and less frequent communication between doctors and nurses (28). In addition, this study also found that patients with mucinous adenocarcinoma had lower CSS compared with patients with other histological types. The impact weight in these cases was increased by 31 points, which might be due to the fact that patients with mucinous adenocarcinoma had developed to an advanced stage at the time of diagnosis and had a higher degree of differentiation (29).
Alshehri et al. (24) retrospectively analyzed the prognostic factors of 2,005 advanced GC patients and found that a tumor size >50 mm was an independent prognostic factor affecting OS rates. Similarly, the present study found that GC patients with multi-organ metastases with a tumor size of 90 mm or more had lower OS and CSS rates. This may be due to the larger tumors easily invading the serosal layer, which may lead to a later stage and poorer prognosis. our study used X-tile software to calculate that the optimum tumor size cut-off value affecting the prognosis of GC patients with multi-organ metastases was 90 mm, which could provide a certain reference value for future screening of patients (30). The degree of differentiation represents the relative malignancy of the tumor. The worse the differentiation, the higher the malignancy of the tumor. The present study also concluded that poor differentiation was a prognostic factor affecting patient OS and CSS, reaching an OS nomogram model score of 44 points and CSS nomogram model score of 43 points. The vast majority of patients (97.3%) in this study did not receive surgical metastasis treatment, which may be due to the fact that patients with 2 or more organ metastases rarely meet the requirements for radical resection. Our analysis found that the prognosis of patients who did not undergo metastasis surgery was unfavorable, with the OS nomogram showing an increase of 42 points in impact weight, and the CSS nomogram showing an increase of 51 points in impact weight. Previous studies have shown that metastasis surgery could prolong patient survival and improve prognosis (31,32). Therefore, when GC patients with multi-organ metastasis are in a physical condition that could tolerate surgery and the residual metastases function well, surgical treatment could be recommended to prolong the patient’s survival (33).
This study had several limitations. First, although the number of cases included in the SEER database was large and of high quality, it did not include factors affecting the prognosis of GC, such as smoking history, drinking history, family history, history of Helicobacter pylori infection and tumor markers, which caused bias. Secondly, since the SEER database has not provided relevant patient radiotherapy and chemotherapy information since 2015; considering that this information is affected by the subjective willingness of patients, the variables of radiotherapy and chemotherapy were not included in this study, which may also have caused bias. Thirdly, due to the incomplete clinicopathological information of some GC patients with multi-organ metastasis, we eliminated them from the study according to our inclusion and exclusion criteria, which may also have caused bias. Finally, this study constructed nomograms based on a retrospective analysis, and the level of research evidence was low, so our findings need further verification through prospective studies.
Conclusions
This study established a reliable prognostic risk assessment model for GC patients with multi-organ metastasis. These patients can find a total score based on the nomogram, and then evaluate their future survival, which has a strong clinical guiding role. For patients with high scores, clinicians can make treatment interventions and treatment plan adjustments in a timelier manner to improve the prognosis. We have confirmed the reliability and accuracy of this model through verification, and proved that the nomogram has a better prediction, and it can provide more information for clinical work.
Acknowledgments
The authors thank the National Cancer Institute for providing the Surveillance, Epidemiology, and End Results (SEER) dataset.
Funding: The National Natural Science Foundation of China (No. 81572426) funded this manuscript.
Ethical Statement: The authors are accountable for all aspects of the work in ensuring that questions related to the accuracy or integrity of any part of the work are appropriately investigated and resolved. The study was conducted in accordance with the Declaration of Helsinki (as revised in 2013).
Footnotes
Reporting Checklist: The authors have completed the TRIPOD reporting checklist. Available at https://tcr.amegroups.com/article/view/10.21037/tcr-21-2569/rc
Conflicts of Interest: All authors have completed the ICMJE uniform disclosure form (available at https://tcr.amegroups.com/article/view/10.21037/tcr-21-2569/coif). The authors have no conflicts of interest to declare.
References
- 1.Siegel RL, Miller KD, Fuchs HE, et al. Cancer Statistics, 2021. CA Cancer J Clin 2021;71:7-33. 10.3322/caac.21654 [DOI] [PubMed] [Google Scholar]
- 2.Bray F, Ferlay J, Soerjomataram I, et al. Global cancer statistics 2018: GLOBOCAN estimates of incidence and mortality worldwide for 36 cancers in 185 countries. CA Cancer J Clin 2018;68:394-424. 10.3322/caac.21492 [DOI] [PubMed] [Google Scholar]
- 3.Zhou L, Li X, Zhou F, et al. Downregulation of leucine-rich repeats and immunoglobulin-like domains 1 by microRNA-20a modulates gastric cancer multidrug resistance. Cancer Sci 2018;109:1044-54. 10.1111/cas.13538 [DOI] [PMC free article] [PubMed] [Google Scholar]
- 4.Zou J, Qin W, Yang L, et al. Genetic alterations and expression characteristics of ARID1A impact tumor immune contexture and survival in early-onset gastric cancer. Am J Cancer Res 2020;10:3947-72. [PMC free article] [PubMed] [Google Scholar]
- 5.Bringeland EA, Wasmuth HH, Mjønes P, et al. A population-based study on incidence rates, Lauren distribution, stage distribution, treatment, and long-term outcomes for gastric adenocarcinoma in Central Norway 2001-2011. Acta Oncol 2017;56:39-45. 10.1080/0284186X.2016.1227086 [DOI] [PubMed] [Google Scholar]
- 6.Qiu MZ, Shi SM, Chen ZH, et al. Frequency and clinicopathological features of metastasis to liver, lung, bone, and brain from gastric cancer: A SEER-based study. Cancer Med 2018;7:3662-72. 10.1002/cam4.1661 [DOI] [PMC free article] [PubMed] [Google Scholar]
- 7.Han J, Tu J, Tang C, et al. Clinicopathological Characteristics and Prognosis of cT1N0M1 Gastric Cancer: A Population-Based Study. Dis Markers 2019;2019:5902091. 10.1155/2019/5902091 [DOI] [PMC free article] [PubMed] [Google Scholar]
- 8.Li Y, Xie D, Chen X, et al. Prognostic Value of the Site of Distant Metastasis and Surgical Interventions in Metastatic Gastric Cancer: A Population-Based Study. Technol Cancer Res Treat 2020;19:1533033820964131. 10.1177/1533033820964131 [DOI] [PMC free article] [PubMed] [Google Scholar]
- 9.Takashima A, Boku N, Kato K, et al. Survival prolongation after treatment failure of first-line chemotherapy in patients with advanced gastric cancer: combined analysis of the Japan Clinical Oncology group trials JCOG9205 and JCOG9912. Gastric Cancer 2014;17:522-8. 10.1007/s10120-013-0309-z [DOI] [PubMed] [Google Scholar]
- 10.Thrift AP, El-Serag HB. Burden of Gastric Cancer. Clin Gastroenterol Hepatol 2020;18:534-42. 10.1016/j.cgh.2019.07.045 [DOI] [PMC free article] [PubMed] [Google Scholar]
- 11.Zhang Y, Lin Y, Duan J, et al. A Population-Based Analysis of Distant Metastasis in Stage IV Gastric Cancer. Med Sci Monit 2020;26:e923867. 10.12659/MSM.923867 [DOI] [PMC free article] [PubMed] [Google Scholar]
- 12.Jiang Y, Qu S, Pan X, et al. Prognostic Nomogram For Locoregionally Advanced Nasopharyngeal Carcinoma. Sci Rep 2020;10:861. 10.1038/s41598-020-57968-x [DOI] [PMC free article] [PubMed] [Google Scholar]
- 13.Digklia A, Wagner AD. Advanced gastric cancer: Current treatment landscape and future perspectives. World J Gastroenterol 2016;22:2403-14. 10.3748/wjg.v22.i8.2403 [DOI] [PMC free article] [PubMed] [Google Scholar]
- 14.Chen X, Chen S, Wang X, et al. Analysis and external validation of a nomogram to predict peritoneal dissemination in gastric cancer. Chin J Cancer Res 2020;32:197-207. 10.21147/j.issn.1000-9604.2020.02.07 [DOI] [PMC free article] [PubMed] [Google Scholar]
- 15.Balachandran VP, Gonen M, Smith JJ, et al. Nomograms in oncology: more than meets the eye. Lancet Oncol 2015;16:e173-80. 10.1016/S1470-2045(14)71116-7 [DOI] [PMC free article] [PubMed] [Google Scholar]
- 16.Zuo Z, Zhang G, Song P, et al. Survival Nomogram for Stage IB Non-Small-Cell Lung Cancer Patients, Based on the SEER Database and an External Validation Cohort. Ann Surg Oncol 2021;28:3941-50. 10.1245/s10434-020-09362-0 [DOI] [PubMed] [Google Scholar]
- 17.Yu C, Zhang Y. Development and validation of prognostic nomogram for young patients with gastric cancer. Ann Transl Med 2019;7:641. 10.21037/atm.2019.10.77 [DOI] [PMC free article] [PubMed] [Google Scholar]
- 18.Wang SB, Qi WX, Chen JY, et al. Competing risk nomogram predicting initial loco-regional recurrence in gastric cancer patients after D2 gastrectomy. Radiat Oncol 2019;14:128. 10.1186/s13014-019-1332-y [DOI] [PMC free article] [PubMed] [Google Scholar]
- 19.Chai H, Sun C, Liu J, et al. The Relationship Between ZEB1-AS1 Expression and the Prognosis of Patients With Advanced Gastric Cancer Receiving Chemotherapy. Technol Cancer Res Treat 2019;18:1533033819849069. 10.1177/1533033819849069 [DOI] [PMC free article] [PubMed] [Google Scholar]
- 20.Guo X, Liang X, Wang Y, et al. Significance of Tumor Mutation Burden Combined With Immune Infiltrates in the Progression and Prognosis of Advanced Gastric Cancer. Front Genet 2021;12:642608. 10.3389/fgene.2021.642608 [DOI] [PMC free article] [PubMed] [Google Scholar]
- 21.Yang Y, Wang Y, Deng H, et al. Development and validation of nomograms predicting survival in Chinese patients with triple negative breast cancer. BMC Cancer 2019;19:541. 10.1186/s12885-019-5703-4 [DOI] [PMC free article] [PubMed] [Google Scholar]
- 22.Zhang L, Liu X, Lin H, et al. Factors affecting survival prognosis of advanced gastric cancer and establishment of a nomogram predictive model. Nan Fang Yi Ke Da Xue Xue Bao 2021;41:621-7. [DOI] [PMC free article] [PubMed] [Google Scholar]
- 23.Liu SH, Hou XY, Zhang XX, et al. Establishment and validation of a predictive nomogram model for advanced gastric cancer with perineural invasion. Zhonghua Wei Chang Wai Ke Za Zhi 2020;23:1059-66. [DOI] [PubMed] [Google Scholar]
- 24.Alshehri A, Alanezi H, Kim BS. Prognosis factors of advanced gastric cancer according to sex and age. World J Clin Cases 2020;8:1608-19. 10.12998/wjcc.v8.i9.1608 [DOI] [PMC free article] [PubMed] [Google Scholar]
- 25.Wong JU, Tai FC, Huang CC. An examination of surgical and survival outcomes in the elderly (65-79 years of age) and the very elderly (>/=80 years of age) who received surgery for gastric cancer. Curr Med Res Opin 2020;36:229-33. 10.1080/03007995.2018.1520083 [DOI] [PubMed] [Google Scholar]
- 26.Lima I, Pernambuco L. Morbidade hospitalar por acidente vascular encefálico e cobertura fonoaudiológica no Estado da Paraíba, Brasil. 2017;22:e1822. Available online: https://doi.org/ 10.1590/2317-6431-2016-1822 [DOI]
- 27.Oweira H, Petrausch U, Helbling D, et al. Prognostic value of site-specific extra-hepatic disease in hepatocellular carcinoma: a SEER database analysis. Expert Rev Gastroenterol Hepatol 2017;11:695-701. 10.1080/17474124.2017.1294485 [DOI] [PubMed] [Google Scholar]
- 28.Ingersoll LT, Alexander SC, Priest J, et al. Racial/ethnic differences in prognosis communication during initial inpatient palliative care consultations among people with advanced cancer. Patient Educ Couns 2019;102:1098-103. 10.1016/j.pec.2019.01.002 [DOI] [PubMed] [Google Scholar]
- 29.Ott C, Gerken M, Hirsch D, et al. Advanced Mucinous Colorectal Cancer: Epidemiology, Prognosis and Efficacy of Chemotherapeutic Treatment. Digestion 2018;98:143-52. 10.1159/000487710 [DOI] [PubMed] [Google Scholar]
- 30.Camp RL, Dolled-Filhart M, Rimm DL. X-tile: a new bio-informatics tool for biomarker assessment and outcome-based cut-point optimization. Clin Cancer Res 2004;10:7252-9. 10.1158/1078-0432.CCR-04-0713 [DOI] [PubMed] [Google Scholar]
- 31.Markar SR, Mikhail S, Malietzis G, et al. Influence of Surgical Resection of Hepatic Metastases From Gastric Adenocarcinoma on Long-term Survival: Systematic Review and Pooled Analysis. Ann Surg 2016;263:1092-101. 10.1097/SLA.0000000000001542 [DOI] [PubMed] [Google Scholar]
- 32.Seow-En I, Hwarng G, Tan GHC, et al. Palliative surgery for Krukenberg tumors - 12-year experience and review of the literature. World J Clin Oncol 2018;9:13-9. 10.5306/wjco.v9.i1.13 [DOI] [PMC free article] [PubMed] [Google Scholar]
- 33.Zhang K, Chen L. Chinese consensus on the diagnosis and treatment of gastric cancer with liver metastases. Ther Adv Med Oncol 2020;12:1758835920904803. 10.1177/1758835920904803 [DOI] [PMC free article] [PubMed] [Google Scholar]


