Abstract
Background
An in-depth understanding of the key molecules and associated mechanisms involved in acute myeloid leukemia (AML) carcinogenesis, proliferation, and relapse is critical. This provides a basis for disease screening, early diagnosis, and development of effective treatment strategies and prognosis.
Methods
We downloaded AML transcription data sets from The Cancer Genome Atlas (TCGA) and Gene Expression Omnibus (GEO) databases. Differentially expressed genes (DEGs) were screened by R software and limma packages. Gene Ontology (GO) functional enrichment analysis and Kyoto Encyclopedia of Genes and Genomes (KEGG) pathway enrichment analysis were performed on DEGs by public databases. In the DEG set, a random forest algorithm was used to identify characteristic genes of AML. The receiver operator characteristic (ROC) curve was used to evaluate the diagnostic efficacy of selected characteristic genes, which provided clues for the discovery of early diagnostic markers. The Estimate score was calculated using the Estimation of STromal and Immune cells in MAlignant Tumor tissues using Expression data (ESTIMATE) algorithm. Spearman’s correlation test was used to explore the correlation between characteristic genes and Estimate Score, which provided clues for clarifying the potential pathogenic mechanism of key genes.
Results
A total of 1,494 DEGs were identified from AML samples and normal samples, among which 1,181 genes were upregulated and 313 genes were downregulated in AML. There were 2 genes with a mean decrease Gini >2, namely, CDC20 and ESM1, respectively. The ROC curve showed that the area under the curve (AUC) of CDC20 was 0.966, and the 95% confidence interval (CI) was (0.939 to 0.987) (P<0.001). The AUC of ESM1 was 0.905, and 95% CI: 0.849 to 0.953 (P<0.001). Correlation analysis showed that CDC20 expression was negatively correlated with Estimate Score (R=−0.21, P=0.0036) in AML. The expression of ESM1 was negatively correlated with Estimate Score (R=−0.57, P<0.001).
Conclusions
The genes CDC20 and ESM1 were identified as AML characteristic genes by random forest algorithm. Both CDC20 and ESM1 have good diagnostic efficacy for AML. They may play a carcinogenic role by promoting tumor cell proliferation and inhibiting immune cell chemotaxis, which are potential biological markers.
Keywords: Acute myeloid leukemia (AML), random forest algorithm, receiver operator characteristic curve, biological marker
Introduction
Acute myeloid leukemia (AML) is a common acute leukemia, occurring in all age groups (1). It is characterized by the accumulation of acquired genetic changes in hematopoietic progenitor cells, changing the self-renewal, proliferation, and differentiation mechanism (2). In the diagnosis of AML, there is a lack of markers with both sensitivity and specificity (3). To date, most patients have been diagnosed in the middle- and late-stages of AML (3). The treatment methods for AML are limited and prone to drug resistance (4). Even after treatment, the recurrence rate of AML patients remains high (5), and the survival rate of AML patients is low. The five-year survival rate of AML patients is less than 43% (6). It is crucial to understand the key molecules and related mechanisms related to the carcinogenesis, proliferation, and recurrence of AML to provide a basis for disease screening, early diagnosis, effective treatment strategies, and prognosis judgment. Some previous studies have identified genes associated with AML prognosis, such as nucleophosmin-1 (NPM1), CCAAT enhancer binding factor alpha (CEBPA), and fms-like tyrosine kinase3 (FLT3) (7-9). However, AML lacks specific diagnostic markers (3).
In the past few decades, transcriptome sequencing technology and bioinformatics analysis have been widely used to screen the mechanistic pathways of tumor genome changes and gene interactions. The advantage of bioinformatics analysis of whole transcriptome sequencing lies in the detection of gene expression in a large and comprehensive manner, and the identification of genes that may be affected by diseases in a short period of time as biomarkers for early diagnosis. The results help to identify the key pathogenic genes of tumors and find new therapeutic targets. However, independent microarray analysis and simple statistical methods easily affect the accuracy of the results.
Multi-database joint analysis and application of false discovery rate combined with fold change to screen differential genes can solve this problem well. Therefore, AML transcription data sets in The Cancer Genome Atlas (TCGA) database and Gene Expression Omnibus (GEO) were jointly analyzed in this study. Our study may provide clues for the discovery of potential diagnostic markers, therapeutic targets for AML, and elucidation of oncogenic mechanisms. We present the following article in accordance with the STARD reporting checklist (available at https://tcr.amegroups.com/article/view/10.21037/tcr-22-1257/rc).
Methods
This study combined TCGA data and GEO database to screen for differentially expressed genes in AML from tumor samples and normal samples. In the AML differentially expressed gene set, the random forest algorithm was used to screen the AML signature genes and the receiver operator characteristic (ROC) curve was used to evaluate the diagnostic performance of the screened signature genes. In this study, we explored the relationship between eigengenes and immune cell chemotaxis by analyzing the correlation between eigengenes and Estimate score.
Data download
The AML RNA sequencing (RNA-seq) data set was downloaded from TCGA database containing 151 AML samples. The AML whole blood RNA-seq data set (GSE24395, GSE30029) was downloaded from the GEO database. The GSE24395 data set contains 12 AML samples and 5 normal samples; GSE30029 contains 46 AML samples and 31 normal samples. All data sets were combined into a matrix and batch-corrected and normalized. All data in this study are public and thus do not need the approval of the local hospital ethics committee. The study was conducted in accordance with the Declaration of Helsinki (as revised in 2013).
Screening of differentially expressed genes
Differentially expressed genes (DEGs) were screened using R software (v3.5.1) (The R Foundation for Statistical Computing, Vienna, Austria) and the limma package. The calculation formula of fold change (FC) was as follows: FC = gene expression of AML sample/gene expression of a normal sample. The screening condition is |log2FC| >2 and the false discovery rate (FDR) <0.01
Enrichment analysis of DEGs
The Database for Annotation, Visualization, and Integrated Discovery (DAVID) was used for Gene Ontology (GO) function enrichment analysis of DEGs. An FDR <0.05 was used as the screening condition. The Kyoto Encyclopedia of Genes and Genomes (KEGG) was used to enrich and analyze the DEGs. An FDR <0.05 was used as the screening condition. The results of enrichment analysis were visualized by the ggplot package in R.
Characteristic gene screening and diagnostic efficacy test
In the DEG set, the random forest algorithm was used to screen the characteristic genes of AML. An ROC curve was used to evaluate the diagnostic efficacy of the selected characteristic genes.
Tumor purity calculation
The stromal score and immune score (IS) of AML samples were calculated based on gene expression by using the Estimation of STromal and Immune cells in MAlignant Tumor tissues using Expression data (ESTIMATE) algorithm. The results represented stromal and immune cells' content in tumor samples, respectively. The sum of the two was indicated by the Estimate score, which could reflect the purity of the tumor. Spearman’s correlation test was used to investigate the relationship between characteristic genes and Estimate score.
Statistical analysis
This study used R software (V3.5.1) and related R packages for statistical analysis. Two-sided P-value <0.05 indicated statistical significance.
Results
DEG screening
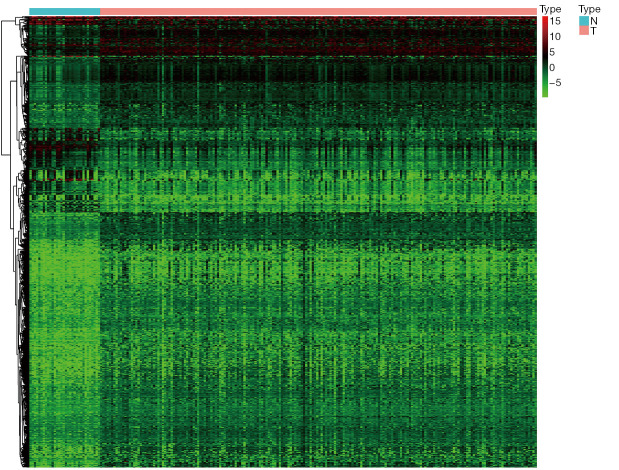
In all, 1,494 DEGs were screened between AML and normal samples in this study. A total of 1,181 genes were upregulated (log2FC >2, FDR <0.01) and 313 genes were downregulated (log2FC <−2, FDR <0.01). The heat map of DEGs is shown in Figure 1.
Figure 1.
AML samples and normal samples DEGs. T represents the tumor sample, and N represents the normal sample. Red indicates upregulation in AML samples, and green indicates downregulation in AML samples. The horizontal axis indicates different samples, and the vertical axis indicates DEGs. AML, acute myeloid leukemia; DEGs, differentially expressed genes.
GO enrichment analysis
The GO enrichment analysis showed that AML DEGs were significantly enriched in functional items, such as sequence-specific double-stranded DNA binding, receiver binding, serine type dependent activity, and so on, of molecular function (MF). In terms of cellular component (CC), AML DEGs were significantly enriched in functional items such as chromatin, extracellular matrix, endoplasmic reticulum lumen, and so forth. In terms of biological process (BP), AML DEGs were significantly enriched in functional items such as positive regulation of cell promotion, protein, and immune response, as shown in Figure 2.
Figure 2.
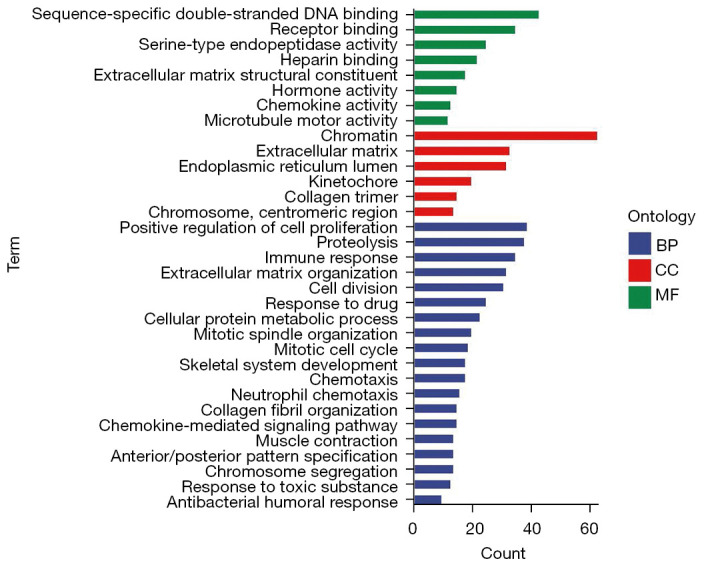
AML DEGs were enriched in GO. The horizontal axis represents the number of enriched genes, and the vertical axis represents the GO project. BP, biological process; CC, cellular component; MF, molecular function; AML, acute myeloid leukemia; DEGs, differentially expressed genes; GO, Gene Ontology.
KEGG enrichment analysis
The analysis indicated significant differences in the p53 signaling pathway, tumor necrosis factor (TNF) signaling pathway, and HIF-1 signaling pathway expression, as shown in Figure 3.
Figure 3.
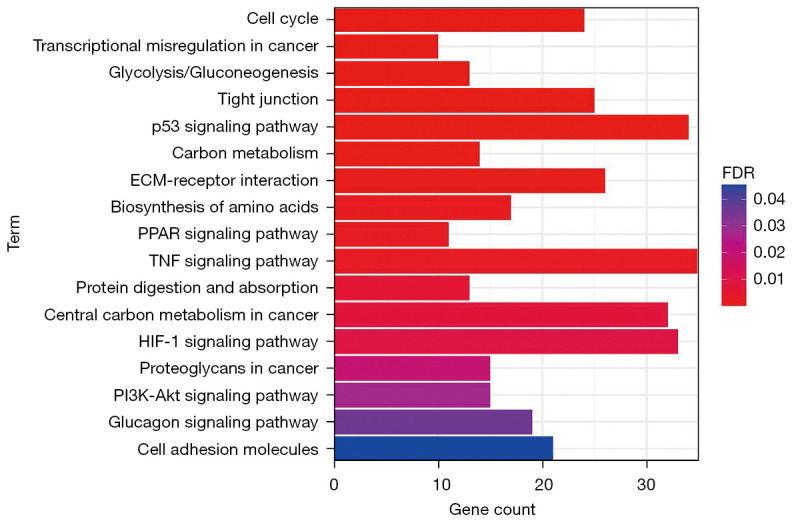
Pathway enrichment analysis of KEGG of AML differentially expressed genes. The horizontal axis represents the number of enriched genes, and the vertical axis represents the KEGG pathway. KEGG, Kyoto Encyclopedia of Genes and Genomes; AML, acute myeloid leukemia; ECM, extracellular matrix; TNF, tumor necrosis factor; FDR, false discovery rate; PPAR, peroxisome proliferator-activated receptor.
Characteristic gene screening
When the minimum average error rate of normal samples and AML samples was 0.01, the total number of trees was 48 (as shown in Figure 4). There were two genes with a mean decrease Gini greater than 2, namely, CDC20 and ESM1, respectively, as shown in Figure 5.
Figure 4.
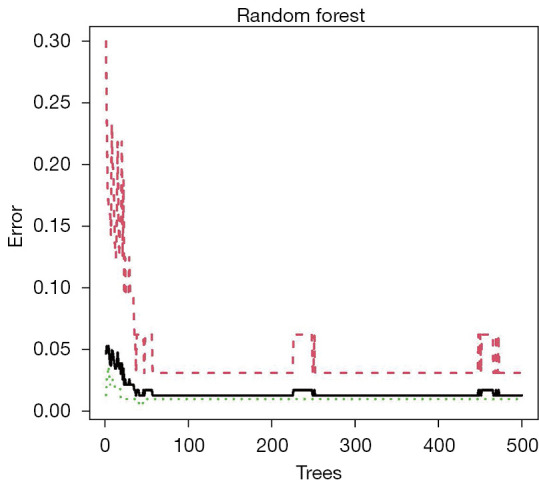
Random forest tree. The abscissa represents trees and the ordinate represents the error rate. Red represents AML samples, green represents normal samples, and black represents the overall sample. AML, acute myeloid leukemia.
Figure 5.
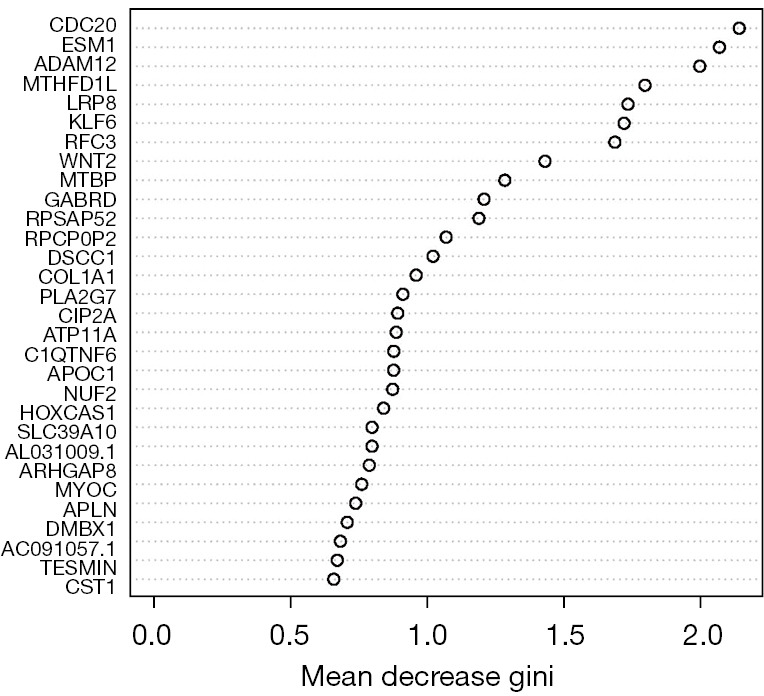
Characteristic gene Gini index. The horizontal axis represents mean decrease Gini, and the vertical axis represents characteristic genes.
Efficiency evaluation of characteristic gene diagnosis
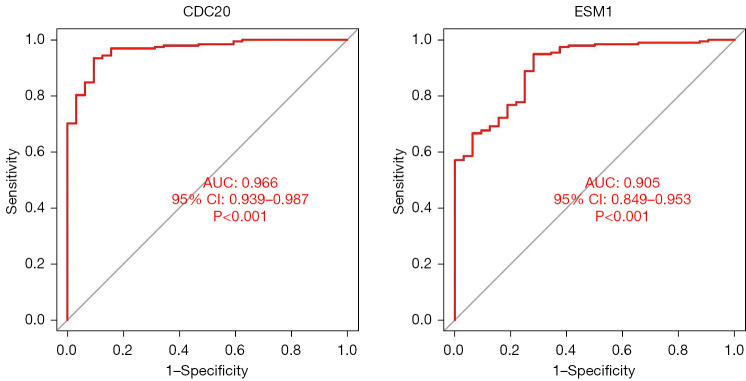
The ROC curve showed that the area under the curve (AUC) of the CDC20 ROC curve was 0.966, and the 95% confidence interval (CI) was 0.939 to 0.987 (P<0.001). The AUC of ESM1 was 0.905 and the 95% CI was 0.849 to 0.953 (P<0.001) (Figure 6).
Figure 6.
ROC curves of CDC20 and ESM1 subjects. The horizontal axis represents 1-specificity, and the vertical axis represents sensitivity. ROC, receiver operator characteristic; AUC, area under the curve; CI, confidence interval.
Correlation between characteristic genes and tumor purity
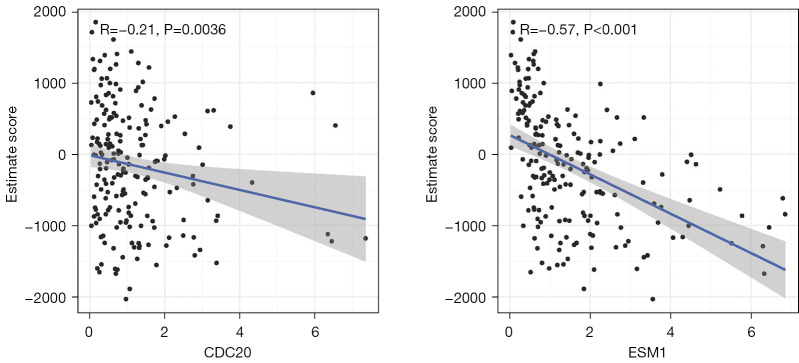
Correlation analysis showed that the expression of CDC20 was negatively correlated with Estimate score in AML (R =−0.21, P=0.0036); ESM1 expression was negatively correlated with Estimate score (R =−0.57, P<0.001) (Figure 7).
Figure 7.
Correlation between CDC20 and EMS1 and Estimate score. The horizontal axis is gene expression, and the vertical axis is the Estimate score.
Discussion
This study screened DEGs through the transcriptome sequencing results of AML samples. The GO enrichment analysis illustrated that the DEGs of AML were significantly enriched in functional items such as positive regulation of cell promotion, protein, and immune response. These items are closely related to the occurrence and function of tumors. The key process of malignant tumor proliferation is positive regulation of cell proliferation, and proteolysis and immune response inhibition are involved in tumor proliferation and invasion. The KEGG pathway enrichment analysis indicated that AML DEGs were significantly enriched in p53 signal pathway, TNF signal pathway, HIF-1 signal pathway, and other signal pathways. These pathways are common pathways for the progression of malignant tumors and are involved in regulating gastric cancer, bladder cancer, lung cancer, liver cancer, leukemia, and other malignant tumors. The results of GO enrichment analysis and KEGG pathway enrichment analysis showed that the DEGs of AML screened of this study were representative, which may be the key pathogenic genes of AML, participating in the regulation of tumor cell proliferation and invasion as well as in the occurrence and progression of AML.
The random forest algorithm was used to screen the characteristic genes in the DEG set. We identified CDC20 and ESM1 as characteristic genes of AML based on a Gini index greater than 2. Both CDC20 and ESM1 were shown to have good diagnostic efficacy for AML, and AUC was greater than 0.9. We also found that CDC20 and ESM1 were positively correlated with the Estimate score. The results indicated that the higher the expression of CDC20 and ESM1, the more tumor cells, and the lower the infiltration content of stromal cells and immune cells. In AML, CDC20 and ESM1 play a cancer-promoting role, suggesting that CDC20 and ESM1 may promote the proliferation of tumor cells and inhibit the infiltration of immune cells and gene cells.
The CDC20 gene is an activator of the mitotic spindle assembly checkpoint. Its main biological role is to regulate the cell cycle and promote apoptosis (10,11). Anaphase-promoting complex (APC) is activated by CDC20 to form a complex, which destroys the ubiquitination of its downstream cell cycle regulators securin and cyclin B. The complex plays an important role in the transition period from metaphase to anaphase of mitosis (12). The process of apoptosis is closely related to anti-apoptotic factors and pro-apoptotic factors. We know that CDC20 regulates apoptosis by targeting Mcl-1 and Bim (13), and it is generally considered a cancer-promoting factor. In AML cell lines, a previous study (14) found that overexpression of CDC20 in myeloid cells could accelerate apoptosis and inhibit granulocyte differentiation. The CDC20 protein was expressed in the late G1 phase of the cell cycle, and the expression was the largest in the G2 stage. The induced expression of CDC20 can lead to the early transition of cells from the G1 phase to the S phase. In addition to AML, CDC20 is highly expressed in other malignant tumors, including gastric cancer, Bladder cancer, liver cancer, lung cancer and breast cancer. It promotes cancer cell proliferation, invasion, and migration (15-18). Other studies (19) have pointed out that CDC20 is related to the stem of tumor cells and promotes the invasion and renewal of tumor stem cells by regulating the activity of its downstream pluripotency related transcription factor Sox2. At present, there have been drug applications targeting CDC20. For example, Apcin is a specific inhibitor of CDC20 (20), which may have broad application prospects in AML.
Fewer studies have investigated the correlation between ESM1 and AML. However, ESM1 is highly expressed in tumors such as lung cancer, uterine cancer, renal cell carcinoma, liver cancer, glioblastoma, and breast cancer. Evidence has suggested that ESM1 is directly involved in tumor progression, which significantly affects the proliferation and migration of head and neck cancer, gastric cancer, nasopharyngeal carcinoma, colorectal cancer, and liver cancer cells (21-25). Studies have shown that ESM1 can be used as a prognostic marker in triple-negative breast cancer (21,26). It may be that ESM1 promotes tumor invasion and migration by regulating tumor angiogenesis (27).
There are some flaws in our study. First, this study lacks external data to verify the diagnostic efficacy of trait genes. Second, this study pointed out that CDC20 and ESM1 may promote the proliferation of tumor cells and inhibit the infiltration of immune cells and gene cells. This needs to be confirmed by in vitro and in vivo experiments.
In conclusion, 1,494 AML DEGs were identified through the public database. The genes CDC20 and ESM1 were identified as AML characteristic genes by a random forest algorithm. Both CDC20 and ESM1 have good diagnostic efficacy for AML and are potential biological markers.
Acknowledgments
Funding: None.
Ethical Statement: The authors are accountable for all aspects of the work in ensuring that questions related to the accuracy or integrity of any part of the work are appropriately investigated and resolved. The study was conducted in accordance with the Declaration of Helsinki (as revised in 2013).
Reporting Checklist: The authors have completed the STARD reporting checklist. Available at https://tcr.amegroups.com/article/view/10.21037/tcr-22-1257/rc
Conflicts of Interest: All authors have completed the ICMJE uniform disclosure form (available at https://tcr.amegroups.com/article/view/10.21037/tcr-22-1257/coif). The authors have no conflicts of interest to declare.
(English Language Editor: J. Jones)
References
- 1.Pelcovits A, Niroula R. Acute Myeloid Leukemia: A Review. R I Med J (2013) 2020;103:38-40. [PubMed] [Google Scholar]
- 2.Hwang SM. Classification of acute myeloid leukemia. Blood Res 2020;55:S1-4. 10.5045/br.2020.S001 [DOI] [PMC free article] [PubMed] [Google Scholar]
- 3.DiNardo C, Lachowiez C. Acute Myeloid Leukemia: from Mutation Profiling to Treatment Decisions. Curr Hematol Malig Rep 2019;14:386-94. 10.1007/s11899-019-00535-7 [DOI] [PubMed] [Google Scholar]
- 4.Tabata R, Chi S, Yuda J, et al. Emerging Immunotherapy for Acute Myeloid Leukemia. Int J Mol Sci 2021;22:1944. 10.3390/ijms22041944 [DOI] [PMC free article] [PubMed] [Google Scholar]
- 5.Wojcicki AV, Kasowski MM, Sakamoto KM, et al. Metabolomics in acute myeloid leukemia. Mol Genet Metab 2020;130:230-8. 10.1016/j.ymgme.2020.05.005 [DOI] [PubMed] [Google Scholar]
- 6.Bohl SR, Bullinger L, Rücker FG. Epigenetic therapy: azacytidine and decitabine in acute myeloid leukemia. Expert Rev Hematol 2018;11:361-71. 10.1080/17474086.2018.1453802 [DOI] [PubMed] [Google Scholar]
- 7.Rücker FG, Du L, Luck TJ, et al. Molecular landscape and prognostic impact of FLT3-ITD insertion site in acute myeloid leukemia: RATIFY study results. Leukemia 2022;36:90-9. 10.1038/s41375-021-01323-0 [DOI] [PMC free article] [PubMed] [Google Scholar]
- 8.Pastore F, Kling D, Hoster E, et al. Long-term follow-up of cytogenetically normal CEBPA-mutated AML. J Hematol Oncol 2014;7:55. 10.1186/s13045-014-0055-7 [DOI] [PMC free article] [PubMed] [Google Scholar]
- 9.Kapp-Schwoerer S, Weber D, Corbacioglu A, et al. Impact of gemtuzumab ozogamicin on MRD and relapse risk in patients with NPM1-mutated AML: results from the AMLSG 09-09 trial. Blood 2020;136:3041-50. 10.1182/blood.2020005998 [DOI] [PubMed] [Google Scholar]
- 10.Wang S, Chen B, Zhu Z, et al. CDC20 overexpression leads to poor prognosis in solid tumors: A system review and meta-analysis. Medicine (Baltimore) 2018;97:e13832. 10.1097/MD.0000000000013832 [DOI] [PMC free article] [PubMed] [Google Scholar]
- 11.He Z, Wu T, Wang S, et al. Pan-cancer noncoding genomic analysis identifies functional CDC20 promoter mutation hotspots. iScience 2021;24:102285. 10.1016/j.isci.2021.102285 [DOI] [PMC free article] [PubMed] [Google Scholar]
- 12.Wang Z, Wan L, Zhong J, et al. Cdc20: a potential novel therapeutic target for cancer treatment. Curr Pharm Des 2013;19:3210-4. 10.2174/1381612811319180005 [DOI] [PMC free article] [PubMed] [Google Scholar]
- 13.Dai L, Song ZX, Wei DP, et al. CDC20 and PTTG1 are Important Biomarkers and Potential Therapeutic Targets for Metastatic Prostate Cancer. Adv Ther 2021;38:2973-89. 10.1007/s12325-021-01729-3 [DOI] [PubMed] [Google Scholar]
- 14.Ding SM, Xu RR, Kan JY, et al. Effects of Arsenic Trioxide on Cdc20 and Mad2 in Acute Myeloid Leukemia HL-60 Cell Line. Zhongguo Shi Yan Xue Ye Xue Za Zhi 2018;26:710-15. [DOI] [PubMed] [Google Scholar]
- 15.Gayyed M F, El-Maqsoud N M, Tawfiek E R, et al. A comprehensive analysis of CDC20 overexpression in common malignant tumors from multiple organs: its correlation with tumor grade and stage Tumour Biol 2016;37:749-762. 10.1007/s13277-015-3808-1 [DOI] [PubMed] [Google Scholar]
- 16.Wang L, Yang C, Chu M, et al. Cdc20 induces the radioresistance of bladder cancer cells by targeting FoxO1 degradation. Cancer Lett 2021;500:172-81. 10.1016/j.canlet.2020.11.052 [DOI] [PubMed] [Google Scholar]
- 17.Yang G, Wang G, Xiong Y, et al. CDC20 promotes the progression of hepatocellular carcinoma by regulating epithelial-mesenchymal transition. Mol Med Rep 2021;24:136. 10.3892/mmr.2021.12122 [DOI] [PMC free article] [PubMed] [Google Scholar]
- 18.Sungwan P, Lert-Itthiporn W, Silsirivanit A, et al. Bioinformatics analysis identified CDC20 as a potential drug target for cholangiocarcinoma. PeerJ 2021;9:e11067. 10.7717/peerj.11067 [DOI] [PMC free article] [PubMed] [Google Scholar]
- 19.Song C, Lowe VJ, Lee S. Inhibition of Cdc20 suppresses the metastasis in triple negative breast cancer (TNBC). Breast Cancer 2021;28:1073-86. 10.1007/s12282-021-01242-z [DOI] [PubMed] [Google Scholar]
- 20.Guo C, Kong F, Lv Y, et al. CDC20 inhibitor Apcin inhibits embryo implantation in vivo and in vitro. Cell Biochem Funct 2020;38:810-6. 10.1002/cbf.3550 [DOI] [PMC free article] [PubMed] [Google Scholar]
- 21.Liu W, Yang Y, He B, et al. ESM1 promotes triple-negative breast cancer cell proliferation through activating AKT/NF-kappaB/Cyclin D1 pathway. Ann Transl Med 2021;9:533. 10.21037/atm-20-7005 [DOI] [PMC free article] [PubMed] [Google Scholar]
- 22.Feng R, Li Z, Wang X, et al. Silenced lncRNA SNHG14 restrains the biological behaviors of bladder cancer cells via regulating microRNA-211-3p/ESM1 axis. Cancer Cell Int 2021;21:67. 10.1186/s12935-020-01717-7 [DOI] [PMC free article] [PubMed] [Google Scholar]
- 23.Cui Y, Guo W, Li Y, et al. Pan-cancer analysis identifies ESM1 as a novel oncogene for esophageal cancer. Esophagus 2021;18:326-38. 10.1007/s10388-020-00796-9 [DOI] [PubMed] [Google Scholar]
- 24.Bender O, Gunduz M, Cigdem S, et al. Functional analysis of ESM1 by siRNA knockdown in primary and metastatic head and neck cancer cells. J Oral Pathol Med 2018;47:40-7. 10.1111/jop.12648 [DOI] [PubMed] [Google Scholar]
- 25.Gu X, Zhang J, Shi Y, et al. ESM1/HIF-1α pathway modulates chronic intermittent hypoxia-induced non-small-cell lung cancer proliferation, stemness and epithelial-mesenchymal transition. Oncol Rep 2021;45:1226-34. 10.3892/or.2020.7913 [DOI] [PubMed] [Google Scholar]
- 26.Jin H, Rugira T, Ko YS, et al. ESM-1 Overexpression is Involved in Increased Tumorigenesis of Radiotherapy-Resistant Breast Cancer Cells. Cancers (Basel) 2020;12:1363. 10.3390/cancers12061363 [DOI] [PMC free article] [PubMed] [Google Scholar]
- 27.Kano K, Sakamaki K, Oue N, et al. Impact of the ESM-1 Gene Expression on Outcomes in Stage II/III Gastric Cancer Patients Who Received Adjuvant S-1 Chemotherapy. In Vivo 2020;34:461-7. 10.21873/invivo.11796 [DOI] [PMC free article] [PubMed] [Google Scholar]


