Abstract
Purpose
To evaluate the value of using left ventricular (LV) long-axis shortening (LAS) derived from coronary CT angiography (CCTA) to predict mortality in patients with severe aortic stenosis (AS) undergoing transcatheter aortic valve replacement (TAVR).
Materials and Methods
Patients with severe AS who underwent CCTA for preprocedural TAVR planning between September 2014 and December 2019 were included in this retrospective study. CCTA covered the whole cardiac cycle in 10% increments. Image series reconstructed at end systole and end diastole were used to measure LV-LAS. All-cause mortality within 24 months of follow-up after TAVR was recorded. Cox regression analysis was performed, and hazard ratios (HRs) are presented with 95% CIs. The C index was used to evaluate model performance, and the likelihood ratio χ2 test was performed to compare nested models.
Results
The study included 175 patients (median age, 79 years [IQR, 73–85 years]; 92 men). The mortality rate was 22% (38 of 175). When adjusting for predictive clinical confounders, it was found that LV-LAS could be used independently to predict mortality (adjusted HR, 2.83 [95% CI: 1.13, 7.07]; P = .03). In another model using the Society of Thoracic Surgeons Predicted Risk of Mortality (STS-PROM), LV-LAS remained significant (adjusted HR, 3.38 [95 CI: 1.48, 7.72]; P = .004), and its use improved the predictive value of the STS-PROM, increasing the STS-PROM C index from 0.64 to 0.71 (χ2 = 29.9 vs 19.7, P = .001). In a subanalysis of patients with a normal LV ejection fraction (LVEF), the significance of LV-LAS persisted (adjusted HR, 3.98 [95 CI: 1.56, 10.17]; P = .004).
Conclusion
LV-LAS can be used independently to predict mortality in patients undergoing TAVR, including those with a normal LVEF.
Keywords: CT Angiography, Transcatheter Aortic Valve Implantation/Replacement (TAVI/TAVR), Cardiac, Outcomes Analysis, Cardiomyopathies, Left Ventricle, Aortic Valve
Supplemental material is available for this article.
© RSNA, 2022
See also the commentary by Everett and Leipsic in this issue.
Keywords: CT Angiography, Transcatheter Aortic Valve Implantation/Replacement (TAVI/TAVR), Cardiac, Outcomes Analysis, Cardiomyopathies, Left Ventricle, Aortic Valve
Summary
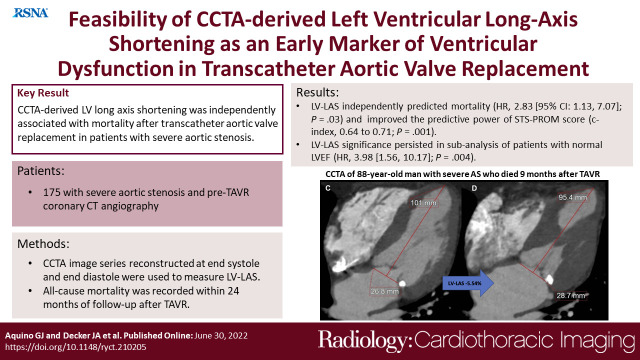
Coronary CT angiography–derived left ventricular long-axis shortening was independently associated with postprocedural mortality in patients with severe aortic stenosis undergoing transcatheter aortic valve replacement and could improve risk stratification.
Key Points
■ It was found that coronary CT angiography–based left ventricular (LV) long-axis shortening (LAS) could be used independently to predict mortality in 175 patients undergoing transcatheter aortic valve replacement (hazard ratio [HR], 2.83 [95% CI: 1.13, 7.07]; P = .03).
■ In patients with a normal LV ejection fraction (n = 138), LV-LAS represented an early sensitive marker for LV function impairment that remained independently associated with mortality (HR, 3.98 [95% CI: 1.56, 10.17]; P = .004).
■ The use of LV-LAS improved the predictive power of the established Society of Thoracic Surgeons Predicted Risk of Mortality score (C index, 0.64 to 0.71; P = .001).
Introduction
In patients with severe aortic stenosis (AS), increased left ventricular (LV) pressure load may lead to ventricular remodeling and fibrosis with consequential LV dysfunction (1,2). To assess LV function, LV ejection fraction (LVEF) can be measured by using transthoracic echocardiography (TTE), cardiac MRI (CMR), or coronary CT angiography (CCTA), and LVEF has been shown to be predictive of outcomes in patients with various cardiac diseases, including patients with severe AS undergoing transcatheter aortic valve replacement (TAVR) (3–6).
TAVR is becoming increasingly available to a broader patient population, as it has also shown benefits in a low-risk population compared with the surgical approach (7). Therefore, it is more important to identify parameters that can be used to stratify patient risk and predict outcomes after TAVR. Because CCTA is required for the preprocedural assessment of patients undergoing TAVR (8), the additional information obtained through CCTA should be used extensively to predict patients’ risks and outcomes. In the investigation of multiphasic CCTA, a growing body of evidence has shown CCTA-based assessment of LV function to be reliable in comparison to the traditional evaluation using echocardiography and CMR (9–15).
Recently, LV global longitudinal strain (GLS) as obtained by using feature tracking has been introduced as a more sensitive parameter of ventricular dysfunction, enabling the detection of subclinical functional impairment, and thus providing incremental prognostic value compared with LVEF in patients with cardiac diseases (10,16–20). Assessment of LV-GLS by using CCTA has been shown to be reliable in comparison to TTE (9,12,14). However, LV-GLS requires substantial postprocessing time and image quality, so a faster, yet accurate, assessment of ventricular longitudinal strain is needed to enable the detection of subclinical LV compromise in patients with severe AS who could benefit from early intervention through TAVR. This could be facilitated by the measurement of LV long-axis shortening (LAS) to provide an easily accessible parameter of LV function (21–23).
In this exploratory study, we assessed different functional LV parameters to evaluate the feasibility of using CCTA-derived LV-LAS as an early marker of LV dysfunction in patients with severe AS undergoing TAVR.
Materials and Methods
Patients
In this retrospective, single-center study, 777 patients with severe AS who underwent TAVR were screened. Inclusion criteria consisted of availability of multiphasic CCTA data before TAVR and outcome data, which were available for 187 patients. All 187 patients initially included in this study underwent preprocedural CCTA between September 2014 and December 2019. Patients who did not undergo TAVR, had insufficient follow-up (<1 month), or had insufficient image quality or coverage of the whole cardiac cycle were excluded from further analysis (Fig 1). At our institution, all patients undergoing TAVR must receive a 1-month follow-up examination. Therefore, those who did not attend this visit were excluded because of insufficient follow-up. Patient data were obtained from electronic medical records. The outcome of all-cause mortality was recorded for up to 24 months after TAVR. Informed consent was waived in this Health Insurance Portability and Accountability Act–compliant study, as per the local institutional review board approval of the study protocol.
Figure 1:
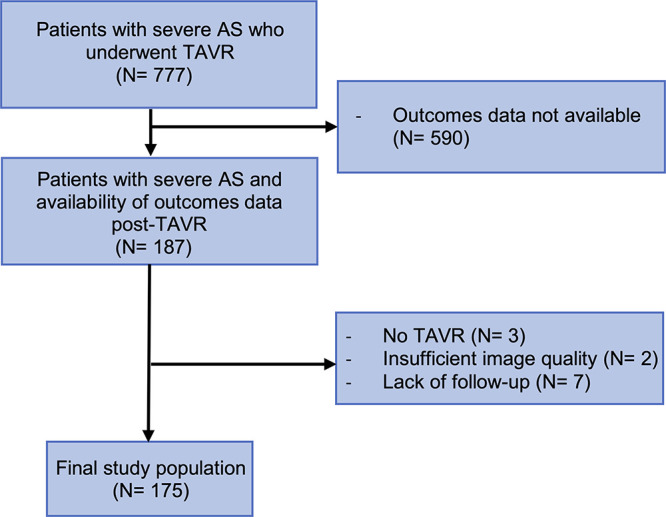
Inclusion flowchart. AS = aortic stenosis, TAVR = transcatheter aortic valve replacement.
CCTA Protocol and Image Analysis
A third-generation dual-source CT system (SOMATOM Force; Siemens Healthineers) with retrospective electrocardiographic gating was used to acquire all CCTA studies. By using a dual-syringe injector (CT Stellant; Medrad), contrast material (iopromide, 370 mg of iodine per milliliter; Bayer) was intravenously injected at a body mass index–dependent dose and injection rate (range, 4–8 mL/sec). A craniocaudal scan was performed from the carina up to the cardiac apex by using the following parameters: detector collimation, 192 × 0.6 mm2; rotation time, 0.25 second; heart rate–dependent pitch; automated tube voltage selection (70–130 kV, CARE kV; Siemens); and automated tube current modulation (CARE dose 4D; Siemens). Multiphasic axial data of the cardiac cycle were acquired in 10% intervals and reconstructed at 1.5-mm thickness.
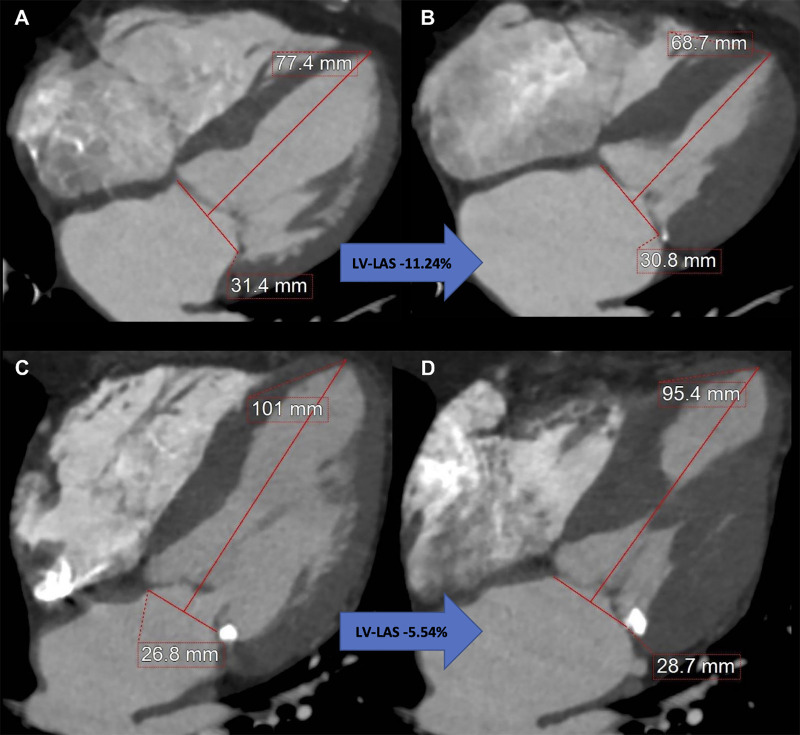
LV-LAS was defined as the relative change of the end-diastolic and the end-systolic distance between the middle of a straight line connecting the mitral valve hinge points and the epicardial border of the LV apex (24) (Fig 2). LV-LAS was calculated by using the following formula:
 |
.
Figure 2:
Measurement of coronary CT angiography–derived left ventricular (LV) long-axis shortening (LAS) using a reconstructed four-chamber view. Images at (A) end diastole and (B) end systole in an 87-year-old woman with LV-LAS of −11.24%, an ejection fraction of 75%, and a Society of Thoracic Surgeons Predicted Risk of Mortality (STS-PROM) of 6.0% who remained alive after undergoing transcatheter aortic valve replacement (TAVR) for severe aortic stenosis. Images at (C) end diastole and (D) end systole in an 88-year-old man with LV-LAS of −5.54%, an ejection fraction of 67%, and an STS-PROM of 3.6% who died 9 months after undergoing TAVR for severe aortic stenosis.
Additionally, we calculated CCTA-derived mitral annular plane systolic excursion (MAPSE) as the difference of the end-systolic and the end-diastolic distance between the lateral mitral annulus and the apex of the LV (25).
While blinded to patient data, a reader (G.J.A.) with 1 year of experience in cardiovascular imaging performed image analysis on dedicated workstations with commercially available software solutions (Aquarius iNtuition Edition version 4.4.12; TeraRecon and syngo.CT Cardiac Function, syngo.via, version VB30A; Siemens). The syngo.via software was used to semiautomatically quantify LVEF and right ventricular EF by correcting automated segmentation errors and LV cardiac output index; additionally, Aquarius iNtuition was used to manually measure LV-LAS and MAPSE on a reconstructed four-chamber view (26). Because of the importance of LVEF in this study, we also collected the echocardiographically derived LVEF and compared it with CT-derived LVEF (Appendix E1 [supplement]).
For intraobserver reproducibility, the first reader repeated the measurements for 20 patients 4 months after the original analysis. A second reader (J.A.D., 5 years of experience in cardiovascular imaging) performed image analysis for 20% of all patients to assess interobserver reproducibility for LV-LAS while being blinded to the first reader’s results and patient data. For interobserver reproducibility, both readers obtained the measurements in successive fashion after the reconstruction of four-chamber views.
Statistical Analysis
Descriptive statistics were used for continuous and categorical variables. Cox regression analysis was performed for survival data, and estimated unadjusted and adjusted hazard ratios (HRs) are presented with 95% CIs. To test for the proportional hazards assumption, time-dependent covariates were analyzed. To adjust for confounders, multivariable analysis included clinical data with a P value less than .10 on univariable analysis. LV-LAS was analyzed in two different models: model 1, which used predictive clinical variables, and model 2, which used the Society of Thoracic Surgeons Predicted Risk of Mortality (STS-PROM). Harrell C index was used as a concordance index for survival analysis. The reason for two different models was that the STS-PROM score already includes all the variables that model 1 comprised. A subgroup analysis was performed in patients with a normal LVEF to assess whether LV-LAS maintained its association with mortality in this particular subgroup.
To assess whether the addition of LV-LAS significantly improved the performance of the predictive models, the likelihood ratio test was performed, and its P value was reported. Kaplan-Meier curves were displayed, and log-rank test was performed to compare the survival distribution of patients with lower LV-LAS with that of patients with higher LV-LAS. Patients were censored at the time of their first event or at their last clinical follow-up. Two-way mixed effects, absolute agreement, and single-rater intraclass correlation coefficients were obtained to evaluate intra- and interobserver reproducibility. Echocardiographically derived right ventricular systolic pressure was not available for all patients but showed significant results in univariable analysis. Therefore, we adjusted for right ventricular systolic pressure in these patients, and the results are shown in Appendix E1 (supplement). A two-tailed P value less than .05 was considered to indicate statistical significance. Statistical analysis was performed with SPSS (version 27; IBM) and R (version 4.0.2; R Foundation for Statistical Computing).
Results
Patient Characteristics
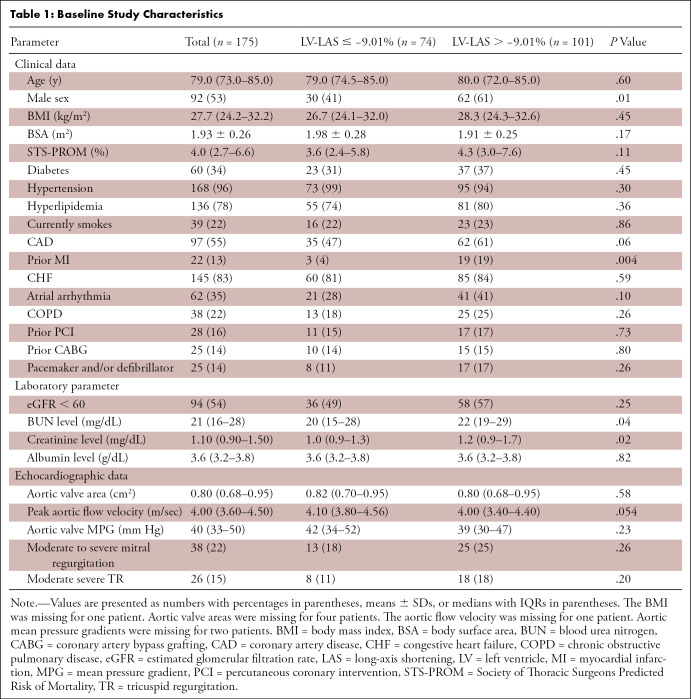
The final study population included 175 patients (median age, 79 years [IQR, 73–85 years]; 92 men) with severe AS who had undergone TAVR (Fig 1). Thirty-eight (22%) patients died after TAVR. The median time of follow-up was 21 months, and the median time between CCTA and TAVR was 43 days. One hundred fifty-seven (89.7%) patients underwent TAVR with a transfemoral approach. Detailed baseline study characteristics are shown in Table 1.
Table 1:
Baseline Study Characteristics
Predictive Value of CCTA-derived LV Parameters
Univariable analysis (Table 2) revealed LV-LAS (HR, 1.14 [95% CI: 1.03, 1.27]; P = .01) and LVEF (HR, 0.98 [95% CI: 0.96, 0.997]; P = .02) as the only LV parameters to be significantly associated with overall mortality. MAPSE did not reach statistical significance for association (HR, 0.91 [95% CI: 0.81, 1.01]; P = .08). Right ventricular EF and LV cardiac index were not predictive of mortality in univariable analysis.
Table 2:
Predictive Value of All CT Measurements
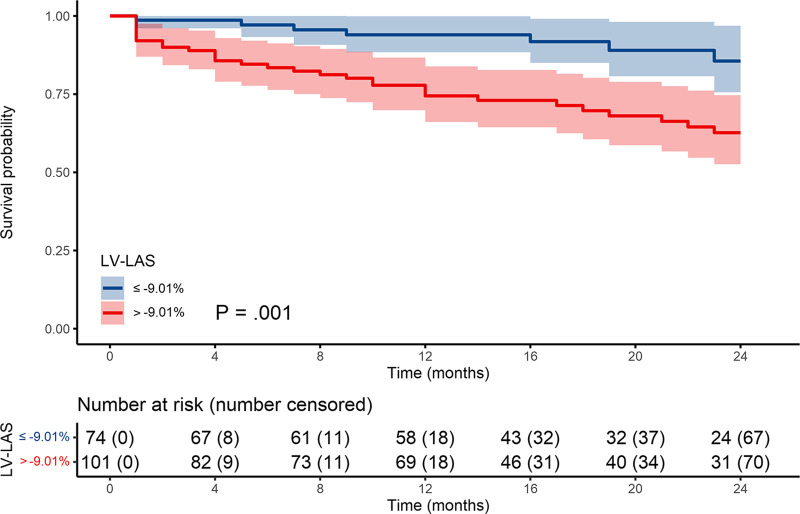
The optimal cutoff to predict overall mortality was −9.01% for LV-LAS (Table 2). There were 101 patients (58%) with LV-LAS greater than −9.01% and 74 patients (42%) with LV-LAS equal to or less than −9.01%. Cumulative survival rates at 12 and 24 months for each group were 75% and 63% (LV-LAS > −9.01%) and 94% and 86% (LV-LAS ≤ −9.01%), respectively (P = .02) (Fig 3).
Figure 3:
Kaplan-Meier survival curves. LAS = long-axis shortening, LV = left ventricle.
Multivariable Analysis for Prediction of All-Cause Mortality
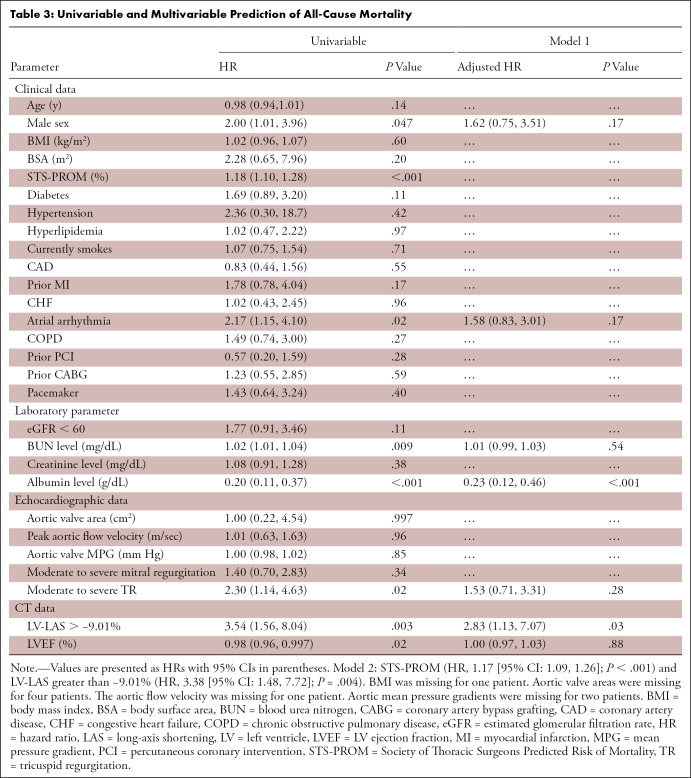
Table 3 shows univariable and multivariable Cox regression analysis for the prediction of all-cause mortality. In the multivariable analysis, LV-LAS greater than −9.01% (HR, 2.83 [95% CI: 1.13, 7.07]; P = .03) remained independently associated with mortality when adjusted for potential confounders. In a second model, adjusted for STS-PROM, LV-LAS greater than −9.01% (HR, 3.38 [95% CI: 1.48, 7.72]; P = .004) also remained independently predictive of mortality.
Table 3:
Univariable and Multivariable Prediction of All-Cause Mortality
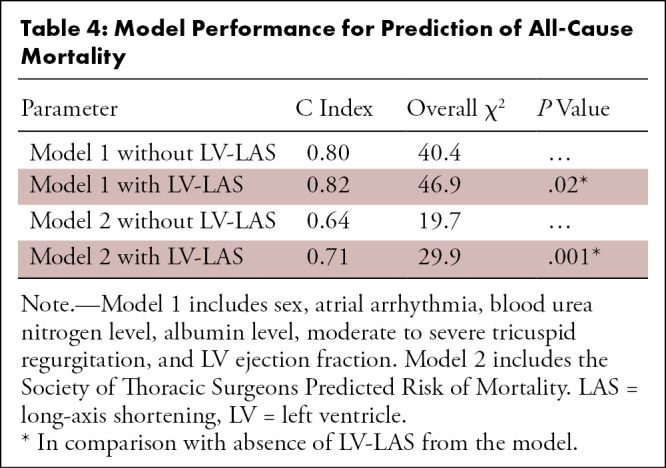
Adding LV-LAS to the first model consisting of other predictive clinical parameters (Table 4) improved its C index from 0.80 to 0.82 for the prediction of mortality (χ2 = 40.4 vs 46.9; P = .02). The use of LV-LAS also improved the predictive value of STS-PROM, increasing its C index from 0.64 to 0.71 (χ2 = 19.7 vs 29.9; P = .001).
Table 4:
Model Performance for Prediction of All-Cause Mortality
Analysis of Patients with Normal LVEF
In a subgroup of 138 patients with normal LVEF (>50%), univariable analysis revealed albumin, atrial arrhythmia, and moderate to severe tricuspid regurgitation to be predictive of all-cause mortality (n = 27) (Table E2 [supplement]). LV-LAS greater than −9.01% maintained significance for mortality prediction after adjustment for these confounders and STS-PROM (Table E3 [supplement]).
Intra- and Interobserver Reproducibility
An intraclass correlation coefficient of 0.92 (95% CI: 0.81, 0.97) demonstrated excellent intraobserver reproducibility for LV-LAS. The mean difference between both reads was −0.27% ± 1.37 (P = .39). An intraclass correlation coefficient of 0.90 (95% CI: 0.80, 0.95) also demonstrated excellent interobserver reproducibility. The mean difference between both observers was −0.02% ± 1.60 (P = .94). Bland-Altman plots are shown in Figure E3 (supplement).
Discussion
This study investigated a CCTA-based assessment of functional LV parameters in patients with severe AS undergoing TAVR. The major findings of this study were as follows: (a) By using a receiver operating characteristic–derived optimal cutoff of −9.01%, CCTA-based LV-LAS was independently predictive of overall mortality in patients undergoing TAVR; (b) in patients with normal LVEF, LV-LAS represented an early sensitive marker for LV function impairment that remained associated with outcomes; and (c) the addition of LV-LAS improved the predictive power of the established clinical STS-PROM, demonstrating its potential to provide additional useful information in preprocedural assessment.
There are various approaches for the evaluation of LV function. LV-LAS, LV-GLS, and MAPSE are known parameters of long-axis deformation and can provide information on LV function in patients at risk for subendocardial fibrosis because LVEF is dependent on both longitudinal and circumferential contraction (27–29). Although LVEF is included in the decision-making of patients with severe AS (30,31), LV-GLS derived by using TTE and CMR has been shown to provide incremental value over LVEF, as it indicates the impairment of ventricular function when LVEF shows normal values (18,32–34). However, assessment of LV-GLS by using feature tracking requires time-consuming postprocessing and adequate image quality. For example, Fukui et al (11) reported that assessment of CCTA-derived GLS was not possible in nearly 30% of cases because of inadequate CCTA image quality. CMR-based LV-LAS has been shown to strongly correlate with feature tracking–derived longitudinal strain, which has additional benefits because of its high interobserver reproducibility and substantial reduction in evaluation time compared with feature-tracking GLS (21,22,24). The diagnostic accuracy obtained by using LV-LAS has also been shown to outperform that obtained by using MAPSE in patients with dilated cardiomyopathy (35). In our cohort, LV-LAS, but not MAPSE, was predictive of overall mortality. This may be explained by the fact that although MAPSE is also a measure of longitudinal function, it takes only absolute changes into account, whereas LV-LAS represents a relative indicator of longitudinal shortening proportional to dimensions of the LV, thus making it more sensitive to smaller changes.
In our study cohort composed of patients undergoing TAVR, we showed that LV-LAS can also be assessed by using CCTA data. The assessment of LV-LAS as a marker of ventricular function is easy to perform and to implement in clinical routine, as only end-systolic and end-diastolic four-chamber views are needed (23). Because adjustment to the cardiac planes with four-chamber views in the best systole and best diastole series can be automatically obtained by using functional CT data through commercial software solutions, no further postprocessing is needed. As previously reported for CMR-derived LV-LAS (21,24), we also found LV-LAS to show high interobserver agreement when obtained by using CCTA data.
To further analyze the predictive value of LV-LAS, we performed a subgroup analysis of patients with normal LVEF (>50%). As others have reported for LV-GLS derived by using TTE and CMR (10,11,20,32), our study showed LV-LAS to be a predictor of poor outcomes in this subgroup, suggesting that changes in strain precede changes in LVEF. More precisely, patients with normal LVEF but impaired LV-LAS had a nearly fourfold risk of death compared with patients with normal LVEF and normal LV-LAS.
By using a second model adjusted for STS-PROM, we also found LV-LAS to be independently predictive of mortality and to significantly improve the predictive value of STS-PROM. This independence of validated clinical parameters allows for the potential to improve preprocedural risk stratification and postinterventional follow-up; however, this needs to be further assessed by future prospective studies with the availability of validation cohorts.
This study had some limitations. A general limitation of CCTA-derived functional LV parameters is that the temporal resolution in CCTA is limited compared with that in TTE and CMR. As the cardiac cycle is mapped in 10% increments, the measurements made from the best end systole and end diastole captured in the sequence may deviate slightly from true systolic and diastolic values; thus, the LV-LAS might be underestimated if the true maximal and minimal lengths differ from the measured lengths. However, despite this limitation, we showed that LV-LAS is a powerful prognostic predictor even with simple, fixed 10% thresholds. Second, CCTA-derived assessment of LV function requires radiation, in contrast with CMR and echocardiography. However, because CCTA is mandatory for the preprocedural assessment of patients undergoing TAVR (8), all available data should be analyzed and used for patient risk stratification, especially in view of growing evidence that may lead to an extension of the recommendation for TAVR in lower-risk patients with severe AS (7). Third, for interobserver reproducibility of LV-LAS, the four-chamber view was created by only one of the two observers (26). This process resembles how TTE and CMR data are evaluated (ie, a standardized four-chamber plane selection is typically made by technologists and interpreted afterward). Nonetheless, intraobserver reproducibility obtained 4 months after the initial measurements, with the regeneration of four-chamber views, was excellent, showing that following the standardized approach could maintain a low measurement variability. LV-LAS is strongly dependent on a standardized plane selection, which could be addressed in the future by software-assisted automatic plane selection and/or fully automated quantification using artificial intelligence that has the potential to be integrated with most imaging software (36). Fourth, there is a possibility of selection bias, as outcome data were not available for all 777 consecutive patients who had undergone TAVR at our institution. Finally, this was a single-center, retrospective feasibility study, limiting the generalizability of our results. Further prospective multicenter studies with external validation are needed to confirm our findings.
In conclusion, in a subset of patients with severe AS for whom outcome data were available, LV-LAS was an independent predictor of all-cause mortality after TAVR, including for those with normal LVEF, and can be simply assessed by using preprocedural, functional CCTA data. The implementation of LV-LAS in preinterventional assessment could provide more functional information than is currently used in severe AS.
G.J.A. and J.A.D. contributed equally to this work.
Authors declared no funding for this work.
Disclosures of conflicts of interest: G.J.A. Recently approved as a member of the trainee editorial board for Radiology: Cardiothoracic Imaging, but was not a trainee editorial board member at the time of the writing of this article. J.A.D. No relevant relationships. U.J.S. Consultant for and/or receives research support from Bayer, Bracco, Elucid Bioimaging, Guerbet, HeartFlow, and Siemens Healthcare; editor-in-chief of Journal of Thoracic Imaging; member of Radiology: Cardiothoracic Imaging editorial board. L.C. No relevant relationships. N.P. No relevant relationships. B.Y. No relevant relationships. V.B. No relevant relationships. A.L.E. Leadership or fiduciary role in Women in Cardiothoracic Surgery Committee of EACTS and Nachwuchskommission Herzchirurgie DGTHG. F.S. No relevant relationships. J.R.B. No relevant relationships. R.B. Research support from Siemens Healthineers, paid to institution; honoraria from Siemens Healthineers, paid to author; meeting travel support from Siemens Healthineers. A.V.S. Grants or contracts from Siemens, paid to institution; consulting fees from Bayer and Elucid Bioimaging, paid to author. T.E. Speaker honoraria from Siemens Healthineers; travel support from Siemens Healthineers; participation on advisory board for Siemens Healthineers; member of Clinical Practice Committee, Society of Magnetic Resonance Imaging.
Abbreviations:
- AS
- aortic stenosis
- CCTA
- coronary CT angiography
- CMR
- cardiac MRI
- GLS
- global longitudinal strain
- HR
- hazard ratio
- LAS
- long-axis shortening
- LV
- left ventricle
- LVEF
- LV ejection fraction
- MAPSE
- mitral annular plane systolic excursion
- STS-PROM
- Society of Thoracic Surgeons Predicted Risk of Mortality
- TAVR
- transcatheter aortic valve replacement
- TTE
- transthoracic echocardiography
References
- 1. Puls M , Beuthner BE , Topci R , et al . Impact of myocardial fibrosis on left ventricular remodelling, recovery, and outcome after transcatheter aortic valve implantation in different haemodynamic subtypes of severe aortic stenosis . Eur Heart J 2020. ; 41 ( 20 ): 1903 – 1914 . [DOI] [PMC free article] [PubMed] [Google Scholar]
- 2. D’Andrea A , Padalino R , Cocchia R , et al . Effects of transcatheter aortic valve implantation on left ventricular and left atrial morphology and function . Echocardiography 2015. ; 32 ( 6 ): 928 – 936 . [DOI] [PubMed] [Google Scholar]
- 3. Levy WC , Mozaffarian D , Linker DT , et al . The Seattle Heart Failure Model: prediction of survival in heart failure . Circulation 2006. ; 113 ( 11 ): 1424 – 1433 . [DOI] [PubMed] [Google Scholar]
- 4. Nicod P , Gilpin E , Dittrich H , et al . Influence on prognosis and morbidity of left ventricular ejection fraction with and without signs of left ventricular failure after acute myocardial infarction . Am J Cardiol 1988. ; 61 ( 15 ): 1165 – 1171 . [DOI] [PubMed] [Google Scholar]
- 5. van Gils L , Clavel M-A , Vollema EM , et al . Prognostic implications of moderate aortic stenosis in patients with left ventricular systolic dysfunction . J Am Coll Cardiol 2017. ; 69 ( 19 ): 2383 – 2392 . [DOI] [PubMed] [Google Scholar]
- 6. Taniguchi T , Morimoto T , Shiomi H , et al . Prognostic impact of left ventricular ejection fraction in patients with severe aortic stenosis . JACC Cardiovasc Interv 2018. ; 11 ( 2 ): 145 – 157 . [DOI] [PubMed] [Google Scholar]
- 7. Mack MJ , Leon MB , Thourani VH , et al . Transcatheter aortic-valve replacement with a balloon-expandable valve in low-risk patients . N Engl J Med 2019. ; 380 ( 18 ): 1695 – 1705 . [DOI] [PubMed] [Google Scholar]
- 8. Blanke P , Weir-McCall JR , Achenbach S , et al . Computed tomography imaging in the context of transcatheter aortic valve implantation (TAVI)/transcatheter aortic valve replacement (TAVR): an expert consensus document of the Society of Cardiovascular Computed Tomography . JACC Cardiovasc Imaging 2019. ; 12 ( 1 ): 1 – 24 . [DOI] [PubMed] [Google Scholar]
- 9. Ammon F , Bittner D , Hell M , et al . CT-derived left ventricular global strain: a head-to-head comparison with speckle tracking echocardiography . Int J Cardiovasc Imaging 2019. ; 35 ( 9 ): 1701 – 1707 . [DOI] [PubMed] [Google Scholar]
- 10. Fukui M , Gupta A , Abdelkarim I , et al . Association of structural and functional cardiac changes with transcatheter aortic valve replacement outcomes in patients with aortic stenosis . JAMA Cardiol 2019. ; 4 ( 3 ): 215 – 222 . [DOI] [PMC free article] [PubMed] [Google Scholar]
- 11. Fukui M , Xu J , Abdelkarim I , et al . Global longitudinal strain assessment by computed tomography in severe aortic stenosis patients - feasibility using feature tracking analysis . J Cardiovasc Comput Tomogr 2019. ; 13 ( 2 ): 157 – 162 . [DOI] [PubMed] [Google Scholar]
- 12. Marwan M , Ammon F , Bittner D , et al . CT-derived left ventricular global strain in aortic valve stenosis patients: a comparative analysis pre and post transcatheter aortic valve implantation . J Cardiovasc Comput Tomogr 2018. ; 12 ( 3 ): 240 – 244 . [DOI] [PubMed] [Google Scholar]
- 13. Miskinyte E , Bucius P , Erley J , et al . Assessment of global longitudinal and circumferential strain using computed tomography feature tracking: intra-individual comparison with CMR feature tracking and myocardial tagging in patients with severe aortic stenosis . J Clin Med 2019. ; 8 ( 9 ): 1423 . [DOI] [PMC free article] [PubMed] [Google Scholar]
- 14. Szilveszter B , Nagy AI , Vattay B , et al . Left ventricular and atrial strain imaging with cardiac computed tomography: validation against echocardiography . J Cardiovasc Comput Tomogr 2020. ; 14 ( 4 ): 363 – 369 . [DOI] [PubMed] [Google Scholar]
- 15. Wang R , Fang Z , Wang H , et al . Quantitative analysis of three-dimensional left ventricular global strain using coronary computed tomography angiography in patients with heart failure: comparison with 3T cardiac MR . Eur J Radiol 2021. ; 135 : 109485 . [DOI] [PubMed] [Google Scholar]
- 16. Kusunose K , Goodman A , Parikh R , et al . Incremental prognostic value of left ventricular global longitudinal strain in patients with aortic stenosis and preserved ejection fraction . Circ Cardiovasc Imaging 2014. ; 7 ( 6 ): 938 – 945 . [DOI] [PubMed] [Google Scholar]
- 17. Magne J , Cosyns B , Popescu BA , et al . Distribution and prognostic significance of left ventricular global longitudinal strain in asymptomatic significant aortic stenosis: an individual participant data meta-analysis . JACC Cardiovasc Imaging 2019. ; 12 ( 1 ): 84 – 92 . [DOI] [PubMed] [Google Scholar]
- 18. Ng ACT , Prihadi EA , Antoni ML , et al . Left ventricular global longitudinal strain is predictive of all-cause mortality independent of aortic stenosis severity and ejection fraction . Eur Heart J Cardiovasc Imaging 2018. ; 19 ( 8 ): 859 – 867 . [DOI] [PubMed] [Google Scholar]
- 19. Wang Y , Wang Q , Cao J , et al . Cardiovascular magnetic resonance mapping and strain assessment for the diagnosis of cardiac involvement in idiopathic inflammatory myopathy patients with preserved left ventricular ejection fraction . J Thorac Imaging 2021. ; 36 ( 4 ): 254 – 261 . [DOI] [PubMed] [Google Scholar]
- 20. Vollema EM , Sugimoto T , Shen M , et al . Association of left ventricular global longitudinal strain with asymptomatic severe aortic stenosis: natural course and prognostic value . JAMA Cardiol 2018. ; 3 ( 9 ): 839 – 847 . [DOI] [PMC free article] [PubMed] [Google Scholar]
- 21. Leng S , Tan R-S , Zhao X , Allen JC , Koh AS , Zhong L . Validation of a rapid semi-automated method to assess left atrial longitudinal phasic strains on cine cardiovascular magnetic resonance imaging . J Cardiovasc Magn Reson 2018. ; 20 ( 1 ): 71 . [DOI] [PMC free article] [PubMed] [Google Scholar]
- 22. Leng S , Tan R-S , Zhao X , Allen JC , Koh AS , Zhong L . Fast long-axis strain: a simple, automatic approach for assessing left ventricular longitudinal function with cine cardiovascular magnetic resonance . Eur Radiol 2020. ; 30 ( 7 ): 3672 – 3683 . [DOI] [PubMed] [Google Scholar]
- 23. Schuster A , Backhaus SJ , Stiermaier T , et al . Fast manual long-axis strain assessment provides optimized cardiovascular event prediction following myocardial infarction . Eur Heart J Cardiovasc Imaging 2019. ; 20 ( 11 ): 1262 – 1270 . [DOI] [PubMed] [Google Scholar]
- 24. Riffel JH , Andre F , Maertens M , et al . Fast assessment of long axis strain with standard cardiovascular magnetic resonance: a validation study of a novel parameter with reference values . J Cardiovasc Magn Reson 2015. ; 17 ( 1 ): 69 . [DOI] [PMC free article] [PubMed] [Google Scholar]
- 25. Newman K , Wilson R , Roberts JM , et al . Tricuspid annular plane systolic excursion for the evaluation of right ventricular function in functional cardiac CT compared to MRI . Clin Radiol 2021. ; 76 ( 8 ): 628.e1 – 628.e7 . [DOI] [PubMed] [Google Scholar]
- 26. Lu MT , Ersoy H , Whitmore AG , Lipton MJ , Rybicki FJ . Reformatted four-chamber and short-axis views of the heart using thin section (≤2 mm) MDCT images . Acad Radiol 2007. ; 14 ( 9 ): 1108 – 1112 . [DOI] [PMC free article] [PubMed] [Google Scholar]
- 27. Cameli M , Mondillo S , Righini FM , et al . Left ventricular deformation and myocardial fibrosis in patients with advanced heart failure requiring transplantation . J Card Fail 2016. ; 22 ( 11 ): 901 – 907 . [DOI] [PubMed] [Google Scholar]
- 28. Haland TF , Almaas VM , Hasselberg NE , et al . Strain echocardiography is related to fibrosis and ventricular arrhythmias in hypertrophic cardiomyopathy . Eur Heart J Cardiovasc Imaging 2016. ; 17 ( 6 ): 613 – 621 . [DOI] [PMC free article] [PubMed] [Google Scholar]
- 29. Hu K , Liu D , Herrmann S , et al . Clinical implication of mitral annular plane systolic excursion for patients with cardiovascular disease . Eur Heart J Cardiovasc Imaging 2013. ; 14 ( 3 ): 205 – 212 . [DOI] [PubMed] [Google Scholar]
- 30. Baumgartner H , Falk V , Bax JJ , et al . 2017 ESC/EACTS guidelines for the management of valvular heart disease . Eur Heart J 2017. ; 38 ( 36 ): 2739 – 2791 . [DOI] [PubMed] [Google Scholar]
- 31. Writing Committee Members ; Otto CM , Nishimura RA , et al . 2020 ACC/AHA guideline for the management of patients with valvular heart disease: a report of the American College of Cardiology/American Heart Association Joint Committee on clinical practice guidelines . J Am Coll Cardiol 2021. ; 77 ( 4 ): e25 – e197 . [Published correction appears in J Am Coll Cardiol 2021;77(4):509.] [DOI] [PubMed] [Google Scholar]
- 32. Dahl JS , Magne J , Pellikka PA , Donal E , Marwick TH . Assessment of subclinical left ventricular dysfunction in aortic stenosis . JACC Cardiovasc Imaging 2019. ; 12 ( 1 ): 163 – 171 . [DOI] [PubMed] [Google Scholar]
- 33. Klaeboe LG , Haland TF , Leren IS , et al . Prognostic value of left ventricular deformation parameters in patients with severe aortic stenosis: a pilot study of the usefulness of strain echocardiography . J Am Soc Echocardiogr 2017. ; 30 ( 8 ): 727 – 735 . e1 . [DOI] [PubMed] [Google Scholar]
- 34. Stokke TM , Hasselberg NE , Smedsrud MK , et al . Geometry as a confounder when assessing ventricular systolic function: comparison between ejection fraction and strain . J Am Coll Cardiol 2017. ; 70 ( 8 ): 942 – 954 . [DOI] [PubMed] [Google Scholar]
- 35. Arenja N , Riffel JH , Andre F , Katus HA , Buss SJ . Assessment of longitudinal shortening in cardiomyopathies with cardiac magnetic resonance . Curr Cardiovasc Imaging Rep 2017. ; 10 ( 9 ): 30 . [Google Scholar]
- 36. Wittenberg R , van Vliet JW , Ghaye B , Peters JF , Schaefer-Prokop CM , Coche E . Comparison of automated 4-chamber cardiac views versus axial views for measuring right ventricular enlargement in patients with suspected pulmonary embolism . Eur J Radiol 2012. ; 81 ( 2 ): 218 – 222 . [DOI] [PubMed] [Google Scholar]


