Abstract
Background: Hepatocellular carcinoma (HCC) is one of the leading causes of tumor-related death. MicroRNAs (miRNAs) belong to a subfamily of functional non-coding RNAs (ncRNAs) and are essential regulators of tumorigenesis. They affect tumor-related therapeutic response, tumor metastasis, and clinical outcomes of several human malignant tumors. However, the prognostic value of miRNAs and their role in the tumor immune microenvironment (TIME) of HCC have not been clarified. Materials and methods: Raw RNA-sequencing data (mRNA and miRNA) and clinicopathological characteristics of HCC samples were downloaded from the TCGA-GDC database. The Perl programming language, R software, Cytoscape software, and several online databases were used to clarify the clinical significance and biological functions of miRNAs and their target genes in HCC. Results: A total of 424 mRNA-sequencing samples and 425 miRNA-sequencing samples were obtained from the TCGA database. There were 344 HCC cases with complete information in the TCGA dataset and they were randomly categorized into two subgroups. Six miRNAs were identified as independent prognostic biomarkers for HCC patients by univariate and multivariate Cox regression analysis. The constructed prognostic signature, which contains these six miRNAs, was significantly correlated with overall survival (OS). In addition, this prognostic signature is superior to single miRNA in predicting short-term prognosis of HCC patients. We also found that the prognostic signature was significantly associated with tumor-related immune cell infiltration, TIME, and immunotherapeutic response. Furthermore, a total of 4568 potential target genes of six miRNAs were identified. The miRNA-mRNA co-expression network, protein-protein interaction (PPI) network, and functional and pathway enrichment analysis demonstrated that these miRNA-related target genes have important biological effects during the initiation and progression of HCC. Conclusions: This study demonstrates that the miRNA signature can accurately predict the prognosis of HCC patients and provide a basis for novel immunotherapy treatments.
Keywords: Hepatocellular carcinoma, miRNA, prognosis, tumor immune microenvironment, immunotherapeutic response
Introduction
Primary liver cancer is common and is the third leading cause of tumor-related deaths globally [1,2]. Hepatocellular carcinoma (HCC) is the predominant histological subtype of primary liver cancer, accounting for more than 75% of liver cancer. The development of HCC is a long and multi-step process, with chronic hepatitis caused by varied etiological factors progressing to cirrhosis and then malignant tumors [3,4]. Hepatitis B and C viral infection [5,6], alcohol intake [7] and cirrhosis [8] are three major risk factors of HCC and explain 80% of HCC occurrence and progression. Radical surgical resection is the main potentially curative treatment for HCC. However, the overall survival (OS) is not satisfactory, with a median OS of no more than 1 year in the United States [9,10]. Therefore, it is crucial to explore the mechanism of tumorigenesis and develop novel prediction biomarkers of the prognosis for patients with HCC so as to improve individualized treatments.
MicroRNAs (miRNAs) are a group of functional non-coding RNAs (ncRNAs) and are essential regulators of gene expression at the post-transcriptional level [11]. They affect a series of genetic pathways, including apoptosis, cell proliferation, and cell cycle checkpoints [12,13]. The differential expression of miRNAs between tumor and normal tissues is involved in the pathogenesis of human malignant tumors, including HCC [14], ovarian cancer [15], nasopharyngeal carcinoma [16], and osteosarcoma [17]. Up-regulated or down-regulated expression of target genes is critical for tumor initiation and metastasis. Moreover, increasing evidence has confirmed that dysregulation of miRNAs could also serve as a prognostic biomarker to predict OS of patients with malignant tumors [18,19]. Since the discovery of the first miRNA in 1993, a series of miRNAs, such as hsa-let-7a, hsa-miR-155, hsa-miR-223, and hsa-miR-224, were discovered successively and they were found to function as tumor-related suppressors and prognostic biomarkers for clinical outcome prediction of human malignant tumors [20-23].
In this study, the expression levels and prognostic value of miRNAs in HCC were systematically analyzed by several comprehensive bioinformatics analysis tools. Then, six miRNAs were identified as independent prognostic factors by univariate and multivariate Cox regression to construct a prognostic signature for predicting the OS of HCC patients. The prognostic signature was an independent prognostic indicator and was significantly associated with tumor-related immune cell infiltration, tumor immune microenvironment (TIME), and immunotherapeutic response. Finally, the target genes of six miRNAs and their functions were explored, providing new insights into the molecular mechanism and management of HCC.
Materials and methods
Data collection and processing
The raw RNA-sequencing transcriptomic data (mRNAs and miRNAs) and corresponding clinicopathological characteristics of HCC samples were downloaded from TCGA (The Cancer Genome Atlas) (https://portal.gdc.cancer.gov; until March 3, 2021) database. The “Perl programming language” (version strawberry-perl-5.32.1.1; https://www.perl.org) was used to obtain the expression profile for each raw RNA-sequencing transcriptomic data. Moreover, the data of 377 HCC patients with clinicopathological characteristics were extracted using Perl programming language. In our study, 344 HCC cases from the TCGA dataset were included and 33 cases were excluded due to survival time less than 30 days (n = 27) or the lack of complete miRNA expression information (n = 6). All patients were randomly categorized into two groups (training group = 172, testing group = 172) via the “caret” package with the function of creating data partitions (Table 1).
Table 1.
Clinical features of the hepatocellular carcinoma patient in TCGA cohort
| Characteristic | Variable | n (%) |
|---|---|---|
| Age | <60 years | 172 (45.6%) |
| ≥60 years | 204 (54.1%) | |
| Not available | 1 (0.3%) | |
| Gender | Male | 122 (32.4%) |
| Female | 255 (67.6%) | |
| Histological grade | G1 | 55 (14.6%) |
| G2 | 180 (47.7%) | |
| G3 | 124 (32.9%) | |
| G4 | 13 (3.5%) | |
| Gx | 5 (1.3%) | |
| Stage | Stage I | 175 (46.4%) |
| Stage II | 87 (23.1%) | |
| Stage III | 86 (22.8%) | |
| Stage IV | 5 (1.3%) | |
| Not available | 24 (6.4%) | |
| T classification | T1 | 185 (49.0%) |
| T2 | 95 (25.2%) | |
| T3 | 81 (21.5%) | |
| T4 | 13 (3.5%) | |
| Tx | 3 (0.8%) | |
| N classification | N0 | 257 (68.1%) |
| N1 | 4 (1.1%) | |
| Nx | 116 (30.8%) | |
| M classification | M0 | 272 (72.1%) |
| M1 | 4 (1.1%) | |
| Mx | 101 (26.8%) | |
| Survival status | Dead | 128 (34.0%) |
| Alive | 249 (66.0%) |
TCGA, The Cancer Genome Atlas.
Differential expression analysis
The abnormal expression of mRNAs and miRNAs in paracancerous tissues and HCC samples were screened using the Wilcoxon test in R (version R 3.6.3, https://www.r-project.org/). The false discovery rate (FDR) < 0.05 and |log2 FC (Fold change)| ≥ 2 were defined as criteria for mRNA, and FDR < 0.05 and |log2 FC| ≥ 1 were the thresholds for miRNA. Subsequently, the “edgeR” and “pheatmap” packages in R software were used to map the volcano plot of all abnormally expressed mRNAs or miRNAs and the heatmap of top 20 up-regulated or down-regulated differentially expressed mRNAs or miRNAs in HCC samples and paracancerous tissues.
Cox regression analysis and survival analysis of single miRNA
To assess the relationship between miRNA expression level and OS in HCC patients, a univariate Cox regression model was established for the training cohort. Eighteen significant miRNAs (P < 0.05) were selected for the multivariate Cox regression model construction. Six candidate miRNAs strongly correlated with OS in HCC patients were identified. The potential correlation between these miRNAs was also explored. We used the “heatmap” package to explore the association between the expression levels of these six miRNAs and clinicopathological characteristics in HCC patients. These candidate miRNAs were then subjected to survival analysis using the “survival” package in R software. The receiver operating characteristic (ROC) curve and area under the curve (AUC) were used to assess the sensitivity and specificity of the six miRNAs for predicting the short-term survival of HCC patients.
Construction and assessment of the prognostic miRNA-based signature
The six candidate miRNAs identified by univariate and multivariate Cox regression analysis were used to calculate the risk score for each HCC patient in the training dataset. The computational formula was as follows: Risk score = Σ n i=1 Coef (i) × x (i), where Coef (i) and x (i) represent the coefficient based on multivariate Cox regression analysis and the expression level of each miRNA, respectively. Subsequently, the HCC patients were categorized into the lowrisk group and high-risk group with taking the median risk scores of the training group, testing group, and the entire as cut-off values. The “survival” and “survival ROC” packages in R software were used to build the Kaplan-Meier (K-M) survival curve and the time-dependent ROC (Td-ROC) curve for the training group, testing group, and the entire. These curves were applied to evaluate the prognostic accuracy for each HCC patient. Furthermore, the dot plot was employed to display the survival status of each patient, and the accuracy of the risk score in predicting the survival of HCC patients was verified. The heatmap was used to display differences in expression levels between two risk subgroups, and the association of expression levels with clinicopathological features was assessed using the log-rank test. Principal component analysis (PCA) and t-distributed stochastic neighbor embedding (t-SNE) were further performed to display the different distribution states between two risk subgroups. To further evaluate whether the miRNA-based prognostic signature was an independent indicator for OS, we constructed the univariate and multivariate Cox regression model by “survival” packages in R software. The Cox regression model can be used to evaluate whether these clinicopathological variables such as age, sex, histologic neoplasm grade, TMN-classification, and prognostic signature containing six miRNAs were related to patient survival outcomes. P < 0.05 was considered to indicate statistical significance.
Construction of nomogram and decision curve analysis
To further verify the benefits of the miRNA signature in clinical utilization, a nomogram was developed to predict clinical outcomes of HCC patients based on two independent prognostic factors, namely miRNA signature and clinicopathological stage. Both factors were significant in univariate and multivariate Cox regression analysis. The calibration curves were assessed to exhibit the discrimination between actual clinical outcomes and nomogram-predicted outcomes of patients with HCC. Furthermore, we conducted decision curve analysis (DCA) to show the benefits of miRNA signature and clinical stage. Without interference variables, the line of “None” would present the expected net benefit, and the line of “All” would show the expected net benefit for patients who received interventions.
Immune status and immune function analysis
The single-sample gene set enrichment analysis (ssGSEA) algorithm can characterize the infiltration level of immune cells and the activity of immune-related pathways in a single tumor sample based on the expression levels of immune cell-specific markers. In this study, ssGSEA analysis was performed using the “limma”, “GSVA”, and “GSEABase” packages of R software. Furthermore, based on the Estimation of STromal and immune cells in Malignant Tumor tissues using the Expression data (ESTIMATE) algorithm, the ESTIMATE score can be obtained. The stromal and immune scores for patients in the high- and low-risk subgroups can be obtained using CIBERSORT, which is an algorithm for analyzing the infiltration level of immune cells in tumor tissues based on transcriptome data. The relationship between miRNA signature and 22 tumor-related immune cells was also explored by the CIBERSORT algorithm. Furthermore, we also analyzed the association between miRNA signature and chemotactic activities for tumor-related immune cells.
Immunotherapy response analysis
To investigate the role of miRNA signature in predicting immunotherapy response based on immune checkpoint blockades (ICBs), the difference and correlation between the expression of ICBs and human leukocyte antigen (HLA) key genes in two risk subgroups were explored. Tumor mutational burden (TMB) and microsatellite instability (MSI) were important predictors for immunotherapy response with higher efficiency than other clinicopathological features. The TMB analysis and MSI analysis were combined to explore the potential associations between the constructed signature and immunotherapy response in HCC. Furthermore, the tumor immune dysfunction and exclusion (TIDE) algorithm was applied to predict the immunotherapy response of the two risk subgroups.
Prediction of prognosis-related miRNA target genes
The prognosis-related miRNA target genes were selected based on the following criteria: at least in two of the following databases, namely TargetScan (Release 7.2, http://www.targetscan.org/vert_72), miRTarBase (Release 8.0, http://mirtarbase.cuhk.edu.cn), and miRDB (version 6.0, http://mirdb.org) databases. Subsequently, the Venn diagram was applied to display the overlapping target genes in the three online databases based on the “VennDiagram” package in R software. In addition, the GO (Gene Ontology) term functional analysis and KEGG (Kyoto Encyclopedia of Genes and Genomes) pathway enrichment analysis were performed for miRNA-related target genes.
The miRNA-target gene network and the PPI network
The Cytoscape (version 3.8.2, www.cytoscape.org/) was used to visualize the interaction network of prognosis-related miRNAs and corresponding target genes. According to the requirement that the minimum of the interaction should be greater than 0.4, the potential protein-protein interaction (PPI) network of the miRNA-related target genes was constructed using STRING (https://string-db.org/) online database. In addition, the CytoHubba plugin in Cytoscape software was adopted to select the core gene network, and the function-genes network was explored using GeneMANIA (http://www.genemania.org) online database.
Construction of a lncRNA-miRNA-mRNA regulatory axis
Differential expression of the six miRNAs related target genes was analyzed between the normal and tumor tissues using the GEPIA2 (http://gepia2.cancer-pku.cn) database, with P < 0.01 and |log2 fold change (FC)| ≥1.0. Subsequently, the upstream lncRNAs of these miRNAs were predicted using ENCORI (https://starbase.sysu.edu.cn/) database. Unfortunately, data on hsa-miR-5003-3p is not available in the ENCORI database. GEPIA2 database was also used to detect the differential expression levels of these predicted lncRNAs between HCC and normal tissues. We extracted as above differentially expressed RNAs to construct mRNA-miRNA-lncRNA network.
Comprehensive analysis of hub target genes
To further explore the association of biological function of hub target genes with the initiation and progression of HCC, a comprehensive analysis of the hub target genes was performed. First, cBioPortal (https://www.cbioportal.org) online database was used to explore the genetic mutation levels in HCC tissues, and then datasets from TCGA (372 samples, PanCancer Atlas) was applied for the next analysis. Subsequently, gene differential expression was analyzed using the GEPIA2 database. A total of 369 HCC and 160 normal liver tissue specimens were obtained from the TCGA and Genotype-Tissue Expression Portal (GTEx) datasets. Results were considered statistically significant when P < 0.01 and |log2 FC| > 1. Finally, two hub target genes (FOS and GNAO1) were identified as the differentially expressed genes (DEGs) between HCC tissues and normal liver tissues. The Human Protein Atlas (HPA, https://www.proteinatlas.org/) database was used to assess the protein expression level of the two DEGs in HCC tissues and normal liver tissues. The association between the mRNA expression levels of two DEGs with clinicopathological stages of HCC patients was explored using GEPIA2. TIMER (https://cistrome.shinyapps.io/timer/) is a web server for exploring the infiltration of tumor-related immune cells. In this study, the online database STRING was used to analyze the association between the two DEGs and the immune cell infiltration. Since the immune-checkpoint inhibitors (ICIs) based on PD-L1 (CD274), PD-1 (CD279/PDCD1), and CTLA4 have become an important part of cancer immunotherapies, we comprehensively explored the correlation between the two DEGs and these three ICIs using the TISIDB (http://cis.hku.hk/TISIDB/index.php) database.
Quantitative real-time polymerase chain reaction (qRT-PCR)
To validate the expression levels of six hub miRNAs in HCC cells, we explored the expression level of six miRNAs in HepG2 cells and HEK293T cells using qRT-PCR. The primer sequences for qRT-PCR are provided in Table 2. According to the manufacturer’s instructions, the total RNAs from HepG2 cells and HEK293T cells were extracted using a Takara PrimeScript RT reagent kit (RR037A) (Takara, Japan). Then, the complementary DNA (cDNA) synthesis based on total RNAs was performed using the Takara PrimeScript RT reagent kit. Afterward, the qRT-PCR was employed using a ViiA 7 Dx RT-PCR System (Applied Biosystems, Foster City, USA).
Table 2.
MicroRNA (miRNA) primers used for qPCR
| miRNA | Forward primer | Reverse primer | Reverse transcription primer |
|---|---|---|---|
| hsa-miR-326 | GCCTCTGGGCCCTTC | GTTGTGGTTGGTTGGTTTGT | GGTTGTGGTTGGTTGGTTTGTATACCACAACCCTGGAG |
| hsa-miR-30d-5p | GCGTGTAAACATCCCCGAC | AGTGCAGGGTCCGAGGTATT | GTCGTATCCAGTGCAGGGTCCGAGGTATTCGCACTGGATACGACCTTCCA |
| hsa-let-7c-5p | GCGCGTGAGGTAGTAGGTTGT | AGTGCAGGGTCCGAGGTATT | GTCGTATCCAGTGCAGGGTCCGAGGTATTCGCACTGGATACGACAACCAT |
| hsa-miR-5003-3p | CGCGCGTACTTTTCTAGGTTG | AGTGCAGGGTCCGAGGTATT | GTCGTATCCAGTGCAGGGTCCGAGGTATTCGCACTGGATACGACCCCCAA |
| hsa-miR-760 | GCGGCTCTGGGTCTG | TCCTCCTCTTCCTCTCCATT | GTCCTCCTCTTCCTCTCCATTATGAGGAGGACTCCCCA |
| hsa-miR-7-5p | AGGGTGGAAGACTAGTGATTT | GCCTCATCACCTCAACCTAA | GGCCTCATCACCTCAACCTAAATGATGAGGCCACAACA |
Statistical analysis
All statistical analysis was performed using R version 3.6.3. The Mann-Whitney U test was used for continuous variables, and the chi-square test was used for categorical variables, respectively. The survival analysis was calculated using the Kaplan-Meier method with log-rank test. Correlation coefficient from the Spearman rank correlation analysis. Univariate and multivariate Cox proportional hazard regression analyses were used to identify independent prognostic factors. P < 0.05 was considered statistically significant.
Results
Identification of differentially expressed miRNAs and mRNAs in HCC
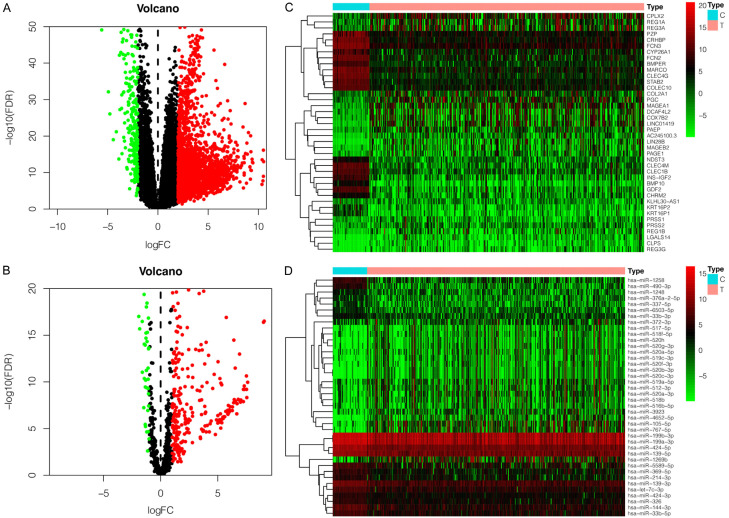
A total of 424 mRNA-sequencing samples (374 tumors and 50 paracancerous tissues) and 425 miRNAs-sequencing samples (375 tumors and 50 paracancerous tissues) were included for further bioinformatics analysis. By analyzing the RNA-sequencing data, we identified 2419 differentially expressed mRNAs (2161 up-regulated expressions and 258 down-regulated expressions) and 300 differentially expressed miRNAs (260 up-regulated expressions and 40 down-regulated expressions). The volcano plots of abnormally expressed mRNA and miRNA are shown in Figure 1A, 1B, and the heatmaps of top 20 up-regulated or down-regulated differentially expressed mRNAs and miRNAs are shown in Figure 1C, 1D.
Figure 1.
The differentially expressed miRNAs and mRNAs in HCC tissues. Upregulated expression (red); downregulated expression (blue). A. The volcano plot of differentially expressed mRNAs. B. The volcano plot of differentially expressed miRNAs. C. The heatmap of top 20 upregulated/downregulated differently expressed mRNA. D. The heatmap of top 20 upregulated/downregulated differently expressed miRNA.
Identification of independent risk miRNAs and survival analysis of single miRNA in HCC
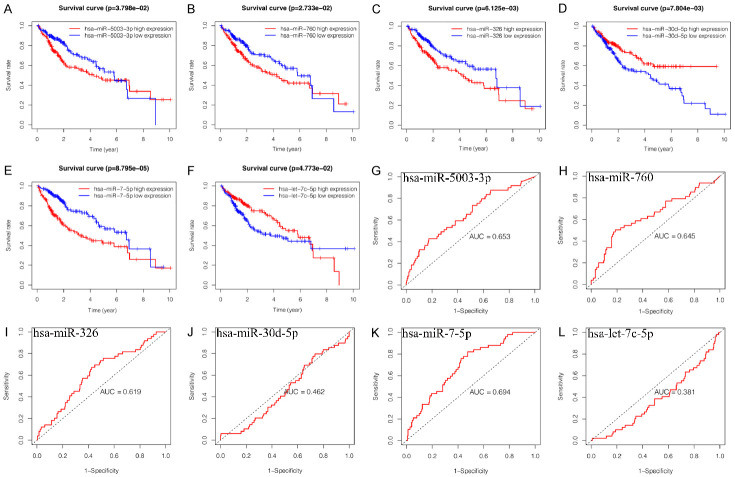
We identified the independent risk miRNAs by univariate and multivariate COX regression analysis. The univariate COX regression analysis showed that expression of 18 miRNAs were significantly correlated with OS of HCC patients (P < 0.05, Figure 2A). The multivariate COX regression analysis presented that six miRNAs, including hsa-miR-326 (P = 0.025, HR = 1.32, 95% CI: 1.03-1.68), hsa-miR-30d-5p (P = 0.051, HR = 0.77, 95% CI: 0.60-1.00), hsa-let-7c-5p (P = 0.007, HR = 0.76, 95% CI: 0.62-0.93), hsa-miR-5003-3p (P = 0.055, HR = 1.30, 95% CI: 0.99-1.71), hsa-miR-760 (P = 0.104, HR = 1.23, 95% CI: 0.96-1.57) and hsa-miR-7-5p (P = 0.018, HR = 1.30, 95% CI: 1.04-1.61) were independent prognostic factors for HCC and good candidates for prognostic signature construction (Figure 2B). Among these independent prognostic miRNAs, hsa-miR-30d-5p and hsa-let-7c-5p were considered as protective factors (HR < 1), while hsa-miR-326, hsa-miR-5003-3p, hsa-miR-760 and hsa-miR-7-5p were considered as risk factors (HR > 1). In order to explore the correlation between these miRNAs, we calculated the coefficients of miRNAs in each sample. Correlation analysis showed that the expression of hsa-miR-760 was positively correlated with hsa-miR-5003-3p, hsa-miR-7-5p and negatively correlated with hsa-let-7c-5p. Moreover, there was a positive correlation between hsa-miR-326, hsa-let-7c-5p, hsa-miR-760 and hsa-miR-5003-3p, and the correlation between hsa-miR-326 and has-miR-30d-5p was negative (Figure S1A, S1B). Afterward, we assessed the relationship between the expression of these six miRNAs and clinicopathological characteristics of HCC patients. The results indicated that these miRNAs had significant effects on the initiation and progression of HCC (Figure S2). K-M survival curve is a visual tool used by clinicians to predict prognostic power. As shown in Figure 3A-F, high expression of hsa-miR-5003-3p (P = 3.798e-02), hsa-miR-760 (P = 2.733e-02), hsa-miR-326 (P = 6.125e-03), and hsa-let-7c-5p (P = 4.773e-02) indicated short OS of HCC patients, while high expression of hsa-miR-30d-5p (P = 7.804e-03) and hsa-miR-7-5p (P = 8.795e-05) indicated long OS. We then performed a ROC curve analysis and calculated the AUC of these six miRNAs for 1-year OS (Figure 3G-L).
Figure 2.
The results of the univariate and multivariate COX proportional hazard regression analyses. A. Univariate COX analysis to identify the prognosis-related factors. B. Multivariate COX analysis to identify the prognosis-related factors.
Figure 3.
Kaplan-Meier survival curves and receiver operating characteristic for six prognosis-related miRNAs. (A-F) Kaplan-Meier survival curves, (G-L) Receiver operating characteristic, (A, G) hsa-miR-5003-3p, (B, H) hsa-miR-760, (C, I) hsa-miR-326, (D, J) hsa-miR-30d-5p, (E, K) hsa-miR-7-5p, (F, L) hsa-let-7c-5p.
Construction of prognostic signature based on six miRNAs
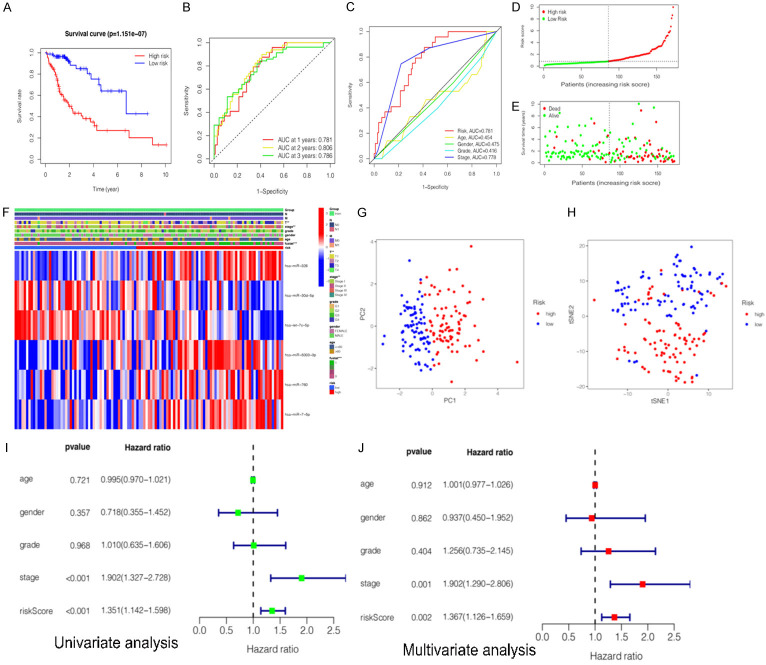
To further explore the relationship between the miRNA expression and the prognosis of HCC patients, six miRNAs (hsa-miR-5003-3p, hsa-miR-760, hsa-miR-326, hsa-let-7c-5p, hsa-miR-30d-5p, and hsa-miR-7-5p) were selected based on the multivariate COX regression analysis to construct the prognostic signature. Risk score (prognostic signature) = (0.275193671 × expression level of hsa-miR-326) + (-0.255664678 × expression value of hsa-miR-30d-5p) + (-0.273074476 × expression value of hsa-let-7c-5p) + (0.265755663 × expression value of hsa-miR-5003-3p) + (0.204810683 × expression value of hsa-miR-760) + (0.25904901 × expression value of hsa-miR-7-5p). Subsequently, HCC patients were classified into the high-risk group and low-risk group based on the median risk scores of the training group, testing group and the entire as cut-off values. Furthermore, we assessed the associations between clinicopathological characteristics and prognostic signature (Table 3). The statistical analysis showed that six-miRNA signature based on risk scores was related with gender (P = 0.011), histological grade (P = 0.024), clinical stage (P < 0.001), T classification (P < 0.001), N classification (P = 0.019), and survival status (P < 0.001). Kaplan-Meier survival analysis showed that clinical outcomes were significantly better in the low-risk subgroup than in the high-risk subgroup (P = 1.151e-07) (Figure 4A).
Table 3.
Clinicopathological features of the HCC patients in TCGA cohort and the relationship between clinicopathological features and miRNA signature
| characteristics | Variable | n (%) | Risk Score based on miRNA signature | χ2 | P | |
|---|---|---|---|---|---|---|
|
| ||||||
| High-Risk | Low-Risk | |||||
| Age | ≤ 60 | 166 (48.3%) | 88 | 78 | 0.207 | 0.667 |
| > 60 | 178 (51.7%) | 90 | 88 | |||
| Gender | Male | 236 (68.6%) | 111 | 125 | 6.679 | 0.011 |
| Female | 108 (31.4%) | 67 | 41 | |||
| Histological grade | G1 | 53 (15.4%) | 20 | 33 | 10.682a | 0.024 |
| G2 | 160 (46.5%) | 77 | 83 | |||
| G3 | 114 (33.1%) | 71 | 43 | |||
| G4 | 13 (3.8%) | 8 | 5 | |||
| Not available | 4 (1.2%) | 2 | 2 | |||
| Stage | I | 162 (47.1%) | 62 | 100 | 29.425a | p < 0.001 |
| II | 77 (22.4%) | 41 | 36 | |||
| III | 80 (23.3%) | 59 | 21 | |||
| IV | 3 (0.9%) | 2 | 1 | |||
| Not available | 22 (6.5%) | 14 | 8 | |||
| T classification | T1 | 169 (49.1%) | 65 | 104 | 31.327a | P < 0.001 |
| T2 | 84 (24.4%) | 47 | 37 | |||
| T3 | 75 (21.8%) | 54 | 21 | |||
| T4 | 13 (3.8%) | 11 | 2 | |||
| Not available | 3 (0.9%) | 1 | 2 | |||
| M classification | M0 | 248 (72.1%) | 133 | 115 | 1.826a | 0.418 |
| M1 | 3 (0.9%) | 2 | 1 | |||
| Not available | 93 (27.0%) | 43 | 50 | |||
| N classification | N0 | 241 (70.0%) | 135 | 106 | 6.711a | 0.019 |
| N1 | 3 (0.9%) | 2 | 1 | |||
| Not available | 100 (29.1%) | 41 | 59 | |||
| Survival status | Dead | 117 (34.0%) | 91 | 26 | 48.126 | P < 0.001 |
| Alive | 227 (66.0%) | 87 | 140 | |||
denotes that Fisher’s exact test was applied when there were at least 1 expected count less than 5.
HCC, Hepatocellular carcinoma, TCGA, The Cancer Genome Atlas.
Figure 4.
Construction and evaluation of a prognostic miRNA-related signature for hepatocellular carcinoma (HCC) in training cohort. A. Kaplan-Meier survival curves for the high- and low-risk subgroups. B. Time dependent receiver operating characteristic (ROC) curves of prognostic signature predicting the overall survival (OS) at 1-, 2-, and 3-years. C. ROC curves for prognostic signature and other clinicalpathological characteristics in predicting the OS of HCC patients. D. Distribution of miRNA-related risk score between the high- and low-risk subgroups. E. Distribution of survival status of HCC patients in high- and low-risk subgroups. F. Heatmap showed the relationship between the expression levels of six miRNAs and other clinicopathological factors. G, H. Principal component analysis (PCA) and t-distributed stochastic neighbor embedding (t-SNE) of prognostic signature between the high-risk and low-risk subgroups. I. Univariate Cox regression analyses of prognostic signature and other clinicopathological characteristics. J. Multivariate Cox regression analyses prognostic signature and other clinicopathological characteristics.
Effectiveness validation of the prognostic signature
Several methods were applied to validate the prognostic efficiency of miRNA signature in HCC patients. Firstly, ROC analysis was employed to assess the sensitivity and specificity of the prognostic signature in training datasets. The AUC values were 0.781, 0.806, 0.786 for 1-, 2-, 3-year survival, respectively (Figure 4B). The results also showed that the prognostic signature was significantly associated with OS and outperformed single miRNA in terms of efficiency in predicting the short-term prognosis of HCC patients. The AUC value of risk score was 0.781. It was significantly higher than that of age (AUC = 0.454), gender (AUC = 0.475), clinical stage (AUC = 0.778), or clinical grade (AUC = 0.416) (Figure 4C), indicating high specificity and sensitivity of the prognostic signature. Secondly, the distribution of risk scores and survival status of HCC patients in high-risk and low-risk subgroups are presented (Figure 4D, 4E). It can be seen that patients with low risk scores had a larger survival rate than those with high risk scores. Thirdly, the heatmap was presented. It was found that the expression levels of hsa-miR-326, hsa-miR-5003-3p, hsa-miR-760, and hsa-miR-7-5p (risk factors with HR > 1) were higher in the high-risk subgroup, while the expression levels of hsa-let-7c-5p, and hsa-miR-30d-5p (protective factors with HR < 1) were higher in the low-risk subgroup. In addition, the expressions of the six miRNAs were associated with survival status (P < 0.001), clinical stage (P < 0.01), and T classification (P < 0.01) (Figure 4F). Fourthly, the results of t-SNE (t-distributed stochastic neighbor embedding) and PCA (principal component analysis) were analyzed and it was demonstrated that patients with different risk scores were well-differentiated into two clusters (Figure 4G, 4H). Fifthly, the univariate and multivariate COX analysis was conducted and it was indicated that risk score (P = 0.002, HR = 1.367, 95% CI: 1.126-1.659) and the clinical stage (P = 0.001, HR = 1.902, 95% CI: 1.290-2.806) were independent prognostic factors for OS (Figure 4I, 4J).
Internal validation of the prognostic signature
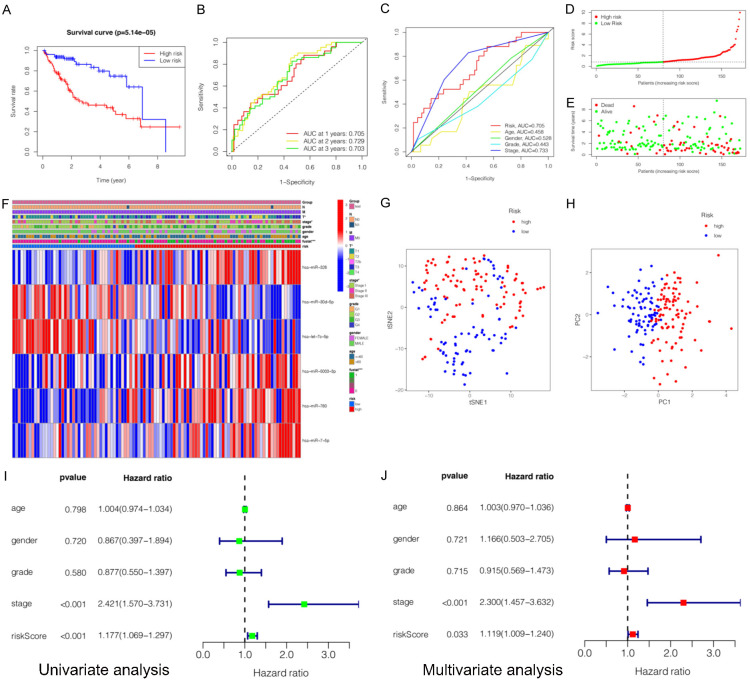
To confirm that the constructed prognostic signature based on six miRNAs has similar accuracy in predicting the OS of HCC patients in different datasets, the testing group (172 HCC patients) and the entire group (344 HCC patients with complete survival information) were enrolled as the validation datasets. Firstly, we analyzed the impact of miRNA signature on HCC patient prognosis using the K-M curve. As expected, the miRNA signature significantly affected the OS in the testing group (P = 5.141e-05) (Figure 5A) and the entire group (P = 9.966e-11) (Figure S3A). Moreover, the ROC curves were also applied to investigate whether the miRNA signature could predict OS in HCC. The AUC values (AUC > 0.7) in the testing group and the entire group were high (AUC > 0.7), indicating moderate sensitivity and specificity of the miRNA signature (Figures 5B, 5C, S3B, S3C). Secondly, the risk score distribution and the survival status of each HCC patient in two groups were plotted, and the relationship between the expression of the six miRNAs and clinicopathological characteristics was displayed, which was similar to that in the training group (Figures 5D-F, S3D-F). Thirdly, in order to verify the grouping result, we further analyzed the two risk subgroups by PCA and t-SNE. The results also demonstrated a distinction between the high-risk subgroup and the low-risk subgroup (Figures 5G, 5H, S3G, S3H). Additionally, we performed univariate and multivariate Cox regression analyses and found that both risk score and stage were prognostic factors for HCC patients in the testing group and the entire group regardless of other clinical variables (Figures 5I, 5J, S3I, S3J).
Figure 5.
Validation and evaluation prognostic miRNA-related signature for hepatocellular carcinoma (HCC) in testing cohort. A. Kaplan-Meier survival curves for the high- and low-risk subgroups. B. Time dependent receiver operating characteristic (ROC) curves of prognostic signature predicting the overall survival (OS) at 1-, 2-, and 3-years. C. ROC curves for prognostic signature and other clinicalpathological characteristics in predicting the OS of HCC patients. D. Distribution of miRNA-related risk score between the high- and low-risk subgroups. E. Distribution of survival status of HCC patients in high- and low-risk subgroups. F. Heatmap showed the relationship between the expression levels of six miRNAs and other clinicopathological factors. G, H. Principal component analysis (PCA) and t-distributed stochastic neighbor embedding (t-SNE) of prognostic signature between the high-risk and low-risk subgroups. I. Univariate Cox regression analyses of prognostic signature and other clinicopathological characteristics. J. Multivariate Cox regression analyses prognostic signature and other clinicopathological characteristics.
Construction of the nomogram and DCA
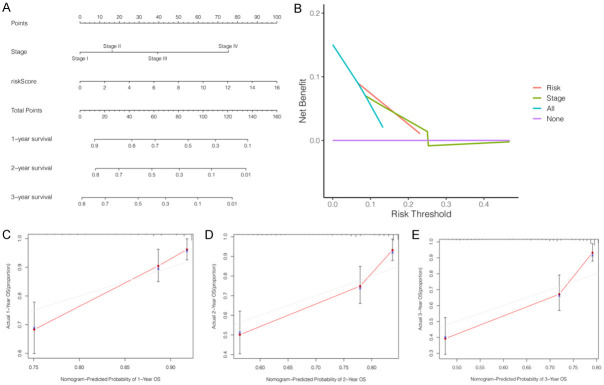
Independent prognostic factors identified by univariate and multivariate Cox regression analyses were used to construct a nomogram for predicting OS in HCC patients for 1, 3 and 5 years (Figure 6A). Furthermore, calibration curves for predicting OS for 1, 3, and 5 years and DCA showed that the miRNA signature had high predictive accuracy and significant clinical potential (Figure 6B-E).
Figure 6.
Construction of a nomogram and decision curve analysis (DCA) for predicting the overall survival (OS) in HCC patients. A. Nomogram for predicting the OS at 1-, 2-, and 3-years. B. DCA for the risk score (pastel-orange lines) and clinical stage (pea green lines). C-E. The calibration curves exhibited discrimination of the nomogram for 1-, 2-, and 3-years.
Comparison of the immune activity and TIME between two subgroups
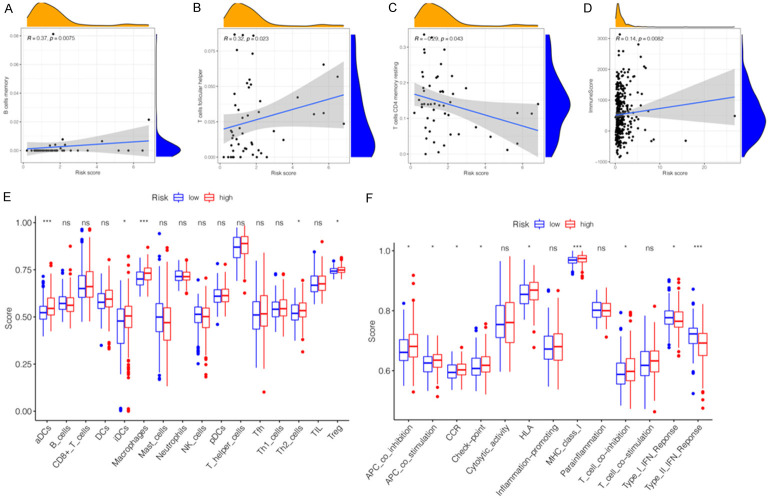
An increasing number of studies indicated that tumorigenesis is also affected by TIME. Therefore, it is necessary to explore the impact of miRNA signature on TIME in HCC tissues. The miRNAs regulate tumor-related immune cells that affect the tumor-infiltrating lymphocytes (TILs), which are the ultimate targets of tumor immunotherapy based on ICBs. According to the correlation analysis, three TILs were significantly correlated with the six-miRNA signature. Among them, B-cell memory (R = 0.37, P = 0.0075) and T-cell follicular helper (R = 0.32, P = 0.023) were positively correlated with the signature (Figure 7A, 7B). In contrast, T-cell CD4 memory resting (R = -0.29, P = 0.043) was negatively correlated with the miRNA signature (Figure 7C). In order to further explore whether there was an association between other tumor-infiltrating immune cells (TIICs), immune functions, and miRNA signature, we used ssGSEA to compare the enrichment scores of the activities of TIICs and immune functions in two risk subgroups. According to Figure 7E, patients in the high-risk subgroup had higher infiltration levels of TIICs, especially in aDCs, immature dendritic cells (iDCs), macrophages, T helper 2 (Th2)-cells, and regulatory T cells (Treg). The infiltration abundance of 22 tumor-related immune cells in each patient in the two subgroups was presented in Figure S4A, S4B. Except the Type-I and Type-II interferon (IFN) response function pathways, immune function pathways including APC-co-inhibition, APC-co-stimulation, CCR, check-point, HLA, MHC-class-I, and T-cell co-inhibition presented higher activity in the high-risk subgroup than in the low-risk subgroup (Figure 7F). Many of these factors, including CXCL chemokines and CCL chemokines are important for regulation and chemotaxis of immune cells, especially monocytes/macrophages, T lymphocyte and Eosinophils. As listed in Table 4, the present miRNAs signature was significantly positively correlated with monocytes/macrophages related chemokines (CCL3, CCL8, and CCL13), mast cells related chemokines (CCR1, CCR3, and CXCR4) eosinophils related chemokines (CCL26, CCL13, and CCL3) and neutrophils related chemokines (CXCL8). These findings partially support that the present miRNAs signature is positively linked to immune cell infiltration and chemotactic activities. Additionally, the association between TIME and miRNA signature was also explored. Difference and correlation analyses showed that TumorPurity (Figure S4C, P = 0.300), ImmuneScore (Figure S4D, P = 0.056), StromalScore (Figure S4E, P = 0.540), and ESTIMATEScore (Figure S4F, P = 0.300) in the high- and low-risk subgroups had no significant difference. As shown in Figure 7D, there was a significant positive correlation between the ImmuneScore (R = 0.14, P = 0.0082) and miRNA signature. However, ESTIMATEScore (Figure S4G, R = 0.08, P = 0.14), StromalScore (Figure S4H, R = 0.033, P = 0.55), and TumorPurity (Figure S4I, R = -0.08, P = 0.14) were not significantly associated between high- and low-risk subgroups. Therefore, the present signature might reflect the status of TIICs in the TIME of HCC tissues.
Figure 7.
Immune cells infiltration and immune pathway enrichment between high-risk groups and low-risk groups. (A-C) The correlations between B cells memory (A), T-cells follicular helper (B), T-cells CD4 memory resting (C) and risk scores. (D) The correlation between immune score and risk scores. (E) The scores of 16 immune cells between high- and low-risk subgroups are showed in boxplots. (F) The scores of 13 immune-related functions between high- and low-risk subgroups is showed in boxplots. ns, not significant, *P < 0.05, **P < 0.01, ***P < 0.001.
Table 4.
The correlation between miRNAs signature and chemotactic activity for immune cells
| Immune cells | Chemokine | R-value | P-value |
|---|---|---|---|
| Monocytes/macrophages | CCL2 | 0.03 | 0.69 |
| CCL3 | 0.31 | 5.70E-05 | |
| CCL5 | 0.12 | 0.14 | |
| CCL7 | 0.12 | 0.11 | |
| CCL8 | 0.15 | 0.046 | |
| CCL13 | 0.25 | 8.70E-04 | |
| CCL17 | 0.0053 | 0.95 | |
| CCL22 | 0.11 | 0.14 | |
| T lymphocyte | CCL2 | 0.03 | 0.69 |
| CCL1 | 0.13 | 0.087 | |
| CCL22 | 0.11 | 0.14 | |
| CCL17 | 0.0053 | 0.95 | |
| Mast cells | CCR1 | 0.22 | 4.10E-03 |
| CCR2 | 0.022 | 0.78 | |
| CCR3 | 0.24 | 1.60E-03 | |
| CCR4 | 0.076 | 0.33 | |
| CCR5 | 0.14 | 0.073 | |
| CXCR2 | 0.077 | 0.32 | |
| CXCR4 | 0.25 | 1.40E-03 | |
| Eosinophils | CCL11 | 0.092 | 0.24 |
| CCL24 | -0.016 | 0.83 | |
| CCL26 | 0.28 | 2.20E-04 | |
| CCL5 | 0.12 | 0.14 | |
| CCL7 | 0.12 | 0.11 | |
| CCL13 | 0.25 | 8.70E-04 | |
| CCL3 | 0.31 | 5.70E-05 | |
| Neutrophils | CXCL8 | 0.15 | 0.046 |
P value less than 0.05 is shown in bold.
Comparison of immunotherapy response between two subgroups
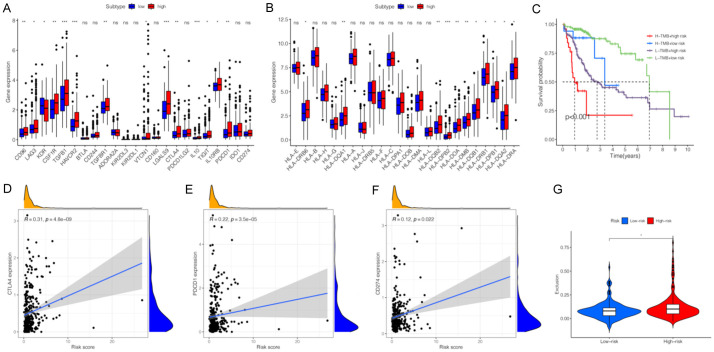
To explore the role of the constructed signature in the immunotherapy response to HCC, we evaluated the association between miRNA signature and ICB-related genes as well as HLA-related genes. In addition to KDR (VEGFR-2), ICB related genes, including CD96, LAG3, KDR, CSF1R, TGFB1, HAVCR2, TGFBR1, VTCN1, LGALS9, CTLA4, IL10, TIGIT, IL10RB, and PDCD1 (PD-1), showed higher expression levels in the high-risk subgroup than in the low-risk subgroup (Figure 8A). These findings indicated that the signature could be used as an indicator to assess the immunotherapy response. Furthermore, 11 of 24 HLA-related genes showed significant differential expression between two risk subgroups (Figure 8B). ICBs based on PD-L1, PD-1, and CTLA4 have become therapeutic pillars in cancer immunotherapies. Therefore, we performed a comprehensive analysis of the correlation between the constructed signature and three ICBs. The expressions of PD-L1 (R = 0.12, P = 0.022), PD-1 (R = 0.22, P = 3.5e-05), and CTLA4 (R = 0.31, P = 4.8e-09) were significantly positively correlated with the signature (Figure 8D, 8E). The TMB is considered a promising indicator for predicting the tumor immunotherapy response to ICB and is significantly related to TIME. We assessed the TMB values of HCC patients from TCGA datasets and found that there was no significant difference in the two risk subgroups and TMB values were not associated with the signature (Figure S5A). However, the K-M curve indicated that the miRNA signature combined with TMB had a potential predictive value for the prognosis of HCC patients (Figure 8C, P < 0.001). The TIDE algorithm was first developed by Jiang et al. [24] to estimate biological mechanisms of tumor immune escape, including cytotoxic T lymphocyte (CTL) dysfunction and CTL exclusion caused by immunosuppressive factors. The TIDE score could be a reliable biomarker to predict the response in cancer patients treated with ICIs [24]. Generally, for cancer patients with higher TIDE scores, the possibility of anti-tumor immune escape is higher, which may decrease the beneficial response of ICB treatment. In this study, no association was found between miRNA signature and TIDE score as well as CTL dysfunction (Figure S5B, S5C). Patients in the high-risk subgroup had a higher score of CTL exclusion than those in the low-risk subgroup (Figure 8G). These results suggest that HCC patients in the high-risk subgroup may have a lower T cell infiltration, which may promote tumor immune escape and immunotherapy resistance [25]. The MSI is another biomarker to predict the prognosis and immunotherapy response of ICB. In this study, the association of MSI with miRNA signature was explored and there was no significant difference between the two risk subgroups (Figure S5D).
Figure 8.
Comparison of the immunotherapeutic response between high-risk groups and low-risk groups. (A) The expression levels of immune checkpoint blockades (ICBs) between high-risk groups and low-risk groups. (B) The expression levels of human leukocyte antigen (HLA)-related genes between high-risk groups and low-risk groups. (C) Kaplan-Meier survival analysis of TMB value combining with prognostic signature. (D-F) The correlations between CTLA4 (D), PDCD1 (E), CD274 (F) and risk scores. (G) The violin plot of different prediction score of exclusion in two subgroups.
Identification of miRNA-associated target genes and construction of the miRNA-target gene network, PPI network, and survival analysis
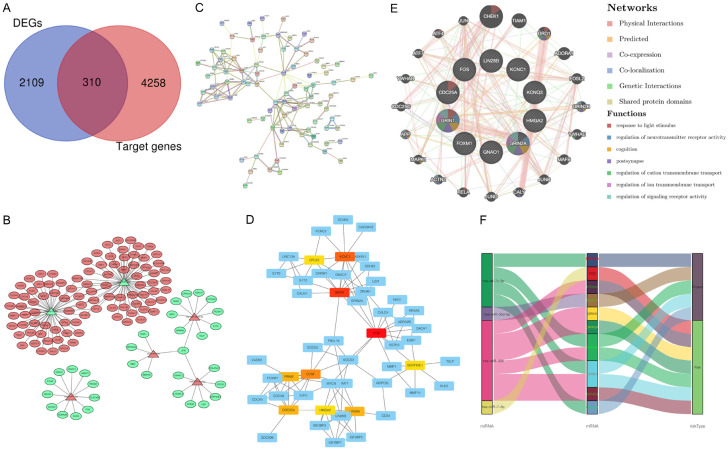
A total of 4568 potential target genes of six prognostic-related miRNAs (4006 target genes overlapping in two databases and 562 target genes overlapping bin three databases) were identified from three independent online databases. The Venn diagram showed the co-expressed potential target genes and DEGs (Figure 9A). In addition, the related target genes of the six prognostic-related miRNAs were also displayed in Venn diagrams (Figure S6). The interaction network visualizes the connection between prognostic miRNAs and corresponding target genes (Figure 9B). It was found that hsa-miR-326 and hsa-let-7c-5p had the most significant nodes and edges in the miRNA-target gene network. A PPI network was constructed using the STRING to explore the potential interactions among these target genes. As expected, a total of 126 nodes and 154 edges were obtained in the PPI network, with a local clustering coefficient of 0.424 (Figure 9C). Subsequently, the hub interaction network and the top ten target genes (GRIN1, FOS, KCNC1, GRIN2A, GNAO1, LIN28B, KCNQ3, CDC25A, FOXM1, and HMGA2) were screened based on the calculated connectivity in the PPI network (Figure 9D). Furthermore, the function-gene network also demonstrated that the 10 key target genes were mainly involved in the regulation of neurotransmitter receptor activity, response to light stimulus, cognition, postsynapse, regulation of cation transmembrane transport, regulation of ion transmembrane transport, and regulation of signaling receptor activity (Figure 9E). Sankey diagrams display the relationship of between miRNA and hub genes, in the risk subgroups (Figure 9F).
Figure 9.
Identification and functional analysis of miRNA-target genes. A. Venn diagram depicting overlap to display co-expression genes between differential expression genes (DEGs) and miRNA-target genes. B. MiRNA-target genes network. C. Protein-protein interaction (PPI) information network for miRNA target genes. D. The core genes information network screened from PPI network. E. The genes-function network of hub genes. F. Sankey diagrams constructed to display the relationship of six miRNAs, ten hub genes and two risk subgroups.
Construction of a lncRNA-miRNA-mRNA regulatory axis
To better understand the mechanism of six prognosis-related miRNA in the occurrence and development of HCC, we used GEPIA2 database to identify the differentially expressed genes from miRNAs target genes. As a result, eight differentially expressed genes, including CYP39A1, RRM2, MMP11, GNAO1, FOS, CLEC4M, MFSD2A, FOXM1 and CDCA5, were selected as the target genes for five miRNAs (Figure S7A). Next, the upstream lncRNAs of these miRNAs were predicted using ENCORI database. A total of 651 possible lncRNAs were forecasted for five miRNAs. Unfortunately, data on hsa-miR-5003-3p is not available in the ENCORI database. Then, the expression levels of these lncRNAs in HCC were determined using GEPIA2. As shown in Figures S7B, among all the 651 lncRNAs, only 14 lncRNAs had significantly differential expression between HCC tissues and normal tissues. Finally, the lncRNA-miRNA-mRNA regulatory axis containing these five miRNAs were identified as crucial ceRNA interactions and may play a vital role in the progression of HCC (Figure 10). Further in vivo and in vitro studies should be conducted to verify this hypothesis.
Figure 10.
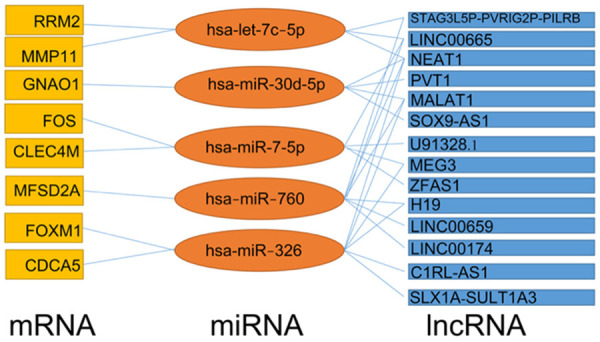
The lncRNA-miRNA-mRNA regulatory axis.
Functional enrichment analysis
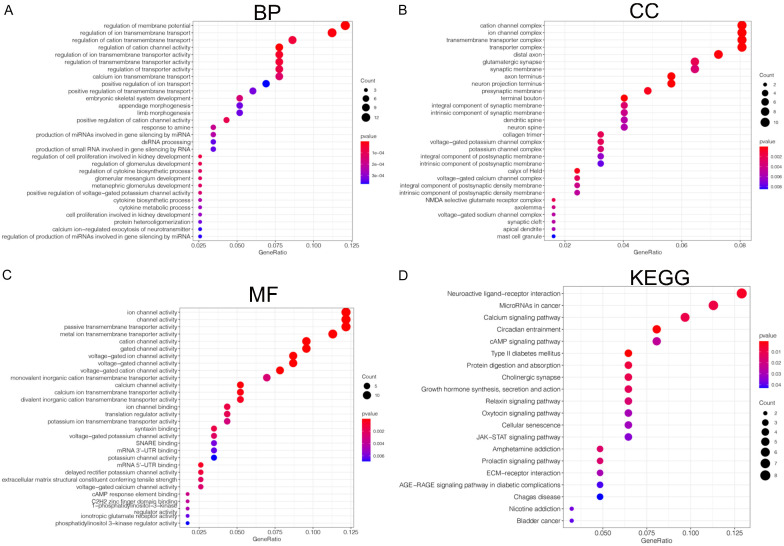
The functional enrichment analysis of prognosis-related miRNA target genes was performed based on GO functional enrichment and KEGG pathway enrichment. As shown in Figure 11, the miRNA target genes in the BP (biological process) functional ontology were mainly enriched in the regulation of membrane potential, regulation of ion transmembrane transport, and regulation of cation transmembrane transport (Figure 11A). The category of CC (cellular component) indicated that miRNA target genes were primarily clustered in the cation channel complex, ion channel complex, and transmembrane transporter complex (Figure 11B). The miRNA target genes in the MF (molecular function) functional ontology were mainly enriched in ion channel activity, channel activity, and passive transmembrane transporter activity (Figure 11C). In addition, the KEGG pathway enrichment analysis revealed that typical pathways were overrepresented in prognosis-related miRNA target genes, including neuroactive ligand-receptor interaction and microRNAs in cancer (Figure 11D). These results suggest that top significantly clustered GO function enrichment and KEGG pathways have important biological effects during the initiation and progression of HCC.
Figure 11.
Function enrichment (GO) and Kyoto Encyclopedia of Genes and Genomes (KEGG) enrichment analysis of miRNA-target genes. (A) The category of biological processes (BP). (B) The category of cellular component (CC), (C) the category of molecular function (MF). (D) The KEGG enrichment analysis of miRNA-target genes.
Comprehensive analysis of hub target genes
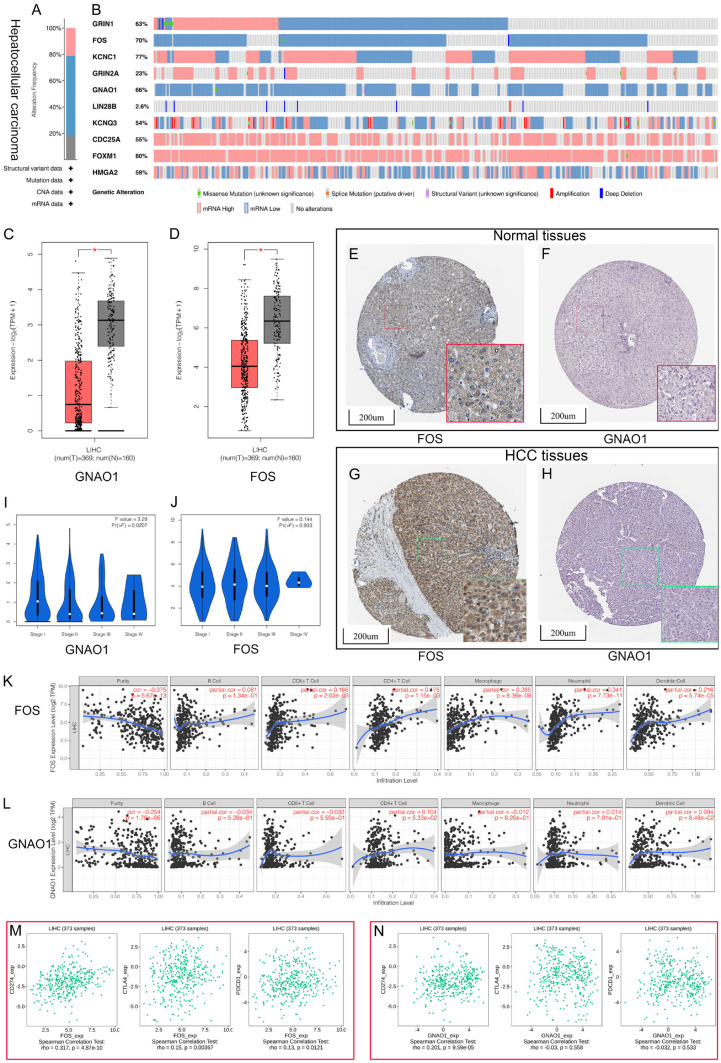
Several online databases were applied to further understand the potential biological mechanisms and clinical significance of the hub target genes. First, the mutation analysis of hub target genes was performed using the cBioPortal database and it was found that 100% of hub target genes were mutated in 345 cases (data from TCGA, Liver Hepatocellular Carcinoma, PanCancer Atlas) (Figure 12A). Further analysis showed that mutations were present in all hub target genes, with FOXM1 having the highest mutation rate of 80%, followed by KCNC1 of 77%, FOS of 70%, GNAO1 of 66%, GRIN1 of 63%, HMGA2 of 59%, CDC25A of 55%, KCNQ3 of 54%, GRIN2A of 23%, and LIN28B had the lowest rate of 2.6% (Figure 12B). These results indicated that these hub genes might play a significant role as pro-oncogenes in the initiation and progression of HCC. Second, the differential expression analysis of hub target genes was performed between normal liver tissues and HCC tissues. According to our criteria, two genes (FOS and GNAO1) were identified as significant DEGs and served as candidates for the next analysis (Figure 12C, 12D). Third, we analyzed the protein expression levels of two hub genes based on immunohistochemistry staining using the Human Protein Atlas database (Figure 12E, 12F). Fourth, we assessed the correlation between the expression levels of two hub genes and the clinicopathological stage of HCC patients by GEPIA. The expression of GNAO1 was significantly correlated with the clinicopathological stage of HCC patients, whereas the expression of FOS did not significantly vary with the clinicopathological stage (Figure 12I, 12J). Fifth, the immune status analysis showed that the expression of FOS was positively correlated with infiltration of five tumor-related immune cell types, including CD8+ T cells, CD4+ T cells, neutrophils, macrophages, and dendritic cells (Figure 12K). Noteworthy, the expression of GNAO1 did not show a significant correlation with infiltration of tumor-related immune cell types (Figure 12L). Sixth, we assessed the gene expression correlation between FOS, GNAO1, and key ICBs (CD274, CTLA4, and PDCD1). The expression of FOS was significantly correlated with CD274 (r = 0.317, P = 4.87e-10), CTLA4 (r = 0.150, P = 3.67e-03), and PDCD1 (r = 0.130, P = 1.21e-02) (Figure 12M). Only CD274 (r = 0.201, P = 9.59e-05) was significantly correlated with the expression of GNAO1 (Figure 12N).
Figure 12.
Comprehensive analysis of hub target genes. A. Summary for genetic alterations of hub target genes in hepatocellular carcinoma (HCC). B. The Oncoprint of ten hub target genes in TCGA LIHC dataset. C, D. The expression level of hub differential expression genes in tumor tissues and normal tissues from HCC samples. E, F. Immunohistochemical staining of the expression levels FOS and GNAO1 in normal tissues. G, H. Immunohistochemical staining of the expression levels FOS and GNAO1 in HCC tissues. I, J. Correlation between FOS and GNAO1 expression and clinicopathological stage in HCC patients. K, L. Correlation between FOS and GNAO1 expression and tumor-infiltrating immune cells. M, N. Correlation analysis between FOS, GNAO1 and the expression levels of immune checkpoints.
qRT-PCR detection of miRNA
To investigate the expression level of six miRNAs in the prognostic signature, qRT-PCR was performed in HepG2 cells and HEK293T cells. The expression levels of miR-326 and miR-760 were increased in HepG2 cells (Figure 13A, 13B). However, miR-5003-3p, miR-7-5p, let-7c-5p, and miR-30d-5p had lower expression levels in HepG2 cells than in HEK293T cells (Figure 13C-E).
Figure 13.
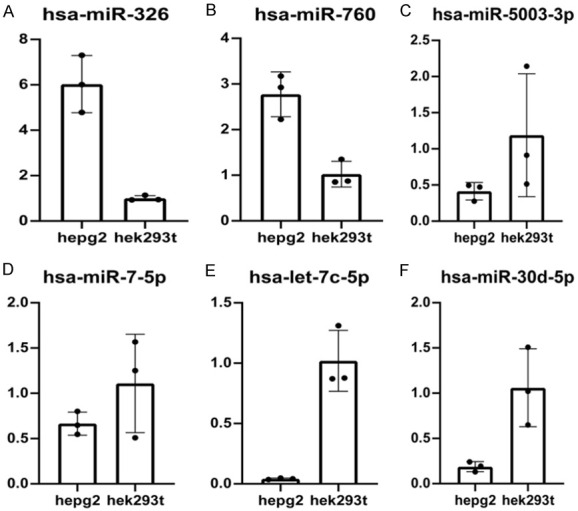
Quantitative real-time polymerase chain reaction (qRT-PCR) analyses of six prognosis-related miRNAs in in HepG2 cells and HEK293T cells. (A) hsa-miR-326 (B) hsa-miR-760 (C) hsa-miR-5003-3p (D) hsa-miR-7-5p (E) hsa-let-7c-5p (F) hsa-miR-30d-5p.
Discussion
Primary liver cancer remains one of the top four leading causes of cancer-related death and is the sixth most common type of malignant tumor [1,26]. Because of the insidious onset of HCC, the diagnosis is often delayed. Despite remarkable improvements in surgery, radiotherapy, and chemotherapy, the OS of HCC patients remains unsatisfactory [2,26]. Therefore, it is important to explore the mechanisms of tumorigenesis and develop novel markers to predict the prognosis of primary liver cancer so as to enable individualized treatment. Although the widely used 8th edition of the TNM staging system based on AJCC (American Joint Committee on Cancer) is significantly correlated with the prognosis of patients with primary liver cancer, it still has inherent defects and cannot predict the prognosis at the same clinicopathological stage. The miRNAs belong to a subfamily of ncRNAs and are negative regulators of gene expression. They also affect cellular processes contributing to malignant tumor progression [27,28]. Increasing studies have identified the value of miRNAs as potential prognostic biomarkers in several human malignant tumors [29-32]. However, the potential prognostic value of miRNAs in primary liver cancer has not been clarified.
It has been revealed that differential miRNA expression profiles can be involved in various malignant tumorigenesis, tumor cell proliferation, and metastasis as oncogenes or tumor suppressor genes [33-35]. miRNA is also a potential prognostic biomarker to predict the prognosis of HCC patients [36]. In this study, we identified six novel miRNAs (hsa-miR-5003-3p, hsa-miR-760, hsa-miR-326, hsa-let-7c-5p, hsa-miR-30d-5p, and hsa-miR-7-5p) as potential prognostic biomarker candidates for HCC patients. The AUC demonstrated that a single miRNA might provide a complementary method for accurate OS prediction in HCC. In addition, a prognostic signature based on six candidate miRNAs was established. It was significantly correlated with OS and more efficient than a single miRNA in predicting the short-term prognosis of HCC patients. In the test cohort, we verified the prognostic power of miRNA signature, and then constructed a predictive nomogram and conducted DCA in HCC. It was demonstrated that the signature had a significant prognostic value and could act as an auxiliary for clinical decisions. In addition to miRNA signature, the nomogram also included other independent prognostic factors (the tumor stage, etc.) to predict the clinical outcomes of patients with HCC. It was suggested that the constructed miRNA signature and nomogram may help predict the clinical outcomes of HCC.
Several studies demonstrated that miRNAs play significant regulatory roles in various physiological processes, including organogenesis, differentiation, apoptosis, and cell proliferation [37]. Epithelial-mesenchymal transition (EMT) is proposed to be involved in tumor cell metastasis. Hsa-miR-5003-3p plays an essential role in tumor cell metastasis by promoting EMT through binding to E-cadherin and dual regulation of Snail stability and may be a potential therapeutic target for immunotherapy of metastatic cancers [38]. Hsa-miR-760 is a negative regulator of tumor suppressor gene expression by binding to nucleus accumbens associated protein-1 (NACC-1) or HMGA2 and can promote cellular processes contributing to malignant tumor progression [39,40]. Sun et al. [19] presented that high expression of hsa-miR-760 was associated with poor prognosis in HCC patients, which is consistent with the finding in the present study. Many studies have shown that hsa-miR-326 was a direct target of circular RNAs in the initiation and progression of HCC, including hsa-circ-PTN [41], hsa-circ-102272 [42], hsa-circ-0000517 [43], and hsa-circ-0005397 [44]. In addition, circular RNAs regulated the expression of miRNA-related target genes by sponging miR-326. Hsa-let-7c-5p was a direct target of CDKN2B antisense RNA 1 (CDKN2B-AS1), promoting nucleosome assembly protein 1 like 1 (NAP1L1) expression, thereby activating PI3K/AKT/mTOR signaling in HCC cells [45]. Previous reports have shown that hsa-miR-30d-5p and hsa-miR-7-5p have tumor suppressive functions in non-small cell lung cancer and renal cell carcinoma [46,47].
In recent years, great efforts have been made in exploring effective therapeutic strategies for HCC, and liver transplantation (LT), radical surgical resection transcatheter arterial chemoembolization (TACE), radiofrequency ablation (RFA), targeted therapy, and immunotherapy have been proposed. In particular, immunotherapies, such as Pembrolizumab, Nivolumab, and Camrelizumab, are becoming effective therapeutic strategies with promising survival outcomes [48,49]. The liver which contains various immune cells is one of the largest immune organs in the human body [50]. HCC is an immune-related tumor, and its pathogenesis and progression are correlated with the evasion from anti-tumor immune response [51,52]. More importantly, HCC is an aggressive malignancy with high immunohistochemical heterogeneity, and HCC tissues have different activities in response to tumor-related immune cells [2,8]. Therefore, it is necessary to better understand the characteristics of the complex immunohistochemical heterogeneity and immunoregulatory networks so as to develop novel therapeutic interventions, including targeted therapy and immunotherapy. TILs belonging to TIICs are associated with tumorigenesis and have important effects on the immunoregulatory networks. These cells are also significant components of the TIME and have complex interactions with tumor cells and other stromal cells. In this study, we found that the scores of aDCs, iDCs, macrophages, Th2-cells, and Treg were significantly higher in the high-risk group than in the low-risk group. These results indicated that the constructed miRNA signature has an immune infiltration relationship with immune cells.
In the past decade, the effect of tumorigenesis on the immune system and tumor cell evasion from immune surveillance have been widely accepted as one of the key hallmarks of cancer. Additionally, immunotherapy has emerged as the pillar of advanced HCC treatment as it unravels the unknown biological mechanisms of cancer immunity [53]. ICIs, especially PD-1, PD-L1, and CTLA4, have emerged as the first-line immunotherapy strategy for multiple malignant tumors, such as advanced HCC, non-small-cell lung cancer, classical Hodgkin lymphoma (cHL) [54-56]. The immunoglobulin gene superfamily PD-1 is a cell surface receptor, which is highly expressed in tumor-infiltrating activated T cells [57]. The mechanism by which tumor cells escape from immune surveillance is the upregulation of the expression of PD-L1 in tumor cells, which binds to PD-1 and stimulates peripheral T cell depletion (termed adaptive immune resistance) [58]. Therefore, management of the PD-1/PD-L1 immune inhibitory axis allows reprogramming of the TIME and immune surveillance. A member of CD28 immunoglobulin-related receptor CTLA-4 has an important effect on negatively modulated T cell activation and proliferation [59]. Anti-CTLA-4 drugs are recognized as key immune checkpoints targeting advanced HCC [60]. According to this study, the expression levels of ICBs except the KDR (VEGFR-2), namely, CD96, LAG3, KDR, CSF1R, TGFB1, HAVCR2, TGFBR1, VTCN1, LGALS9, CTLA4, IL10, TIGIT, IL10RB, and PDCD1 (PD-1), were significantly higher in the high-risk subgroup. This result indicated that patients in the high-risk subgroup might have a better response to immunotherapy.
This study has several limitations. Firstly, the study simply relied on bioinformatics analysis without conducting biological experiments to verify the results. Secondly, molecular mechanisms and functions of prognosis-related miRNAs and tumor-infiltrating immune cells were inadequately studied. Thus, further large-scale and prospective clinical trials are needed to confirm the findings of this study.
Conclusions
In conclusion, based on six miRNAs, we constructed a prognostic signature with strong predictive power for HCC patients. Through internal verification, it was confirmed that this signature outperformed other clinicopathological parameters in terms of prediction efficiency. Additionally, we constructed a nomogram using independent prognostic factors that may help predict prognosis for HCC patients. Furthermore, the signature can distinguish HCC with different immunological characteristics to reflect the TIME and guide immunotherapy.
Acknowledgements
The authors acknowledge the support of the open-access resources.
Disclosure of conflict of interest
None.
Abbreviations
- HCC
Hepatocellular carcinoma
- miRNAs
MicroRNAs
- OS
Overall survival
- GO
Gene Ontology
- KEGG
Kyoto Encyclopedia of Genes and Genomes
- ncRNAs
Non-coding RNA
- TCGA
The Cancer Genome Atlas
- FDR
False discovery rate
- FC
Fold change
- ROC
Receiver operating characteristic
- AUC
Area under curve
- K-M
Kaplan-Meier
- Td-ROC
Time-dependent receiver operating characteristic
- HPA
Human Protein Atlas
- CCLE
Cancer Cell Line Encyclopedia
- PPI
Protein-protein interaction
- PCA
Principal components analysis
- C-index
concordance index
- AJCC
American Joint Committee on Cancer
- EMT
Epithelial-mesenchymal transition
- NACC-1
Nucleus accumbens associated protein-1
Supporting Information
References
- 1.Bray F, Ferlay J, Soerjomataram I, Siegel RL, Torre LA, Jemal A. Global cancer statistics 2018: GLOBOCAN estimates of incidence and mortality worldwide for 36 cancers in 185 countries. CA Cancer J Clin. 2018;68:394–424. doi: 10.3322/caac.21492. [DOI] [PubMed] [Google Scholar]
- 2.Villanueva A. Hepatocellular carcinoma. N Engl J Med. 2019;380:1450–1462. doi: 10.1056/NEJMra1713263. [DOI] [PubMed] [Google Scholar]
- 3.Saran U, Humar B, Kolly P, Dufour JF. Hepatocellular carcinoma and lifestyles. J Hepatol. 2016;64:203–214. doi: 10.1016/j.jhep.2015.08.028. [DOI] [PubMed] [Google Scholar]
- 4.Llovet JM, Kelley RK, Villanueva A, Singal AG, Pikarsky E, Roayaie S, Lencioni R, Koike K, Zucman-Rossi J, Finn RS. Hepatocellular carcinoma. Nat Rev Dis Primers. 2021;7:6. doi: 10.1038/s41572-020-00240-3. [DOI] [PubMed] [Google Scholar]
- 5.de Martel C, Ferlay J, Franceschi S, Vignat J, Bray F, Forman D, Plummer M. Global burden of cancers attributable to infections in 2008: a review and synthetic analysis. Lancet Oncol. 2012;13:607–615. doi: 10.1016/S1470-2045(12)70137-7. [DOI] [PubMed] [Google Scholar]
- 6.Kulik L, El-Serag HB. Epidemiology and management of hepatocellular carcinoma. Gastroenterology. 2019;156:477–491. doi: 10.1053/j.gastro.2018.08.065. [DOI] [PMC free article] [PubMed] [Google Scholar]
- 7.Lin CW, Lin CC, Mo LR, Chang CY, Perng DS, Hsu CC, Lo GH, Chen YS, Yen YC, Hu JT, Yu ML, Lee PH, Lin JT, Yang SS. Heavy alcohol consumption increases the incidence of hepatocellular carcinoma in hepatitis B virus-related cirrhosis. J Hepatol. 2013;58:730–735. doi: 10.1016/j.jhep.2012.11.045. [DOI] [PubMed] [Google Scholar]
- 8.Forner A, Llovet JM, Bruix J. Hepatocellular carcinoma. Lancet. 2012;379:1245–1255. doi: 10.1016/S0140-6736(11)61347-0. [DOI] [PubMed] [Google Scholar]
- 9.Jemal A, Ward EM, Johnson CJ, Cronin KA, Ma J, Ryerson B, Mariotto A, Lake AJ, Wilson R, Sherman RL, Anderson RN, Henley SJ, Kohler BA, Penberthy L, Feuer EJ, Weir HK. Annual report to the nation on the status of cancer, 1975-2014, featuring survival. J Natl Cancer Inst. 2017;109:djx030. doi: 10.1093/jnci/djx030. [DOI] [PMC free article] [PubMed] [Google Scholar]
- 10.Yang JD, Heimbach JK. New advances in the diagnosis and management of hepatocellular carcinoma. BMJ. 2020;371:m3544. doi: 10.1136/bmj.m3544. [DOI] [PubMed] [Google Scholar]
- 11.Correia de Sousa M, Gjorgjieva M, Dolicka D, Sobolewski C, Foti M. Deciphering miRNAs’ action through miRNA editing. Int J Mol Sci. 2019;20:6249. doi: 10.3390/ijms20246249. [DOI] [PMC free article] [PubMed] [Google Scholar]
- 12.Kabekkodu SP, Shukla V, Varghese VK, D’ Souza J, Chakrabarty S, Satyamoorthy K. Clustered miRNAs and their role in biological functions and diseases. Biol Rev Camb Philos Soc. 2018;93:1955–1986. doi: 10.1111/brv.12428. [DOI] [PubMed] [Google Scholar]
- 13.Lee H, Han S, Kwon CS, Lee D. Biogenesis and regulation of the let-7 miRNAs and their functional implications. Protein Cell. 2016;7:100–113. doi: 10.1007/s13238-015-0212-y. [DOI] [PMC free article] [PubMed] [Google Scholar]
- 14.Han TS, Hur K, Cho HS, Ban HS. Epigenetic associations between lncRNA/circRNA and miRNA in hepatocellular carcinoma. Cancers (Basel) 2020;12:2622. doi: 10.3390/cancers12092622. [DOI] [PMC free article] [PubMed] [Google Scholar]
- 15.Ghafouri-Fard S, Shoorei H, Taheri M. miRNA profile in ovarian cancer. Exp Mol Pathol. 2020;113:104381. doi: 10.1016/j.yexmp.2020.104381. [DOI] [PubMed] [Google Scholar]
- 16.Sun X, Xu W, Zang C, Li N. miRNA-520c-3p accelerates progression of nasopharyngeal carcinoma via targeting RAB22A. Oncol Lett. 2020;20:319. doi: 10.3892/ol.2020.12182. [DOI] [PMC free article] [PubMed] [Google Scholar]
- 17.Otoukesh B, Abbasi M, Gorgani HO, Farahini H, Moghtadaei M, Boddouhi B, Kaghazian P, Hosseinzadeh S, Alaee A. MicroRNAs signatures, bioinformatics analysis of miRNAs, miRNA mimics and antagonists, and miRNA therapeutics in osteosarcoma. Cancer Cell Int. 2020;20:254. doi: 10.1186/s12935-020-01342-4. [DOI] [PMC free article] [PubMed] [Google Scholar]
- 18.Qin S, Shi X, Wang C, Jin P, Ma F. Transcription factor and miRNA interplays can manifest the survival of ccRCC patients. Cancers (Basel) 2019;11:1668. doi: 10.3390/cancers11111668. [DOI] [PMC free article] [PubMed] [Google Scholar]
- 19.Sun D, Lu J, Hu C, Zhang Q, Wang X, Zhang Z, Hu S. Prognostic role of miR-760 in hepatocellular carcinoma. Oncol Lett. 2018;16:7239–7244. doi: 10.3892/ol.2018.9546. [DOI] [PMC free article] [PubMed] [Google Scholar]
- 20.Yanaihara N, Caplen N, Bowman E, Seike M, Kumamoto K, Yi M, Stephens RM, Okamoto A, Yokota J, Tanaka T, Calin GA, Liu CG, Croce CM, Harris CC. Unique microRNA molecular profiles in lung cancer diagnosis and prognosis. Cancer Cell. 2006;9:189–198. doi: 10.1016/j.ccr.2006.01.025. [DOI] [PubMed] [Google Scholar]
- 21.Volinia S, Calin GA, Liu CG, Ambs S, Cimmino A, Petrocca F, Visone R, Iorio M, Roldo C, Ferracin M, Prueitt RL, Yanaihara N, Lanza G, Scarpa A, Vecchione A, Negrini M, Harris CC, Croce CM. A microRNA expression signature of human solid tumors defines cancer gene targets. Proc Natl Acad Sci U S A. 2006;103:2257–2261. doi: 10.1073/pnas.0510565103. [DOI] [PMC free article] [PubMed] [Google Scholar]
- 22.Wong QW, Lung RW, Law PT, Lai PB, Chan KY, To KF, Wong N. MicroRNA-223 is commonly repressed in hepatocellular carcinoma and potentiates expression of Stathmin1. Gastroenterology. 2008;135:257–269. doi: 10.1053/j.gastro.2008.04.003. [DOI] [PubMed] [Google Scholar]
- 23.Hung JH, Li CH, Yeh CH, Huang PC, Fang CC, Chen YF, Lee KJ, Chou CH, Cheng HY, Huang HD, Chen M, Tsai TF, Lin AM, Yen CH, Tsou AP, Tyan YC, Chen YA. MicroRNA-224 down-regulates Glycine N-methyltransferase gene expression in Hepatocellular Carcinoma. Sci Rep. 2018;8:12284. doi: 10.1038/s41598-018-30682-5. [DOI] [PMC free article] [PubMed] [Google Scholar]
- 24.Jiang P, Gu S, Pan D, Fu J, Sahu A, Hu X, Li Z, Traugh N, Bu X, Li B, Liu J, Freeman GJ, Brown MA, Wucherpfennig KW, Liu XS. Signatures of T cell dysfunction and exclusion predict cancer immunotherapy response. Nat Med. 2018;24:1550–1558. doi: 10.1038/s41591-018-0136-1. [DOI] [PMC free article] [PubMed] [Google Scholar]
- 25.Jerby-Arnon L, Shah P, Cuoco MS, Rodman C, Su MJ, Melms JC, Leeson R, Kanodia A, Mei S, Lin JR, Wang S, Rabasha B, Liu D, Zhang G, Margolais C, Ashenberg O, Ott PA, Buchbinder EI, Haq R, Hodi FS, Boland GM, Sullivan RJ, Frederick DT, Miao B, Moll T, Flaherty KT, Herlyn M, Jenkins RW, Thummalapalli R, Kowalczyk MS, Cañadas I, Schilling B, Cartwright ANR, Luoma AM, Malu S, Hwu P, Bernatchez C, Forget MA, Barbie DA, Shalek AK, Tirosh I, Sorger PK, Wucherpfennig K, Van Allen EM, Schadendorf D, Johnson BE, Rotem A, Rozenblatt-Rosen O, Garraway LA, Yoon CH, Izar B, Regev A. A cancer cell program promotes T cell exclusion and resistance to checkpoint blockade. Cell. 2018;175:984–997. doi: 10.1016/j.cell.2018.09.006. [DOI] [PMC free article] [PubMed] [Google Scholar]
- 26.Liu Z, Suo C, Mao X, Jiang Y, Jin L, Zhang T, Chen X. Global incidence trends in primary liver cancer by age at diagnosis, sex, region, and etiology, 1990-2017. Cancer. 2020;126:2267–2278. doi: 10.1002/cncr.32789. [DOI] [PubMed] [Google Scholar]
- 27.Ferragut Cardoso AP, Udoh KT, States JC. Arsenic-induced changes in miRNA expression in cancer and other diseases. Toxicol Appl Pharmacol. 2020;409:115306. doi: 10.1016/j.taap.2020.115306. [DOI] [PMC free article] [PubMed] [Google Scholar]
- 28.Kim CK, Pak TR. miRNA degradation in the mammalian brain. Am J Physiol Cell Physiol. 2020;319:C624–C629. doi: 10.1152/ajpcell.00303.2020. [DOI] [PMC free article] [PubMed] [Google Scholar]
- 29.Pascut D, Pratama MY, Gilardi F, Giuffrè M, Crocè LS, Tiribelli C. Weighted miRNA co-expression networks analysis identifies circulating miRNA predicting overall survival in hepatocellular carcinoma patients. Sci Rep. 2020;10:18967. doi: 10.1038/s41598-020-75945-2. [DOI] [PMC free article] [PubMed] [Google Scholar]
- 30.Wu ZH, Zhong Y, Zhou T, Xiao HJ. miRNA biomarkers for predicting overall survival outcomes for head and neck squamous cell carcinoma. Genomics. 2021;113:135–141. doi: 10.1016/j.ygeno.2020.12.002. [DOI] [PubMed] [Google Scholar]
- 31.Qian J, Zeng L, Jiang X, Zhang Z, Luo X. Novel multiple mirna-based signatures for predicting overall survival and recurrence-free survival of colorectal cancer patients. Med Sci Monit. 2019;25:7258–7271. doi: 10.12659/MSM.916948. [DOI] [PMC free article] [PubMed] [Google Scholar]
- 32.Lu L, Wu Y, Feng M, Xue X, Fan Y. A novel sevenmiRNA prognostic model to predict overall survival in head and neck squamous cell carcinoma patients. Mol Med Rep. 2019;20:4340–4348. doi: 10.3892/mmr.2019.10665. [DOI] [PubMed] [Google Scholar]
- 33.Lu J, Getz G, Miska EA, Alvarez-Saavedra E, Lamb J, Peck D, Sweet-Cordero A, Ebert BL, Mak RH, Ferrando AA, Downing JR, Jacks T, Horvitz HR, Golub TR. MicroRNA expression profiles classify human cancers. Nature. 2005;435:834–838. doi: 10.1038/nature03702. [DOI] [PubMed] [Google Scholar]
- 34.Riaz M, van Jaarsveld MT, Hollestelle A, Prager-van der Smissen WJ, Heine AA, Boersma AW, Liu J, Helmijr J, Ozturk B, Smid M, Wiemer EA, Foekens JA, Martens JW. miRNA expression profiling of 51 human breast cancer cell lines reveals subtype and driver mutation-specific miRNAs. Breast Cancer Res. 2013;15:R33. doi: 10.1186/bcr3415. [DOI] [PMC free article] [PubMed] [Google Scholar]
- 35.Iqbal J, Shen Y, Huang X, Liu Y, Wake L, Liu C, Deffenbacher K, Lachel CM, Wang C, Rohr J, Guo S, Smith LM, Wright G, Bhagavathi S, Dybkaer K, Fu K, Greiner TC, Vose JM, Jaffe E, Rimsza L, Rosenwald A, Ott G, Delabie J, Campo E, Braziel RM, Cook JR, Tubbs RR, Armitage JO, Weisenburger DD, Staudt LM, Gascoyne RD, McKeithan TW, Chan WC. Global microRNA expression profiling uncovers molecular markers for classification and prognosis in aggressive B-cell lymphoma. Blood. 2015;125:1137–1145. doi: 10.1182/blood-2014-04-566778. [DOI] [PMC free article] [PubMed] [Google Scholar]
- 36.Fu M, Pei Y, Lu F, Jiang H, Bi Y, Cheng J, Qin J. Identification of potential hub genes and miRNA-mRNA pairs related to the progression and prognosis of cervical cancer through integrated bioinformatics analysis. Front Genet. 2021;12:775006. doi: 10.3389/fgene.2021.775006. [DOI] [PMC free article] [PubMed] [Google Scholar]
- 37.Otmani K, Lewalle P. Tumor suppressor miRNA in cancer cells and the tumor microenvironment: mechanism of deregulation and clinical implications. Front Oncol. 2021;11:708765. doi: 10.3389/fonc.2021.708765. [DOI] [PMC free article] [PubMed] [Google Scholar]
- 38.Kwak SY, Yoo JO, An HJ, Bae IH, Park MJ, Kim J, Han YH. miR-5003-3p promotes epithelial-mesenchymal transition in breast cancer cells through Snail stabilization and direct targeting of E-cadherin. J Mol Cell Biol. 2016;8:372–383. doi: 10.1093/jmcb/mjw026. [DOI] [PubMed] [Google Scholar]
- 39.Yin L, Sun T, Liu R. NACC-1 regulates hepatocellular carcinoma cell malignancy and is targeted by miR-760. Acta Biochim Biophys Sin (Shanghai) 2020;52:302–309. doi: 10.1093/abbs/gmz167. [DOI] [PubMed] [Google Scholar]
- 40.Wang Q, Wang G, Xu X, Chen Z. miR-760 mediated the proliferation and metastasis of hepatocellular carcinoma cells by regulating HMGA2. Pathol Res Pract. 2021;222:153420. doi: 10.1016/j.prp.2021.153420. [DOI] [PubMed] [Google Scholar]
- 41.Jia B, Yin X, Wang Y, Qian J, He Y, Yang C, Yu G, Guo B, Meng X. CircRNA-PTN sponges miR-326 to promote proliferation in hepatocellular carcinoma. Onco Targets Ther. 2020;13:4893–4903. doi: 10.2147/OTT.S251300. [DOI] [PMC free article] [PubMed] [Google Scholar]
- 42.Guan Y, Zhang Y, Hao L, Nie Z. CircRNA_102272 promotes cisplatin-resistance in hepatocellular carcinoma by decreasing miR-326 targeting of RUNX2. Cancer Manag Res. 2020;12:12527–12534. doi: 10.2147/CMAR.S258230. [DOI] [PMC free article] [PubMed] [Google Scholar]
- 43.He S, Yang J, Jiang S, Li Y, Han X. Circular RNA circ_0000517 regulates hepatocellular carcinoma development via miR-326/IGF1R axis. Cancer Cell Int. 2020;20:404. doi: 10.1186/s12935-020-01496-1. [DOI] [PMC free article] [PubMed] [Google Scholar] [Retracted]
- 44.Gong J, Du C, Sun N, Xiao X, Wu H. Circular RNA hsa_circ_0005397 promotes hepatocellular carcinoma progression by regulating the miR-326/PDK2 axis. J Gene Med. 2021;23:e3332. doi: 10.1002/jgm.3332. [DOI] [PubMed] [Google Scholar]
- 45.Huang Y, Xiang B, Liu Y, Wang Y, Kan H. LncRNA CDKN2B-AS1 promotes tumor growth and metastasis of human hepatocellular carcinoma by targeting let-7c-5p/NAP1L1 axis. Cancer Lett. 2018;437:56–66. doi: 10.1016/j.canlet.2018.08.024. [DOI] [PubMed] [Google Scholar]
- 46.Xiao H. MiR-7-5p suppresses tumor metastasis of non-small cell lung cancer by targeting NOVA2. Cell Mol Biol Lett. 2019;24:60. doi: 10.1186/s11658-019-0188-3. [DOI] [PMC free article] [PubMed] [Google Scholar]
- 47.Liang L, Yang Z, Deng Q, Jiang Y, Cheng Y, Sun Y, Li L. miR-30d-5p suppresses proliferation and autophagy by targeting ATG5 in renal cell carcinoma. FEBS Open Bio. 2021;11:529–540. doi: 10.1002/2211-5463.13025. [DOI] [PMC free article] [PubMed] [Google Scholar] [Retracted]
- 48.Kudo M. Adjuvant immunotherapy after curative treatment for hepatocellular carcinoma. Liver Cancer. 2021;10:399–403. doi: 10.1159/000518584. [DOI] [PMC free article] [PubMed] [Google Scholar]
- 49.Martorana F, Colombo I, Treglia G, Gillessen S, Stathis A. A systematic review of phase II trials exploring anti-PD-1/PD-L1 combinations in patients with solid tumors. Cancer Treat Rev. 2021;101:102300. doi: 10.1016/j.ctrv.2021.102300. [DOI] [PubMed] [Google Scholar]
- 50.Kubes P, Jenne C. Immune responses in the liver. Annu Rev Immunol. 2018;36:247–277. doi: 10.1146/annurev-immunol-051116-052415. [DOI] [PubMed] [Google Scholar]
- 51.Gajewski TF, Schreiber H, Fu YX. Innate and adaptive immune cells in the tumor microenvironment. Nat Immunol. 2013;14:1014–1022. doi: 10.1038/ni.2703. [DOI] [PMC free article] [PubMed] [Google Scholar]
- 52.Hinshaw DC, Shevde LA. The tumor microenvironment innately modulates cancer progression. Cancer Res. 2019;79:4557–4566. doi: 10.1158/0008-5472.CAN-18-3962. [DOI] [PMC free article] [PubMed] [Google Scholar]
- 53.Sangro B, Bruix J, Chan SL, Galle PR, Rimassa L. Immunotherapy for patients with hepatocellular carcinoma and chronic viral infections. J Hepatol. 2021 [Google Scholar]
- 54.Pinter M, Scheiner B, Peck-Radosavljevic M. Immunotherapy for advanced hepatocellular carcinoma: a focus on special subgroups. Gut. 2021;70:204–214. doi: 10.1136/gutjnl-2020-321702. [DOI] [PMC free article] [PubMed] [Google Scholar]
- 55.Doroshow DB, Sanmamed MF, Hastings K, Politi K, Rimm DL, Chen L, Melero I, Schalper KA, Herbst RS. Immunotherapy in non-small cell lung cancer: facts and hopes. Clin Cancer Res. 2019;25:4592–4602. doi: 10.1158/1078-0432.CCR-18-1538. [DOI] [PMC free article] [PubMed] [Google Scholar]
- 56.Vassilakopoulos TP. Relapsed or refractory classical Hodgkin lymphoma: which immunotherapy, and when? Lancet Oncol. 2021;22:417–419. doi: 10.1016/S1470-2045(21)00138-8. [DOI] [PubMed] [Google Scholar]
- 57.Ghavimi S, Apfel T, Azimi H, Persaud A, Pyrsopoulos NT. Management and treatment of hepatocellular carcinoma with immunotherapy: a review of current and future options. J Clin Transl Hepatol. 2020;8:168–176. doi: 10.14218/JCTH.2020.00001. [DOI] [PMC free article] [PubMed] [Google Scholar]
- 58.Tumeh PC, Harview CL, Yearley JH, Shintaku IP, Taylor EJ, Robert L, Chmielowski B, Spasic M, Henry G, Ciobanu V, West AN, Carmona M, Kivork C, Seja E, Cherry G, Gutierrez AJ, Grogan TR, Mateus C, Tomasic G, Glaspy JA, Emerson RO, Robins H, Pierce RH, Elashoff DA, Robert C, Ribas A. PD-1 blockade induces responses by inhibiting adaptive immune resistance. Nature. 2014;515:568–571. doi: 10.1038/nature13954. [DOI] [PMC free article] [PubMed] [Google Scholar]
- 59.Rowshanravan B, Halliday N, Sansom DM. CTLA-4: a moving target in immunotherapy. Blood. 2018;131:58–67. doi: 10.1182/blood-2017-06-741033. [DOI] [PMC free article] [PubMed] [Google Scholar]
- 60.Kudo M. Combination cancer immunotherapy with molecular targeted agents/Anti-CTLA-4 antibody for hepatocellular carcinoma. Liver Cancer. 2019;8:1–11. doi: 10.1159/000496277. [DOI] [PMC free article] [PubMed] [Google Scholar]
Associated Data
This section collects any data citations, data availability statements, or supplementary materials included in this article.


