

Abstract
Hematopoietic stem (HSC) and progenitor (HPC) cells are regulated by interacting signals and cellular and noncellular elements of the hematopoietic niche. We previously showed that CD166 is a functional marker of murine and human HSC and of cellular components of the murine niche. Selection of murine CD166+ engrafting HSC enriched for marrow repopulating cells. Here, we demonstrate that CD166-CD166 homophilic interactions enhance generation of murine and human HPC in vitro and augment hematopoietic function of these cells. Interactions between cultured CD166+ Lineage−Sca-1+CD117+ (LSK) cells and CD166+ osteoblasts (OB) significantly enhanced expansion of colony-forming units (CFUs). Interactions between CD166+ LSK cells and immobilized CD166 protein generated more CFU in short-term cultures than between these cells and BSA or in cultures initiated with CD166− LSK cells. Similar results were obtained when LSK cells from WT or CD166 knockout (CD166−/−) mice were used with immobilized CD166. Human cord blood CD34+ cells expressing CD166 produced significantly higher numbers of CFUs following interaction with immobilized CD166 than their CD166− counterparts. These data demonstrate the positive effects of CD166 homophilic interactions involving CD166 on the surface of murine and human HPCs. Single-cell RNA-seq (scRNA-Seq) analysis of CD150+CD48− (SLAM) LSK cells from WT and CD166−/− mice incubated with immobilized CD166 protein revealed that engagement of CD166 on these cells activates cytokine, growth factor and hormone signaling, epigenetic pathways, and other genes implicated in maintenance of stem cell pluripotency-, and mitochondria-related signaling pathways. These studies provide tangible evidence implicating CD166 engagement in the maintenance of stem/progenitor cell function.
Keywords: CD166, homophilic interaction, hematopoietic stem and progenitor cells, Single-cell RNA-seq analysis
Graphical Abstract
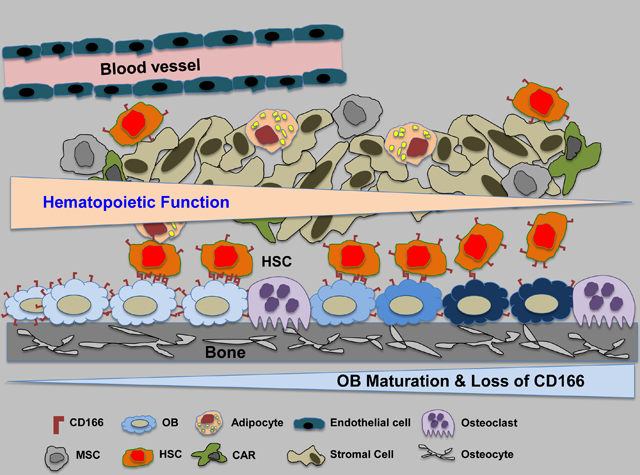
CD166 expression and hematopoietic function in the niche
INTRODUCTION
Hematopoietic cell transplantation (HCT) is used to treat malignant and nonmalignant disorders1. Hematopoietic stem (HSC) and progenitor (HPC) cells are key contributors to successful HCT2. Greater insight into the regulation of these cells will allow enhanced efficacy of HCT. Interactions between HSC and HPC and their microenvironment are crucial for the maintenance of hematopoiesis3,4. However, these interactions are not yet completely understood.
CD166, also known as activated leukocyte cell adhesion molecule (ALCAM), a member of the immunoglobulin super-family, mediates homophilic (CD166-CD166) and heterophilic (CD166-CD6) interactions5,6. CD166 is expressed on stem and progenitor cells of all three embryonic lineages, and CD166-mediated interactions are important for several biological processes6–8. We previously noted the importance of CD166 as a marker of immature osteoblasts9–11 and demonstrated that the hematopoietic enhancing activity of osteoblasts diminishes as these cells mature and lose CD166 expression. Recently we also identified CD166 as a functional marker on murine and human long-term marrow repopulating HSC12. Both murine and human long-term repopulating cells were significantly enriched in the CD166+ fraction compared to their CD166− counterparts12. In transplantation studies, we documented that CD166-cells (regardless of the selection criteria) engrafted poorly in lethally irradiated recipients and almost had no long-term (LT-HSC) reconstitution potential12. CD166 was critical for homing of multiple myeloma cells to the marrow, and silencing its expression on myeloma cells hampered progression of the disease and reduced the severity of the myeloma-associated bone lytic disease13.
Yet, it remains unclear whether homophilic engagement of CD166 on the surface of HSC/HPC enhances the hematopoietic potential of these cells. Herein, we show that homophilic CD166 interactions involving more mature murine and human hematopoietic cells significantly augment production of functional HPC in short-term cultures and enhanced short-term engraftment in vivo. The primary goal of these studies was not to show that HSC with different CD166 expression status are different or to describe a new efficient method to expand HSC in vitro, but to demonstrate that homophilic CD166 interactions on hematopoietic cells, especially HPC, contribute to a more robust hematopoietic outcome. This is of potential importance for clinical transplantation of umbilical cord blood (CB) since CB cells, when clinically used in HCT engraft neutrophils and platelets slower than mobilized peripheral blood or bone marrow cells14. Single cell RNA-seq (scRNA-seq) analysis of freshly isolated highly purified HSC (CD166+ SLAM-LSK cells) from wildtype (WT) mice demonstrated that culture of WT HSC along with similar phenotypically defined cells from CD166 knockout (CD166−/−) mice changed the RNA expression profile of cultured cells significantly. We therefore restricted our scRNA-seq analysis to cultured HSC from WT and CD166−/− mice. These studies revealed that homophilic CD166 interactions led to activation of key molecular pathways involved in enhancing HSC/HPC functions, including cytokine, growth factor and hormone signaling, epigenetic pathways, mitochondria-related signaling pathways and other genes implicated in maintenance of stem cell pluripotency.
MATERIALS AND METHODS
Mice
C57BL/6J (8- to 12-week-old) mice were used for collection of osteoblasts (OB), bone marrow (BM) cells and subsequent BM CD166− Lineage−Sca-1+CD117+ (LSK) and CD166+ LSK cell isolation. Wildtype (WT) male and female mice and CD166 knockout (CD166−/−) (8- to 12-week-old) mice were used for BM LSK, and CD150+CD48− (SLAM) LSK cell isolation. We verified knock-out of CD166 in BM cells by flow cytometry12. Mice were bred and housed in the animal facility at Indiana University. All animal experiments followed protocols approved by the Institutional Animal Care and Use Committee of Indiana University School of Medicine.
Cell isolation and culture
Preparation of mouse long bone OBs and culture.
OB were isolated from tibias and femurs of 8- to 12-week-old C57BL/6 mice, after flushing BM cells in PBS; diaphyses and epiphyses were combined, cut into less than 1-mm segments, and washed twice with PBS. Bone segments were subjected to 3 consecutive collagenase digestions (Worthington Chemical Corporation, Lakewood, NJ, USA)10,15. Cells were collected after each cycle, pooled, and sorted by using Sca1 and a CD45, CD31, and Ter119 “lineage” cocktail10. Preparation of OB was initiated 7 days before seeding at time 0 (D0) with 1000 freshly sorted C57BL/6–derived CD166+ or CD166− LSK cells per well. Cultures were incubated at 5% O2, 5% CO2, and supplemented with exogenous cytokines as detailed in the legend of Figure 1.
Figure 1. HPC generating capabilities of CD166+ LSK and CD166− LSK cells cultured with OBs.
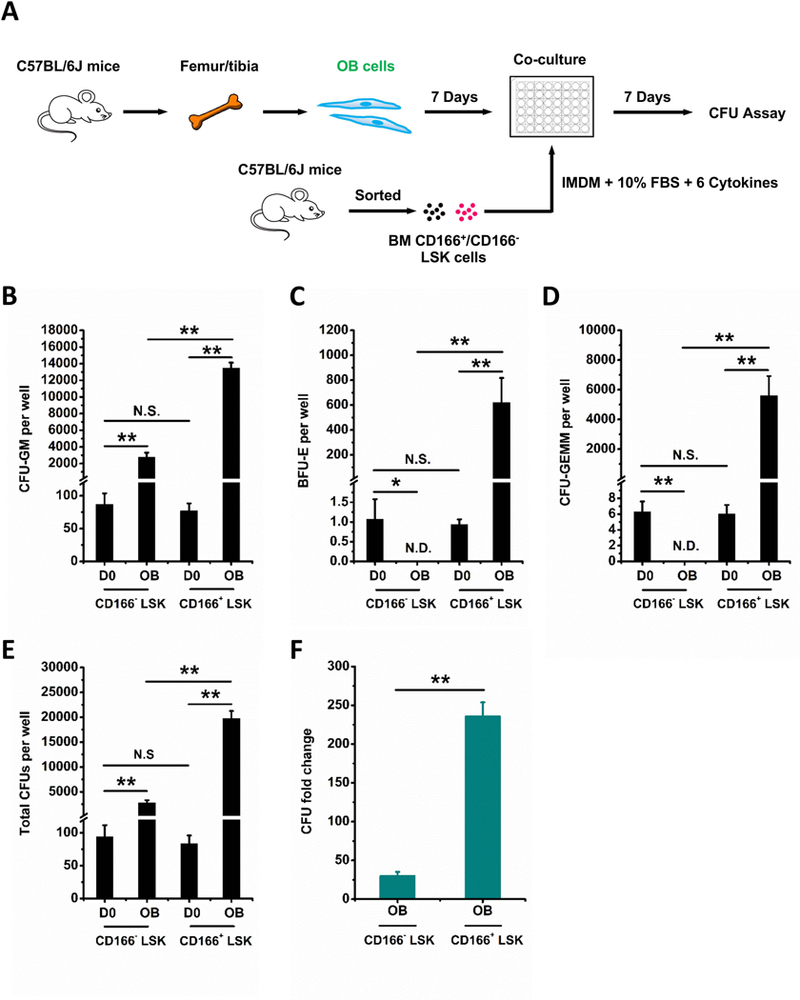
(A) Illustration of OB, CD166+ and CD166− LSK cell isolation, co-cultures and analysis. Preparation of OBs was initiated 7 days before seeding at time 0 (D0) with 1000 freshly sorted C57BL/6–derived CD166+ or CD166− LSK cells per well. OBs were cultured in a-MEM medium with 10% FBS, 1% Penicillin-Streptomycin, 1% L-glutamine. Once CD166+ and CD166− LSK cells were seeded, the medium was changed to a 1:1 mixture of OB culture medium (a-MEM as described above) and LSK cell culture medium (IMDM medium with 10% FBS, 10 ng/mL recombinant murine SCF, 10 ng/mL IL-3, 20 ng/mL insulin-like growth factor 1 (IGF-1), 20 ng/mL TPO, 25 ng/mL IL-6 and 25 ng/mL Flt3L). CFU-GM (B), BFU-E (C), CFU-GEMM (D), total CFU (E), and CFU fold change (F) between D0 numbers and those obtained on D7 from the progeny of 1000 LSK cells. CFU fold increase was calculated relative to that obtained from 1000 freshly isolated CD166+ and CD166− LSK cells plated on D0. Data are pooled from 2 independent experiments, each performed in triplicates. *p < 0.05, **p < 0.01.
Isolation of mouse BM HSCs and culture.
Mouse BM lineage cell depletion was performed using a mouse lineage cell depletion kit following the manufacturer’s protocol (Miltenyi Biotec, Auburn, CA, USA). Lineage-negative mouse HSC and HPC were sorted using Lineage, Sca-1, c-Kit, CD166 or Lineage, Sca-1, c-Kit, CD150, CD48 cocktails to obtain CD166+ LSK, CD166− LSK, WT LSK, CD166−/− LSK and SLAM LSK cells12. Cultures were incubated at 37°C in a humidified atmosphere containing 5% O2, 5% CO2 and supplemented with exogenous cytokines as detailed in the legend of Figure 1.
Isolation of human CB CD34+ cells and cell culture.
Mononuclear cells from normal human cord blood (CB) (CordUse, Orlando, FL, USA) were isolated by density gradient centrifugation with Ficoll-Paque Plus (GE Healthcare, Piscataway, NJ, USA). All studies using human CB cells were approved by the Institutional Review Board of the Indiana University School of Medicine. CD34+ cells were collected using an immunomagnetic selection kit (Miltenyi Biotec, Auburn, CA, USA). Briefly, mononuclear cells were resuspended in MACS buffer (0.5% BSA, 2 mM EDTA in PBS, pH 7.2). FcR blocking reagent (Miltenyi Biotec, 130–046-702) and CD34 microbeads (Miltenyi Biotec, 130–046-702) were added sequentially, and then the cells were incubated for 30 min at 4°C. Cells were washed with MACS buffer and centrifuged at 300g for 10 min. Supernatant was aspirated, and resuspended in 1 ml of MACS buffer. Magnetic separation was performed with a MACS column (Miltenyi Biotec, 130–042-401). This procedure yielded CD34+ cells with a purity of 90–98%. CB CD34+ cells were labeled by CD34 and CD166 antibodies. CD34+, CD34+ CD166+, and CD34+ CD166− were sorted and cultured in StemSpan™ SFEM II (Stemcell technologies, Vancouver, BC, CA) at 5% O2, 5% CO2, and supplemented with 50 ng/ml thrombopoietin (TPO), 100 ng/ml stem cell factor (SCF) (both from R&D Systems, 7466-SC-010/CF), and 100 ng/ml Fms-like tyrosine kinase 3 ligand (Flt3L) (BioLegend, 710802).
Flow cytometry and antibodies
Cells were stained with flurochrome-conjugated antibodies at 4 °C for 30 min and washed with cold PBS. Cell sorting and phenotypic analysis were done using a FACSAria or an LSRII or FACSCFortessa, respectively (Becton Dickenson, San Diego, CA). OBs were isolated as described above using CD45-FITC (BD, 553080), CD31-FITC (Pharmingen, PM-01954D), Ter119-FITC (BioLegend, 116206) and Sca1-PE/Cy7 (BioLegend, 122514). For mouse BM HSC sorting and phenotyping analysis, the following antibodies were used: Lineage-Pacific Blue (BioLegend, 133306), Sca1-PE/Cy7 (BioLegend, 122514), c-Kit-APC (BioLegend, 105811), CD48-FITC (Biolegend, 103403), CD150-PerCP/Cy5.5 (BioLegend, 115921). Antibodies used for human CB cell sorting were CD34-APC (BD, 555824) and CD166-PE (BD, 559263).
Recombinant mouse or human CD166 protein treatment
For CFU and phenotyping assays, 48-well culture plates were coated with 10 μg/mL recombinant mouse (rmCD166; R&D, 1172-AL-050) or human CD166 protein (rhCD166; R&D, 656-AL-100) in Eagle’s balanced salt solution overnight at 4°C. Subsequently, coated wells were washed with Tris-buffered saline (TBS) (1×), and nonspecific sites were blocked by incubation with 2% nonfat milk in TBS at room temperature for 30 min followed by washing 3 times with TBS. For preparation of single cells for RNA-Seq (described below), 24-well culture plates were coated with 10 μg/mL rmCD166 in Eagle’s balanced salt solution overnight at 4°C.
In vitro colony-forming unit (CFU) assay
Mouse Cells were seeded in triplicate in 1.0 mL methylcellulose culture medium supplemented with 30% FBS, 2 mM L-glutamine, 0.02 mM 2-mercaptoethanol, 5% Pokeweed Mitogen Mouse Spleen Cell Conditioned Medium, 0.1 mM Hemin, 1 U/mL erythropoietin (EPO), and 50 ng/mL SCF. Colony numbers were scored on Day 7 (D7) with an inverted microscope. CB cells were seeded in triplicate in 1.0 mL methylcellulose culture medium supplemented with 30% FBS, 2 mM L-glutamine, 0.02 mM 2-mercaptoethanol, and recombinant human cytokines: 1 U/mL EPO, 50 ng/mL SCF, 10 ng/mL interleukin-3 (IL-3), and 10 ng/mL granulocyte-macrophage colony-stimulating factor (GM-CSF). Colony numbers were scored on Day 14. All cell cultures were incubated in a 5% O2, 5% CO2 humidified chamber.
Data from these assays were expressed as mean ± SD. Statistical analysis was performed using Microsoft Excel and GraphPad Prism 5.0. Paired t test was used for determination of statistical significance between two groups. One-way or two-way analysis of variance (ANOVA) was used to compare means among three or more independent groups. P values less than 0.05 were considered to be statistically significant.
In vivo transplantation
BoyJ, C57BL/6J, and C57BL/6JXBoyJ F1 mice were bred and housed at Indiana University School of Medicine. Eight- to 12-week-old mice were used. Recipients (F1 mice) received 1100 cGy (700and 400 cGy split dose, 4 hours apart) before IV injection of test cells in 200 ul PBS. All procedures were approved by the Institutional Animal Care and Use Committee of the Indiana University School of Medicine and followed National Institutes of Health guidelines. Isolated C57BL/6J (CD45.2) CD166+LSK cells (1000 or 4000 cells) were cultured for 5 days on plates covered with immobilized CD166 protein or BSA were co-transplanted with 250,000 BoyJ (CD45.1) BM mononuclear competitor cells. Chimerism was assessed monthly until 4 months post-transplantation.
ScRNA-Seq
Freshly sorted murine WT and CD166−/− SLAM LSK cells (4000 cells) were seeded in rmCD166-coated 24-well culture plates. Cells were incubated at 5% O2, 5% CO2, and supplemented with exogenous cytokines as detailed in Figure 1. Twenty hours later, cells were harvested, washed twice with cold PBS, and resuspended in PBS at a final cell density of 3×10⁵/mL. The cell suspension was then dispensed into individual Integrated Fluidic Circuits (IFC) of the Fluidigm C1 Single-Cell Auto Prep System for scRNA-seq (Fluidigm Corporation). As control, freshly isolated WT SLAM LSK cells were also dispensed into an individual Fluidigm IFC and processed for scRNAseq analysis. A total of 43 single live cells from cultured WT SLAM LSK cells, 47 from cultured KO SLAM LSK cells, and 57 single live cells from freshly isolated WT CD166+ SLAM LSK cells were captured and applied for cDNA synthesis following the protocol of Clontech SMART-Se v4 Ultra Low Input RNA Kit for Fluidigm C1 System, IFCs User Manual (Cat. Nos. 635025&635026, 032416). The resulting cDNA was quantified by PicoGreen, and up to 0.4 ng of cDNA was used for library preparation and indexing using Nextera XT DNA Library Prep Kit (Illumina, Inc.). Libraries were pooled in equal volumes and quality was assessed by Qubit and Agilent Bioanalyzer. Five microliter of 4 nM pooled libraries were used for 150b paired-end sequencing on NextSeq 500.
ScRNA-seq data processing
ScRNA-seq FASTQ data were mapped to mouse genome GRCm38 version 90 by using STAR sequencing aligner with gene level counts called by featureCounts16,17. Sequencing quality was assessed by FASTQC and cell level data quality was examined by using the expression levels of ribosome and mitochondrial genes18. Twelve cells with high mitochondrial gene expression were identified as low-quality cells and excluded from further analysis. Log scaled RPKM expression value of each gene was further fitted by our previously developed left truncated mixture Gaussian distribution for significant expression and differential gene expression analysis19,20. Our analysis identified 9386 significantly expressed genes, among which 821 (8.7%) were fitted by one Gaussian peak, 6710 (71.5%) genes were fitted by a mixture of two Gaussian peaks, and 1845 genes (19.7%) were fitted by a mixture of more than two Gaussian peaks.
ScRNA-seq data analysis
Differential gene expression analysis was conducted by using the fitted Left Truncated Mixture Gaussian (LTMG) distribution for each gene20. If the expression of one gene in all the cells was fitted by one Gaussian distribution, Mann Whitney test was then applied for the differential expression test. If the expression of one gene fitted at least two Gaussian distributions, each sample was assigned to one Gaussian component based on maximal likelihood and the Fisher exact test was then used for differential gene expression test. Significant differential gene expression was determined by using a cutoff p<0.05. Bi-clustering analysis was conducted with the QUBIC1.0 R package using the following default parameters -q 0.35, -f 0.1, -c 0.95 and 1. Seurat R package was applied for principle component analysis and tSNE plots using default data normalization parameters21. The Monocle pacakage was used for cell trajectory analysis with default parameters and tSNE dimension reduction methods22.
Pathway enrichment analysis
Ingenuity Pathway Analysis (IPA, Ingenuity System Inc, USA, http://www.ingenuity.com/) was used to alter significant genes, identify global canonical pathways and dynamically generate biological networks. The core component of IPA is the Ingenuity Pathways Knowledge Base (IPKB), which contains the biological function, interaction, and related information of a curated gene set and more than 330 biochemical pathways. Using the whole gene set of IPKB as the background, the genes with their symbols and the corresponding GenBank accession numbers were uploaded into the IPA with a view to revealing the enriched biochemical pathways. All the pathways with one or more genes overlapping the candidate genes were extracted. In IPA, each of the canonical pathway was assigned a P value via Fisher’s exact test, which denoted the probability of overlap between the pathway and input genes. Reported significance was defined as P< 0.05 with a fold change (FC) larger than 1.5.
RESULTS
Hematopoietic properties of murine BM CD166+ and CD166− LSK cells cultured with OB.
To assess the impact of CD166 hemophilic interactions on maintenance of hematopoietic function, we assayed CFU production in short-term co-cultures of OB expressing CD166 with LSK cells fractionated based on expression or lack thereof of CD166 (Figure 1A). We decided to use LSK cells rather than a more purified group of engrafting stem cells because we felt LSK cells will be more enriched for CFU that can be assessed by clonogenic assays than more purified groups of cells. Co-cultures were initiated with an equivalent number of cells. CD166+ and CD166− LSK input cells (D0) contained equivalent numbers of CFU-GM, BFU-E, CFU-GEMM and total CFUs (Figure 1B–E). CFU production was significantly higher over a period of 7 days in co-cultures initiated with CD166+ LSK cells compared to their CD166− counterparts (Figure 1B–D). Over a period of 7 days, numbers of total CFU in OB+CD166+ LSK co-cultures increased 236±18-fold while that in OB+CD166− LSK co-cultures increased only 30±5-fold (Figure 1F), These data demonstrate an almost 8-fold increase with CD166+ LSK cells and suggest that the OB-mediated enhanced HPC function likely entailed CD166 interactions.
Effects of recombinant mouse CD166 protein on murine BM CD166+ and CD166− LSK cells.
To further analyze HPC function of CD166+ and CD166− LSK cells, these fractions were cultured in BSA-, or recombinant mouse CD166 protein (rmCD166)-coated 48 well plates (Figure 2A). Numbers of initiating CFU-GM, BFU-E, CFU-GEMM and total CFUs of CD166+ and CD166− LSK cells at D0 were not significantly different (Figure 2B–E). However, numbers of CFU-GM, BFU-E, CFU-GEMM were significantly higher in rmCD166/CD166+ LSK cultures on D7 compared with rmCD166/CD166− LSK and BSA/CD166+ LSK cultures (Figure 2B–D). Numbers of total CFU in rmCD166/CD166+ LSK cultures showed a 65±4-fold increase relative to D0 values while rmCD166/CD166− LSK cultures had only 6±2-fold increase (Figure 2E and F). This demonstrates that CD166-CD166 interactions play a role in enhancement of HPC generation ex-vivo. The higher CFU-fold increase between CD166- and CD166+ cells incubated on BSA (Figure 2E) suggests that CD166+ cells have a higher proliferative potential than similar cells that are CD166-.
Figure 2. Effects of recombinant mouse CD166 protein (rmCD166) on the generation of HPCs from CD166+ and CD166− LSK cells.
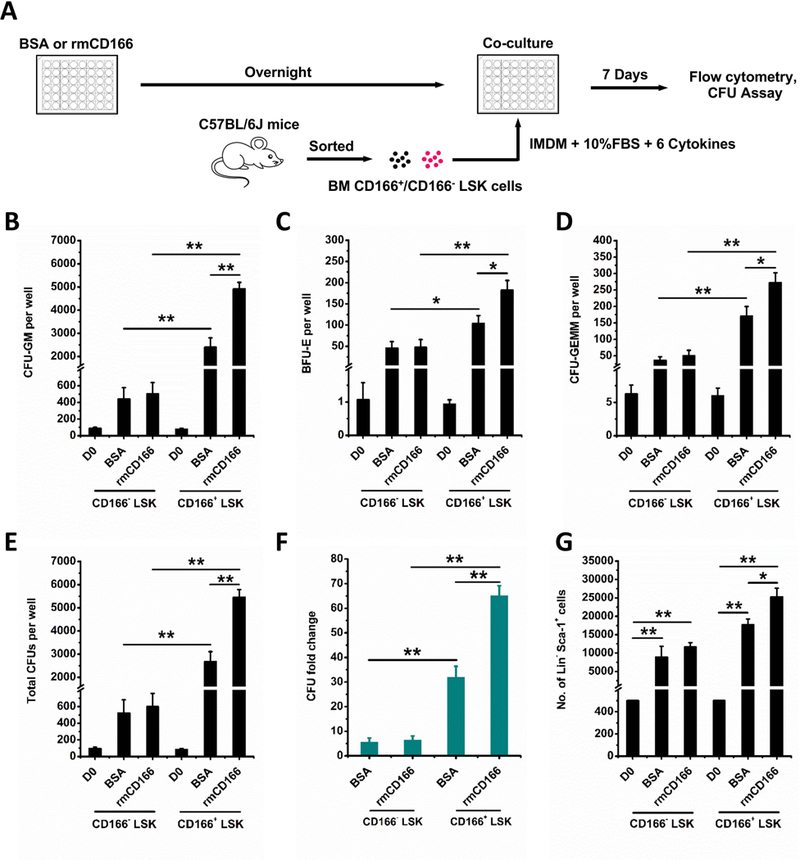
(A) Schematic diagram of rmCD166 coating, CD166+ and CD166− LSK cell isolation, culture and analysis. Coating of rmCD166 (or BSA as control) was initiated 1 day before seeding at time 0 (D0) with 500 freshly sorted C57BL/6–derived CD166+ or CD166− LSK cells per well. CD166+ and CD166− LSK cells were cultured in IMDM medium with 10% FBS. Medium was supplemented with exogenous cytokines as described in the legend of Figure 1. CFU-GM (B), BFU-E (C), CFU-GEMM (D), total CFU (E), and CFU fold change (F) between D0 numbers and those obtained on D7 from the progeny of 500 LSK cells. CFU fold increase was calculated relative to that obtained from 500 freshly isolated CD166+ LSK and CD166− LSK cells assayed on D0. (G) Flow cytometric analyses of the Lin− Sca-1+ population and comparison of absolute numbers of Lin− Sca-1+ cells on D7 of culture. Data pooled from 4 independent experiments, each performed in triplicates. *p < 0.05, **p < 0.01. Please note that all cultures were supplemented with exogenous cytokines, and therefore it is expected to observe a CFU-increase regardless of what substrate is used.
Cells cultured 7 days in BSA- or CD166-treated plates were harvested and analyzed for the expression of Sca1 and lineage markers (Figure 2G) and for cell-cycle status (Suppl Figure 1). Because expression of c-Kit is quickly downregulated via internalization of the receptor in cultures supplemented with exogenous SCF23,24, we did not use c-Kit to track the phenotypic makeup of cultured cells on D7. A significantly higher number of Lin−Sca-1+ cells was present in rmCD166/CD166+ LSK cultures compared to rmCD166/CD166− LSK (Figure 2G). Cell cycle analysis of cells cultured for 7 days did not show significant differences between BSA and rmCD166 treatment (Suppl Figure 1). Collectively, these data demonstrate that CD166-homophilic interactions activate signaling pathways that enhance CFU-fold increase and the LSK phenotype. However, these results do not suggest or imply that CD166 engagement on HPC represents a superior mechanism for hematopoietic cell expansion.
Impact of homophilic CD166 interaction on WT and CD166−/− LSK cells
WT and CD166 knockout (CD166−/−) cells were cultured with or without homophilic CD166 interactions with rmCD166. The progeny of WT LSK and CD166−/− LSK cells cultured in BSA- or rmCD166-coated 48 well plates were examined for their CFU content (Figure 3A). Numbers of CFU-GM, BFU-E, CFU-GEMM and total CFU from WT LSK and CD166−/− LSK at D0 were not statistically different. However, numbers of CFU-GM, BFU-E, CFU-GEMM produced in culture were significantly increased in rmCD166/WT LSK cultures compared to those obtained in rmCD166/CD166−/− LSK cultures (Figure 3B–D). Numbers of total CFUs in rmCD166/WT LSK cultures showed a 31±3-fold increase while rmCD166/CD166−/− LSK cultures had only 10±4-fold increase (Figure 3E and F). This demonstrates the enhancing effect of CD166 interactions, and the negative impact of loss of homophilic CD166 interactions.
Figure 3. Impact of homophilic CD166 interactions on WT LSK and CD166−/− LSK cells.
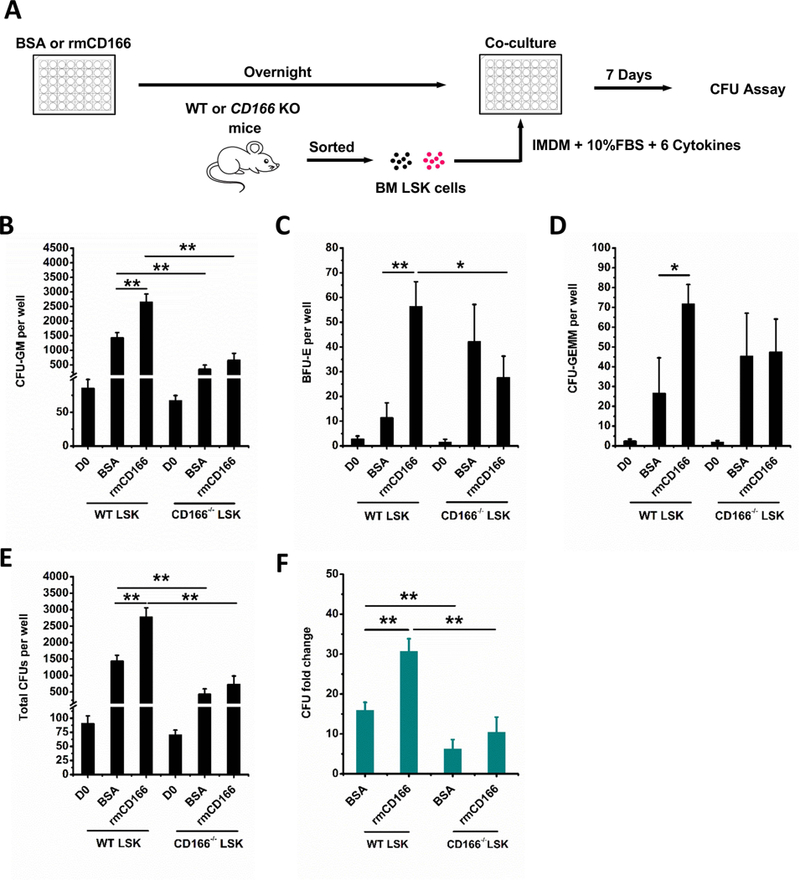
(A) Schematic illustration of rmCD166 protein treatment, wide type (WT) and CD166 knockout (CD166−/−) LSK cell isolation, culture and analysis. Coating of 48-well culture plates with 10 μg/mL rmCD166 (BSA as control) in Eagle’s balanced salt solution overnight at 4 °C was initiated 1 day before seeding at time 0 (D0) with 500 freshly sorted WT LSK and CD166−/− LSK cells per well. Cultures were incubated at 5% O2, 5% CO2 and supplemented with exogenous cytokines as detailed in Figure 1. CFU-GM (B), BFU-E (C) CFU-GEMM (D), total CFU (E), and CFU fold change (F) between D0 numbers and those obtained on D7 from the progeny of 500 LSK cells. CFU fold increase was calculated relative to that obtained from 500 freshly isolated WT LSK and CD166−/− LSK cells assayed on D0. Data are pooled from 3 independent experiments, each performed in triplicates. *p < 0.05, **p < 0.01.
Impact of recombinant human CD166 protein on human CB HPCs
Although the majority of CD34+ cells in human CB expressed CD166 (~95%), CD34+, CD34+CD166+, and CD34+CD166− cells were assayed for their colony-forming unit content before and after culture in BSA- or recombinant human CD166 protein (rhCD166)-coated 48 well plates (Figure 4A). While numbers of CFU-GM, CFU-GEMM in input wells at D0 were statistically similar, their numbers were significantly higher in rhCD166/CD34+ and rhCD166/CD34+CD166+ cultures compared with rhCD166/CD34+CD166− cultures (Figure 4B–D). Numbers of total CFUs in rhCD166/CD34+ and rhCD166/CD34+CD166+ cultures showed 28±1-fold and 30±4-fold increases, respectively, while rhCD166/CD34+CD166− cultures had only 9±0.4-fold increase. These data suggest conserved homophilic CD166 interactions between rhCD166 or rmCD166 and CD166 expressed on human and mouse hematopoietic cells, respectively.
Figure 4. Impact of recombinant human CD166 protein (rhCD166) on generation of HPCs from human CB CD34+ cells.
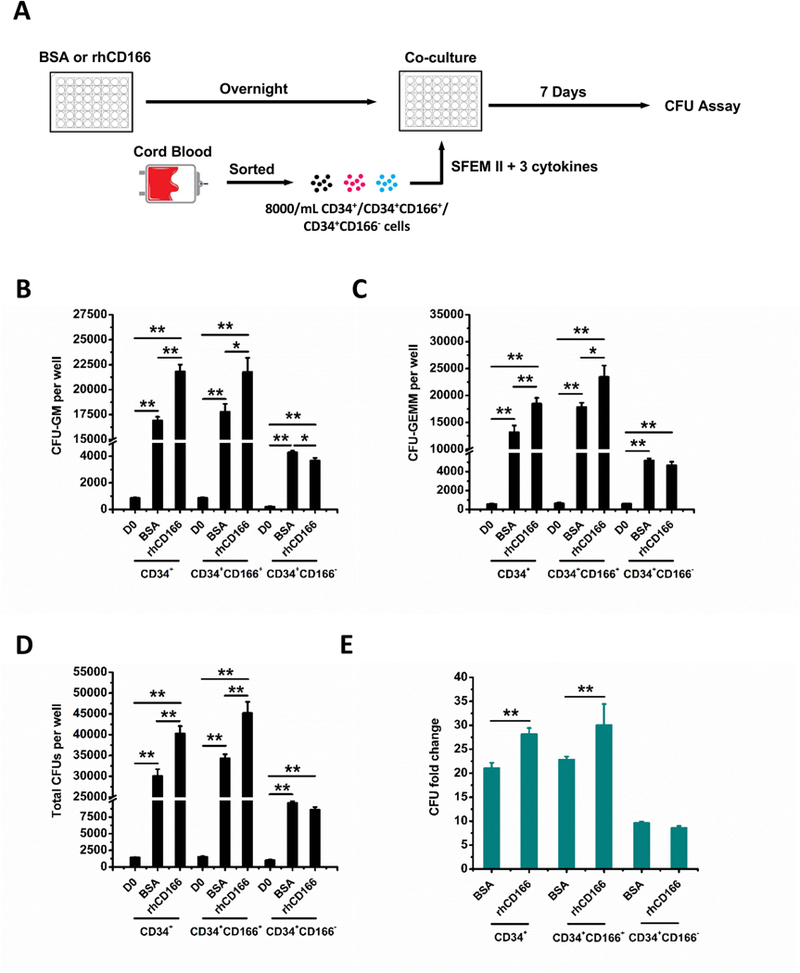
(A) Schematic representation of rhCD166 protein treatment, CD34+, CD34+CD166+, CD34+CD166− cell isolation, culture and analysis. Coating of 48-well culture plates with 10 μg/mL rhCD166 (BSA as control) in Eagle’s balanced salt solution overnight at 4 °C was initiated 1 day before seeding at time 0 (D0) with 4000 freshly sorted CD34+, CD34+CD166+, CD34+CD166− cells per well. Cultures were cultured in StemSpan™ SFEM II supplemented with human cytokines: 50 ng/ml TPO, 100 ng/ml SCF, and Flt3L and incubated at 5% O2, 5% CO2. Analysis of CFU-GM (B), CFU-GEMM (C), total CFU (D), and CFU fold change (E) between D0 numbers and those obtained on D7 from the progeny of 4000 cells from each phenotype. CFU fold increase was calculated relative to that obtained from 4000 freshly isolated CD34+, CD34+CD166+, and CD34+CD166− cells plated on D0. Data is pooled from at least 4 independent experiments, each performed in triplicates. *p < 0.05, **p < 0.01.
Single Cell transcriptomics profiling of WT and CD166−/− SLAM LSK cells incubated with immobilized CD166 protein
Single cell (sc) RNA-seq data were collected from 43 sorted murine BM WT SLAM LSK and 47 CD166−/− SLAM LSK cells after 20 hours culture with rmCD166. These results were compared to those obtained from the analysis of 57 freshly isolated WT CD166+SLAM LSK cells. ScRNA-seq data were analyzed with Seurat for removal of low quality cells with high mitochondrial gene expressions (Suppl Figure 2), and correction of genotype independent variations, such as cell cycle gene expression21. Analysis of the 3 data sets on a tSNE plot using all these genes (Figure 5A) and selected genes in cell proliferation, central metabolic pathways, and hematopoietic pathways (Suppl Figures 3 and 4) revealed that freshly isolated WT CD166+SLAM LSK cells segregated separately from cultured WT or KO SLAM LSK cells. This finding suggests that culture of both types of cells generates a unique gene profile and that comparisons of data from fresh versus cultured cells may generate biological artifacts. We therefore limited our further comparisons to cultured WT and KO SLAM LSK cells.
Figure 5. Single cell data analysis.

(A) Analysis of the 3 data sets from 3 separate cell types as indicated in the Figure legend on a tSNE plot. (B) PCA plot of significantly expressed genes after cell cycle correction. (C and D) PCA and tSNE plots of the differentially expressed genes suggest distinct differences between CD166−/− and WT cells. (E and F) Predicted cell trajectories using genes of mitochondria-mediated signaling, Epigenetic, Cytokine,growth factor and hormone signaling, Cell communication, Cell cycle signaling, Metabolic, Translational regulation, and Stem Cell Pluripotency. (G) Gene expression profile of selected genes. (H, I) Gene expression profile of differentially expressed stem cell pluripotency and metabolic genes. CD166 KO and WT samples are colored by green and pink, respectively, on the column side color bar.
In the remaining cells, 9386 genes were identified as significantly expressed. MDS plot of the top-2 principal components (PCs) of significantly expressed genes suggest a slight difference between WT and CD166−/− SLAM LSK cells (Figure 5B). PC analysis using Seurat revealed that the top PCs were enriched by cell cycle phase genes and were not distinctive for the two cell groups (Suppl Figure 5).
Considering most phenotypic characteristics of the LSK cells would be highly similar, we conducted differential gene expression (DEG) analysis for the scRNA-seq data by using the LGMT model. We identified 518 and 174 genes that were up- or down- regulated in CD166−/− versus WT cells (Figure 5B, Suppl Table 1). MDS and tSNE plots of the differentially expressed genes suggest distinct differences between CD166−/− and WT cells (Figure 5C and D). Pathway enrichment analysis of DEGs was conducted by Ingenuity pathway analysis (IPA). 148 canonical pathways enriched by the up-regulated genes were identified in CD166−/− SLAM LSK cells, including cell cycle and cell cycle signaling, translational regulation, pluripotency- and mitochondria-related signaling pathways. On the other hand, 268 pathways were impacted by the downregulation of genes in CD166−/− SLAM LSK cells including cell pluripotency genes, oxidative stress response, and metabolism (Suppl Figures 6 and 7). Detailed lists of differentially expressed genes and enriched pathways are given in Suppl Table 2.
A cell trajectory reflecting associations among cells was further inferred by using expression profile of the DEGs in the significantly enriched pathways22. Our analysis revealed two clusters of WT cells and one cluster of CD166−/− cells over the trajectory, as shown in Figures 5E and F. One cluster of WT cells reveals over expressed stemness markers, under expressed oxidative phosphorylation and glucose metabolism, and medium expression of cell cycle genes. The second cluster of WT cells shows medium expression of stemness and glucose metabolism and low expression of cell cycle genes. In contrast, CD166−/− cells are consistently linked with low expression of stemness marker genes, and high expression of oxidative phosphorylation, glucose metabolism, and cell cycle genes. In addition, CD166−/− cells consistently reveal over expressed ER-stress and oxidative stress responsive genes. Selected gene expression patterns and gene expression profiles of dysregulated stem cell genes, glucose metabolism and stress response genes are shown in Figure 5G. All the differentially expressed genes are given in Suppl Table 1.
Impact of CD166 knockout on gene expression patterns
Our analysis suggests down regulated stemness marker genes and up regulated glycolytic metabolism genes in CD166−/− cells. Figure 5H and 5I show heatmaps of dysregulated stemness marker and glycolytic metabolism genes. It is noteworthy that most of the dysregulated genes are only expressed by a subset of cells, suggesting possible heterogeneous gene dysregulations, i.e. different CD166−/− cells may have distinct impact caused by CD166 knockout. To further elucidate how the dysregulated genes are associated with each other, we conducted gene co-expression analyses to construct networks in CD166−/− cells using DRG in the enriched pathways. We observed that genes of all enriched pathways were highly connected in the co-expressed networks and none of the pathways formed a distinct co-expression module. This suggests that the impact of loss of CD166 on cell cycle, metabolism, growth factors and stemness pathways is highly associated. Sixteen hub genes namely Suclg1, Cct4, Dnaja2, Grtf2e2, Pgk1, Tcp1, Slc16a1, Eif4a1, Npm1, Ndufs3, Ndufs11, Cox4i2, Anapc13, Jak3, Runx3, and Cdk6 were identified in the co-expression network.
To characterize the transcriptomic variations of the DEGs through different cells, we applied our in-house developed bi-clustering algorithm QUBIC to identify modules of genes that were co-up-regulated in certain subset of cells25. Our analysis identified 39 gene co-up-regulation modules that form one big block in CD166−/− cells and 35 modules that form three blocks in WT cells (Suppl Figure 8). Pathway analysis revealed that genes in the enriched pathways including cell cycle, glycolytic metabolism, growth factor and hormone-, epigenetic-, and mitochondria-related signaling pathways are diversely distributed through the modules of the CD166−/− cells. These findings suggest that modules more closely corresponded to CD166’s impact over different cell states rather than on individual pathways. In contrast, there is one module enriched by translational genes such as ribosomal proteins, suggesting CD166’s specific impact on translational regulation.
In vivo transplantation data
To corroborate our in vitro CFU data and our scRNAseq analysis, we examined the impact of CD166 engagement on stem and progenitor cells in vivo. In 2 independent experiments, we transplanted WT CD166+LSK cells incubated for 5 days over immobilized rmCD166 protein or BSA and monitored chimerism monthly for a period of 4 months post-transplantation. As can be seen in Figure 6, chimerism was significantly higher at 8 weeks post-transplantation in recipients of cells incubated over rCD166 protein, but at 16 weeks post-transplantation significance was lost although the difference in the levels of chimerism in recipients of the two types of cells remained evident. These data suggest that engagement of CD166 on the surface of short-term and long-term repopulating cells most likely impacts short-term HSC leading to changes in the repopulating potential of graft cells immediately after transplantation rather than at more advanced time points.
Figure 6. Chimerism data from in vivo transplantation studies.
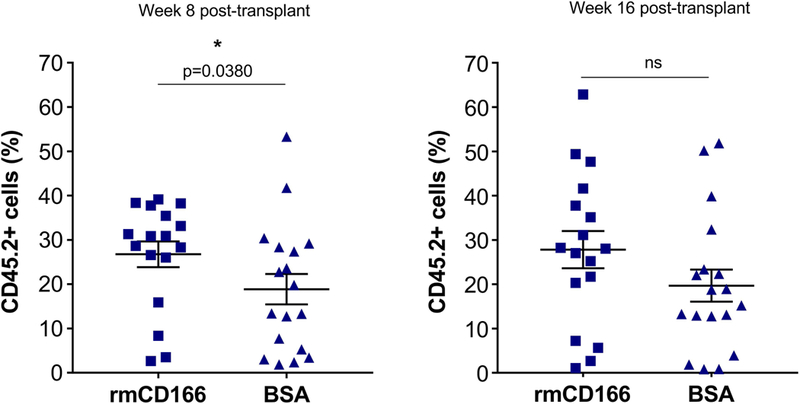
Data from two independent experiments showing chimerism levels at 8 weeks and 16 weeks post-transplantation. Each symbol represents a single mouse. CD166+ LSK cells were cultured for 5 days on plates covered with immobilized CD166 protein or BSA then co-transplanted with 250,000 BoyJ (CD45.1) BM mononuclear competitor cells. n=17 for rmCD166 and n=18 for BSA groups.
DISCUSSION
HSC and HPC are key players in therapeutic treatment with HCT, and are regulated by a number of interactions and signaling pathways. Understanding the regulation of HSCs and HPCs allows for their specific manipulation for therapeutic benefits.
CD166, a member of the superfamily of immunoglobulin receptors with five immunoglobulin-like domains (VVC2C2C2) in the extracellular domain, facilitates heterophilic (CD6-CD166) and homophilic (CD166-CD166) cell-cell interactions5,6,26. A very small percentage of LSK or SLAM-LSK cells (<5%) express CD6, while CD6 expression on OB could not be detected (Suppl Figure 9). Therefore, we do not believe that heterophilic interactions of CD166 with CD6 account for the observed findings. While expressed in a wide variety of tissues and cells, CD166 is restricted to subsets of cells usually involved in dynamic growth and/or migration processes26,27. Aberrant expression of CD166 leads to various pathological conditions and its abnormal expression levels and/or presence of abnormal amounts of soluble CD166 make it a possible prognostic marker and target for therapy28. CD166-mediated interactions are important during maturation of HSC in blood forming tissues, neural development, immune responses and tumor progression. Previously, we showed that CD166 is a marker of immature osteoblasts and a functional marker on murine and human long-term marrow repopulating HSCs12. We also demonstrated that as osteoblasts mature and lose CD166 expression, they also lose their ability to support hematopoiesis10,29. Yet, it remained unclear whether homophilic engagement of CD166 on the surface of HSC/HPC enhances the hematopoietic production and/or function of these cells. Our present studies demonstrate that homophilic engagement of CD166 on the surface of hematopoietic progenitors augments the hematopoietic potential of these cells as measured by both in vitro and in vivo assays.
Here, we show that CD166-CD166 homophilic interaction enhances the in vitro generation of murine and human HPCs. This demonstrates the positive effects of homophilic CD166 interactions involving CD166 molecules expressed on the surface of murine and human HPCs. When we used scRNAseq analysis to better understand how engagement of CD166 modulates HPC function, we observed a very interesting phenomenon which has bearing not only on our studies, but on other similarly designed studies. As can be seen in Figure 5A (Suppl Figures 3 and 4), freshly isolated cells displayed a totally different gene expression profile than identical cells maintained in culture for a short period of time. This highlights the impact of ex vivo culture on the gene expression profile of cells and suggests that in similar studies, comparisons between fresh or cultured cells only should be made rather than comparisons between identical cell types maintained in two disparate physiologic conditions. Based on this, we restricted our comparisons to cultured WT and CD166−/− SLAM LSK cells.
To do that, we applied QIAGEN’s Ingenuity Pathway Analysis (IPA) to DEGs of our scRNA-Seq data, analyzing up- and down-regulated DEGs separately between CD166+ (WT) and CD166−/− SLAM LSK cells incubated for 20hr over rmCD166. Enrichment assays revealed cytokine, growth factor and hormone-, pluripotency- and mitochondria-related signaling pathways were down-regulated, and metabolic signaling and unfolded protein responses were up-regulated in the phenotypically defined group of CD166−/− CD150+CD48− (SLAM) LSK cells incubated with immobilized CD166 protein. These results suggest that loss of CD166 engagement induces the upregulation of genes associated with differentiation and the downregulation of genes-associated with stemness. We compared gene expression between SLAM-LSK to similar data from progenitor cells available in the public domain30. We namely compared our data to that from GMP (general myeloid progenitors), MEP (megakaryocyte-erythrocyte progenitor), CLP (common lymphoid progenitor), and MkP (megakaryocyte progenitors) from an independent mouse microarray data set30 (Suppl Figure 10). A gene is considered a marker of one cell type if the gene is among the top 10% expressed genes in that cell type and among the less than 70% expressed genes in all the other cell types. We checked the ratio of the cell type-associated genes to that of genes that are up and down regulated in CD166−/− KO vs WT SLAM-LSK cells incubated with rmCD166 protein. Our analysis revealed that the upregulated genes in CD166−/− HSC were mostly GMP-associated genes and none of the GMP-specific genes were down regulated. On the other hand, the down-regulated genes were mostly HSC-specific and none of the HSC-associated genes were up regulated. These data suggest that failure to engage CD166 on phenotypically defined SLAM-LSK cells decreases the expression of stemness genes and increases the expression of differentiation-associated genes (those associated more with GMP for example). These conclusions where partially supported by in vivo transplantation studies which showed a significant enhancement of short-term HSC activity when CD166 on graft cells was engaged. Although augmented but not significant under conditions employed in our studies, enhancement of hematopoiesis due to CD166 engagement extended to long-term repopulating cells (Figure 6). Given that we previously documented12 that CD166−/− cells are almost completely void of engraftment potential, cells used in our scRNAseq studies were not identical to those used in transplantation studies. Therefore differences in the history of CD166 expression on hematopoietic cells may explain the potential differences between in vitro and in vivo results.
Among the down-regulated cytokine growth factor (p=10−4), and hormone-related signaling pathways, platelet-derived growth factor (PDGF) signaling (p=2×10⁻⁵) is the most obvious one. PDGF signaling networks consist of four ligands, PDGFA-D, and two receptors, PDGFR α and PDGFR β. It is involved in regulation of the growth and survival of different cell types. Platelet-derived growth factor receptor (PDGFR) signaling plays a crucial role in specifying mesenchymal stem cell commitment to mesenchymal lineages31–33. Inhibition of the PDGF signaling pathway results in loss of pericytes and a reduction in vessel density in the neovascularized cornea that correlates with reduced expression of PDGF, ang1/2, and VEGF mRNA34,35. Interestingly, the most prominent phenotype of CD166−/− mice is retinal dysplasias and defasciculation of both retinal ganglion cell axons and motor axons36 demonstrating that our scRNAseq identified critical CD166 pathways and modulators which apparently also play a significant role in hematopoiesis.
HSC quiescence is maintained by glycolytic metabolism and low levels of reactive oxygen species (ROS), which indicate that mitochondria are relatively inactive in quiescent HSC37. However, HSC cycling and exit of quiescence state require a swift metabolic switch from glycolysis to mitochondrial oxidative phosphorylation38,39. Here, we showed that mitochondria dysfunction-mediated signaling pathways were down-regulated while metabolism and unfolded protein responses were up-regulated in CD166−/− SLAM LSK cells incubated with immobilized CD166 protein. We recently identified glucocorticoid (GC) hormone signaling as an activator of CXCR4 expression in human CB HSCs and HPCs40. We also showed that short-term GC pretreatment of human CB HSCs and HPCs promoted SDF-1–CXCR4-axis-mediated chemotaxis, homing, and long-term engraftment when these cells were transplanted into primary and secondary NSG recipient mice40. Herein our scRNA-seq data additionally showed CXCR4 signaling and glucocorticoid receptor signaling were down-regulated in CD166−/− SLAM LSK cells incubated with immobilized CD166 protein, illustrating the attenuation of hematopoietic function without CD166 homophilic interactions. We previously demonstrated that expression of CD166 is important in mediating HSC function and the competence of the hematopoietic niche12. Together, our previous work and that reported here strongly suggest that homophilic CD166 interactions involving HSCs are required for the activation of essential pathways that sustain HSC function and HPC production. Our transplantation studies also suggest that engagement of CD166 on highly purified HSC enhances hematopoietic function especially that of short-term repopulating cells.
Supplementary Material
Acknowledgments
We thank other members in the Broxmeyer laboratory for helpful discussion and assistance and the Flow Cytometry Resource Facility of the Indiana University Simon Cancer Center for sorting assistance. We thank Xiaoling Xuei and Patrick C. McGuire from the informatics Core of the Indiana University School of Medicine for scRNA-seq assistance. This work was supported by Public Health Service Grants from the National Institutes of Health: R01 HL056416, R01 DK109188, R01 HL112669 to HEB, and U54 DK106846 to HEB and EFS. FCRF is partially funded by NCI grant P30 CA082709 and is partially supported by the NIH instrumentation grant 1S10D012270 (EFS).
Footnotes
Data Availability Statement
The data that support the findings of this study are available from the corresponding author upon reasonable request.
Conflicts of Interests
The authors declare no conflict of interest.
References
- 1.Singh AK, McGuirk JP. Allogeneic Stem Cell Transplantation: A Historical and Scientific Overview. Cancer Res. 2016;76(22):6445–6451. 10.1158/0008-5472.CAN-16-1311. [DOI] [PubMed] [Google Scholar]
- 2.Bonde J, Hess DA, Nolta JA. Recent advances in hematopoietic stem cell biology. Curr Opin Hematol. 2004;11(6):392–398. [DOI] [PubMed] [Google Scholar]
- 3.Lymperi S, Ferraro F, Scadden DT. The HSC niche concept has turned 31. Has our knowledge matured? Ann N Y Acad Sci. 2010;1192:12–18. [DOI] [PMC free article] [PubMed] [Google Scholar]
- 4.Morrison SJ, Scadden DT. The bone marrow niche for haematopoietic stem cells. Nature. 2014;505(7483):327–334. [DOI] [PMC free article] [PubMed] [Google Scholar]
- 5.Bowen MA, Aruffo AA, Bajorath J. Cell surface receptors and their ligands: in vitro analysis of CD6-CD166 interactions. Proteins. 2000;40(3):420–428. [PubMed] [Google Scholar]
- 6.Bowen MA, Bajorath J, D’Egidio M, Whitney GS, Palmer D, Kobarg J, Starling GC, Siadak AW, Aruffo A. Characterization of mouse ALCAM (CD166): the CD6-binding domain is conserved in different homologs and mediates cross-species binding. European Journal of Immunology. 1997;27(6):1469–1478. [DOI] [PubMed] [Google Scholar]
- 7.Masedunskas A, King JA, Tan F, Cochran R, Stevens T, Sviridov D, Ofori-Acquah SF. Activated leukocyte cell adhesion molecule is a component of the endothelial junction involved in transendothelial monocyte migration. FEBS Lett. 2006;580(11):2637–2645. [DOI] [PubMed] [Google Scholar]
- 8.Swart GWM. Activated leukocyte cell adhesion molecule (CD166/ALCAM): Developmental and mechanistic aspects of cell clustering and cell migration. European Journal of Cell Biology. 2002;81(6):313–321. [DOI] [PubMed] [Google Scholar]
- 9.Chitteti BR, Bethel M, Kacena MA, Srour EF. CD166 and regulation of hematopoiesis. Curr Opin Hematol. 2013;20(4):273–280. [DOI] [PubMed] [Google Scholar]
- 10.Chitteti BR, Cheng YH, Poteat B, Rodriguez-Rodriguez S, Goebel WS, Carlesso N, Kacena MA, Srour EF. Impact of interactions of cellular components of the bone marrow microenvironment on hematopoietic stem and progenitor cell function. Blood. 2010;115(16):3239–3248. [DOI] [PMC free article] [PubMed] [Google Scholar]
- 11.Chitteti BR, Cheng YH, Streicher DA, Rodriguez-Rodriguez S, Carlesso N, Srour EF, Kacena MA. Osteoblast lineage cells expressing high levels of Runx2 enhance hematopoietic progenitor cell proliferation and function. Journal of cellular biochemistry. 2010;111(2):284–294. [DOI] [PMC free article] [PubMed] [Google Scholar]
- 12.Chitteti BR, Kobayashi M, Cheng Y, Zhang H, Poteat BA, Broxmeyer HE, Pelus LM, Hanenberg H, Zollman A, Kamocka MM, Carlesso N, Cardoso AA, Kacena MA, Srour EF. CD166 regulates human and murine hematopoietic stem cells and the hematopoietic niche. Blood. 2014;124(4):519–529. [DOI] [PMC free article] [PubMed] [Google Scholar]
- 13.Xu L, Mohammad KS, Wu H, Crean C, Poteat B, Cheng Y, Cardoso AA, Machal C, Hanenberg H, Abonour R, Kacena MA, Chirgwin J, Suvannasankha A, Srour EF. Cell Adhesion Molecule CD166 Drives Malignant Progression and Osteolytic Disease in Multiple Myeloma. Cancer Res. 2016;76(23):6901–6910. [DOI] [PMC free article] [PubMed] [Google Scholar]
- 14.Broxmeyer HE. Long-overdue guidlines for the cord blood banking community. Stem Cells Translational Medicine. 2019;8:320–322. [DOI] [PMC free article] [PubMed] [Google Scholar]
- 15.Kacena MA, Shivdasani RA, Wilson K, Xi Y, Troiano N, Nazarian A, Gundberg CM, Bouxsein ML, Lorenzo JA, Horowitz MC. Megakaryocyte-Osteoblast Interaction Revealed in Mice Deficient in Transcription Factors GATA-1 and NF-E2. Journal of Bone and Mineral Research. 2004;19(4):652–660. [DOI] [PubMed] [Google Scholar]
- 16.Liao Y, Smyth GK, Shi W. featureCounts: an efficient general purpose program for assigning sequence reads to genomic features. Bioinformatics. 2014;30(7):923–930. [DOI] [PubMed] [Google Scholar]
- 17.Dobin A, Davis CA, Schlesinger F, Drenkow J, Zaleski C, Jha S, Batut P, Chaisson M, Gingeras TR. STAR: ultrafast universal RNA-seq aligner. Bioinformatics. 2013;29(1):15–21. [DOI] [PMC free article] [PubMed] [Google Scholar]
- 18.Ilicic T, Kim JK, Kolodziejczyk AA, Bagger FO, McCarthy DJ, Marioni JC, Teichmann SA. Classification of low quality cells from single-cell RNA-seq data. Genome Biol. 2016;17:29. [DOI] [PMC free article] [PubMed] [Google Scholar]
- 19.Zhang C, Zhang J, Zhao H, Liang J. A part-based probabilistic model for object detection with occlusion. PLoS One. 2014;9(1):e84624. [DOI] [PMC free article] [PubMed] [Google Scholar]
- 20.Cao S, Sheng T, Chen X, Ma Q, Zhang C. A probabilistic model-based bi-clustering method for single-cell transcriptomic data analysis. BioRvix. 2017. 10.1101/181362. [DOI] [Google Scholar]
- 21.Macosko EZ, Basu A, Satija R, Nemesh J, Shekhar K, Goldman M, Tirosh I, Bialas AR, Kamitaki N, Martersteck EM, Trombetta JJ, Weitz DA, Sanes JR, Shalek AK, Regev A, McCarroll SA. Highly Parallel Genome-wide Expression Profiling of Individual Cells Using Nanoliter Droplets. Cell. 2015;161(5):1202–1214. [DOI] [PMC free article] [PubMed] [Google Scholar]
- 22.Trapnell C, Cacchiarelli D, Grimsby J, Pokharel P, Li S, Morse M, Lennon NJ, Livak KJ, Mikkelsen TS, Rinn JL. The dynamics and regulators of cell fate decisions are revealed by pseudotemporal ordering of single cells. Nat Biotechnol. 2014;32(4):381–386. [DOI] [PMC free article] [PubMed] [Google Scholar]
- 23.Eto T, Winkler I, Purton LE, LÈvesque J-P. Contrasting effects of P-selectin and E-selectin on the differentiation of murine hematopoietic progenitor cells. Experimental Hematology. 2005;33(2):232–242. [DOI] [PubMed] [Google Scholar]
- 24.Yee NS, Hsiau CW, Serve H, Vosseller K, Besmer P. Mechanism of down-regulation of c-kit receptor. Roles of receptor tyrosine kinase, phosphatidylinositol 3’-kinase, and protein kinase C. Journal of Biological Chemistry. 1994;269(50):31991–31998. [PubMed] [Google Scholar]
- 25.Zhang Y, Xie J, Yang J, Fennell A, Zhang C, Ma Q. QUBIC: a bioconductor package for qualitative biclustering analysis of gene co-expression data. Bioinformatics. 2017;33(3):450–452. [DOI] [PubMed] [Google Scholar]
- 26.van Kempen LC, Nelissen JM, Degen WG, Torensma R, Weidle UH, Bloemers HP, Figdor CG, Swart GW. Molecular basis for the homophilic activated leukocyte cell adhesion molecule (ALCAM)-ALCAM interaction. J Biol Chem. 2001;276(28):25783–25790. [DOI] [PubMed] [Google Scholar]
- 27.Cayrol R, Wosik K, Berard JL, Dodelet-Devillers A, Ifergan I, Kebir H, Haqqani AS, Kreymborg K, Krug S, Moumdjian R, Bouthillier A, Becher B, Arbour N, David S, Stanimirovic D, Prat A. Activated leukocyte cell adhesion molecule promotes leukocyte trafficking into the central nervous system. Nat Immunol. 2008;9(2):137–145. 10.1038/ni1551. [DOI] [PubMed] [Google Scholar]
- 28.Jezierska A, Matysiak W, Motyl T. ALCAM/CD166 protects breast cancer cells against apoptosis and autophagy. Med Sci Monit. 2006;12(8):BR263–273. [PubMed] [Google Scholar]
- 29.Chitteti BR, Cheng YH, Kacena MA, Srour EF. Hierarchical organization of osteoblasts reveals the significant role of CD166 in hematopoietic stem cell maintenance and function. Bone. 2013;54(1):58–67. [DOI] [PMC free article] [PubMed] [Google Scholar]
- 30.Di Tullio A, Vu Manh TP, Schubert A, Castellano G, Mansson R, Graf T. CCAAT/enhancer binding protein alpha (C/EBP(alpha))-induced transdifferentiation of pre-B cells into macrophages involves no overt retrodifferentiation. Proc Natl Acad Sci U S A. 2011;108(41):17016–17021. [DOI] [PMC free article] [PubMed] [Google Scholar]
- 31.Hofer EL, La Russa V, Honegger AE, Bullorsky EO, Bordenave RH, Chasseing NA. Alteration on the expression of IL-1, PDGF, TGF-beta, EGF, and FGF receptors and c-Fos and c-Myc proteins in bone marrow mesenchymal stroma cells from advanced untreated lung and breast cancer patients. Stem Cells & Development. 2005;14(5):587–594. [DOI] [PubMed] [Google Scholar]
- 32.Morikawa S, Mabuchi Y, Kubota Y, Nagai Y, Niibe K, Hiratsu E, Suzuki S, Miyauchi-Hara C, Nagoshi N, Sunabori T, Shimmura S, Miyawaki A, Nakagawa T, Suda T, Okano H, Matsuzaki Y. Prospective identification, isolation, and systemic transplantation of multipotent mesenchymal stem cells in murine bone marrow. The Journal of experimental medicine. 2009;206(11):2483–2496. [DOI] [PMC free article] [PubMed] [Google Scholar]
- 33.Pinho S, Lacombe J, Hanoun M, Mizoguchi T, Bruns I, Kunisaki Y, Frenette PS. PDGFRα and CD51 mark human Nestin(+) sphere-forming mesenchymal stem cells capable of hematopoietic progenitor cell expansion. The Journal of Experimental Medicine. 2013;210(7):1351–1367. [DOI] [PMC free article] [PubMed] [Google Scholar]
- 34.Yao Q, Renault MA, Chapouly C, Vandierdonck S, Belloc I, Jaspard-Vinassa B, Daniel-Lamaziere JM, Laffargue M, Merched A, Desgranges C, Gadeau AP. Sonic hedgehog mediates a novel pathway of PDGF-BB-dependent vessel maturation. Blood. 2014;123(15):2429–2437. [DOI] [PubMed] [Google Scholar]
- 35.Chaoran Z, Zhirong L, Gezhi X. Combination of vascular endothelial growth factor receptor/platelet-derived growth factor receptor inhibition markedly improves the antiangiogenic efficacy for advanced stage mouse corneal neovascularization. Graefes Arch Clin Exp Ophthalmol. 2011;249(10):1493–1501. [DOI] [PubMed] [Google Scholar]
- 36.Weiner JA, Koo SJ, Nicolas S, Fraboulet S, Pfaff SL, Pourquie O, Sanes JR. Axon fasciculation defects and retinal dysplasias in mice lacking the immunoglobulin superfamily adhesion molecule BEN/ALCAM/SC1. Mol Cell Neurosci. 2004;27(1):59–69. [DOI] [PubMed] [Google Scholar]
- 37.Mantel C, Messina-Graham S, Broxmeyer HE. Upregulation of nascent mitochondrial biogenesis in mouse hematopoietic stem cells parallels upregulation of CD34 and loss of pluripotency: a potential strategy for reducing oxidative risk in stem cells. Cell cycle. 2010;9(10):2008–2017. [DOI] [PMC free article] [PubMed] [Google Scholar]
- 38.Anjos-Afonso F, Currie E, Palmer HG, Foster KE, Taussig DC, Bonnet D. CD34(−) cells at the apex of the human hematopoietic stem cell hierarchy have distinctive cellular and molecular signatures. Cell Stem Cell. 2013;13(2):161–174. [DOI] [PubMed] [Google Scholar]
- 39.Doulatov S, Notta F, Laurenti E, Dick John E. Hematopoiesis: A Human Perspective. Cell stem cell. 2012;10(2):120–136. [DOI] [PubMed] [Google Scholar]
- 40.Guo B, Huang X, Cooper S, Broxmeyer HE. Glucocorticoid hormone-induced chromatin remodeling enhances human hematopoietic stem cell homing and engraftment. Nat Med. 2017;23(4):424–428. [DOI] [PMC free article] [PubMed] [Google Scholar]
Associated Data
This section collects any data citations, data availability statements, or supplementary materials included in this article.