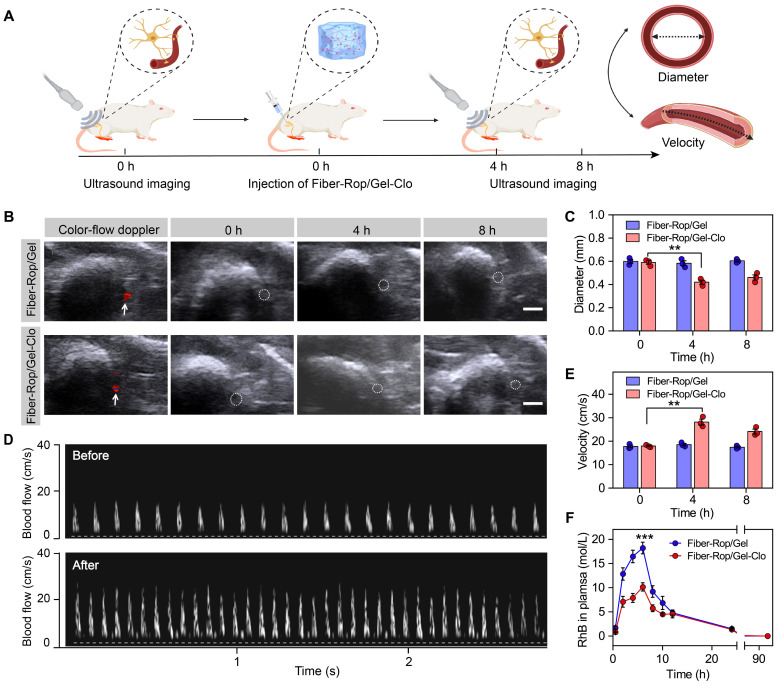
Figure 3.
Clo reduces the concentration of Rop absorbed by local vasoconstriction. (A) Schematic diagram of the experimental program to evaluate the role of Clo by ultrasound imaging. Created with BioRender.com. (B) Representative images of arterial diameter around the sciatic nerve at 0 h, 4 h, and 8 h after injection of Fiber-Rop/Gel composites with or without Clo. White arrows show the location of blood vessel and white circles show the outline of blood vessel. Scale bar, 1.0 mm. (C) Qualitative analyses of arterial diameter around the sciatic nerve at 0 h, 4 h, and 8 h after injection of Fiber-Rop/Gel composites with or without Clo. (D) Representative images of blood flow velocity at 0 h and 4 h after injection of Fiber-Rop/Gel-Clo composites. (E) Qualitative analyses of blood flow velocity around the sciatic nerve at 0 h, 4 h, and 8 h after injection of Fiber-Rop/Gel composites with or without Clo. (F) The dynamic pharmacokinetics of RhB released from Fiber-Rop-RhB/Gel composite and Fiber-Rop-RhB/Gel-Clo composite in rats. Data are shown as mean ± standard error, (n = 3/group; **P < 0.01, ***P < 0.001).

