Abstract
Background:
There is growing concern about the rising incidence and prevalence of food allergy globally. We previously reported the incidence of food allergy in Olmsted County, Minnesota, between 2002 and 2011. We sought to update the incidence and temporal trends of food allergies in our region through 2018.
Methods:
By using the Rochester Epidemiology Project, all Olmsted County residents, with an incident diagnosis of food allergy between January 2, 2012, and December 31, 2018, were identified and their medical records were reviewed. These cases were combined with the previously collected incidence cases from January 2, 2002, and December 31, 2011, to understand longitudinal trends in food allergy incidence rates.
Results:
Over the 17-year study period, 1076 patients (58.0% male patients, 72.1% white) were diagnosed with an incident food allergy. The median (interquartile range) age at first diagnosis was 2.0 years (1.1-8.4 years). The overall annual incidence rate for all ages was 3.9 (95% confidence interval [CI], 3.6–4.1) per 10,000 person-years and was significantly higher in male than in female patients (4.4 [95% CI, 4.0–4.7] and 3.3 [95% CI, 3.0–3.6], respectively; p < 0.001). The most common food allergen was egg in infancy (57.7%), peanuts in ages 1–4 years (58.3%), tree nuts in ages 5–18 years (57.4%), and seafood in adults (≥19 years) (45.3%).
Conclusion:
The incidence of food allergy in Olmsted County steadily increased from 2002 to 2008, then remained relatively stable between the years 2008 and 2013, and again presented a rising trend over the next 5 years until 2018. This warrants further investigations into the effects of changes in guidelines for early introductions of allergenic foods and other factors that affect causality.
Keywords: Food allergy, anaphylaxis, peanut, milk, egg, sesame, skin prick testing, population, incidence
Food allergy (FA) is an immediate type immunoglobin E (IgE) mediated immunologic reaction to certain foods with resultant life-threatening reactions.1,2 FA is a life-changing chronic disease that affects not only the patient but also the whole family. It has significant implications on the quality of life as well as higher economic burdens, which, at times, can be lifelong.3–5 The epidemiology of FA has been poorly defined1,2 with several previous studies that attempted to report on the question of prevalence and less so on incidence.6 A recent systematic review gave broad estimates in the prevalence of FA, which specified that FA affects > 1–2% but < 10% of the population. This underscores that the population estimates of FA are greatly limited by a lack of uniformity of the criteria for making a diagnosis.6 There is evidence for rising trends in FA from two different epidemiologic study designs by using comparable telephone surveys,7 and secondary evidence is of deciphering from the overall trend of increasing prevalence of other atopic conditions, including atopic dermatitis,8 asthma,9 and allergic rhinitis,10 which evidently started > 50 years ago, and has reached a relative plateau in the early 2000s. This atopic march was largely explained by complex gene-environment interactions mediated by the multiple environmental changes that occurred gradually from the mid-1800s.11
Beyond the environmental changes, there has been increased utilization of pesticides, plastics, and genetically modified foods,12 which may have implications to the development and persistence of FA. In addition, there have been concerns about the changing recommendations with regard to early introduction of allergenic food.5 Previous American Academy of Pediatrics (AAP) recommendations, published in 2000, advised delayed introduction of allergenic foods, including milk (until 12 months of age); egg (until 24 months of age); and peanuts, tree nuts, and seafood (until 3 years of age). However, in 2008, the AAP decided that there was a lack of sufficient evidence to support its previous recommendations. In the following years, results of a number of studies began suggesting that early introduction of allergenic foods was an effective means for primary prevention of FA in the future, which prompted the early introduction recommendation in 2013.13–16
In 2018, we published the first comprehensive population-based study of FA incidence and temporal trends over a 10-year period in Olmsted County (2002–2011).17 The study used reliable diagnostic criteria for IgE-mediated FA, which aimed to explore the role of changing guidelines on dietary recommendations for the early introduction of allergenic food. We found the incidence of FA to have had increased steadily between the years 2002 and 2009, and stabilized over the next 3 years, which may, in part, reflect the changing guidelines from AAP. By using the same unique medical records linkage system of the Rochester Epidemiology Project (REP),18 we extended our study to include the next 8 years (2012–2018) to better characterize the relationship between early introduction of allergenic foods and the development of an FA as well as to assess the overall incidence of an FA in a population-based cohort.
METHODS
This study represented an update of our previous report on the incidence and temporal trends of FAs in Olmsted County between 2002 and 2011.17 The setting, diagnostic criteria, and data analysis were maintained to present the data as a whole over a 17-year period. Olmsted County is located in southeastern Minnesota and had a population of ∼145,000 in the 2010 U.S. census. However, overall, the population of Olmsted County is less ethnically diverse, with a relatively higher level of education, wealth, and employment in health-care services than the rest of the United States.19–21 We performed a retrospective medical record review of FAs in Olmsted County by using the data resources of the REP,18 which is a unique medical records–linkage system.
All Olmsted County residents with an incident diagnosis of an FA by a REP18affiliated provider between January 2, 2012, and December 31, 2018, with approved access to their medical records for research purposes were identified by using REP18 resources. Patients who had a previous diagnosis of an FA before January 2, 2012, were excluded. Patients were included in the study if they met the following criteria: (1) a clinical history consistent with FA, and (2) supportive IgE-specific blood testing results (>0.35 kU/L), positive results on skin-prick testing (>3 mm wheal), or positive findings on open oral food challenge.
The data on the patients with an incident FA previously identified for the period between 2002 and 2011 was combined with the data on incidence cases identified for the period between 2012 and 2018. Age- and sex-specific incidence rates in Olmsted County during 2002–2018 were calculated; the numerator was the number of persons with an FA, and the denominator was obtained from the REP18 census. The rates were age and sex adjusted to the total population of the United States in 2010. The 95% confidence intervals (CI) for the rates were calculated by assuming a Poisson error distribution. The incidence rates were compared between subgroups (i.e., male versus female patients or between biennial calendar periods) by fitting generalized linear regression models when assuming a Poisson error structure. All calculated p values were two-sided, and p values < 0.05 were considered statistically significant. Data were analyzed by using SAS version 9.4 statistical software (SAS Institute, Cary, NC).
RESULTS
Baseline Patient Characteristics
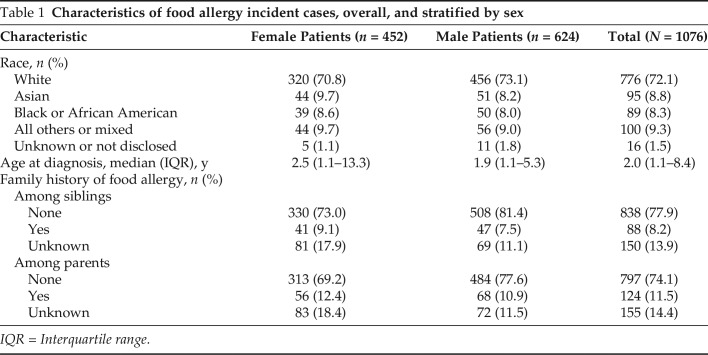
A total of 1076 incident cases of FA were identified for the entire study period 2002–2018; 578 incident cases previously identified for the period between 2002 and 2011, and 498 additional incident cases for the period between 2012 and 2018. Of the 1076 patients, 624 (58.0%) were male patients, 776 (72.1%) were white, and 89 (8.3%) were African American. The median (interquartile range) age at the time of the first FA diagnosis was 2.0 years (1.1–8.4 years [range, 0.2–89.6 years]). A positive family history of FA was noted in a parent in 124 patients (13.5% of 921) and in a sibling in 88 patients (9.5% of 926). Among the 736 diagnosed before the age of 5 years, mode of delivery was available for 695 patients, of whom, 491 (70.6%) were born vaginally and 204 (29.4%) were born via cesarean section. Within this subset, the mean ± standard deviation age at the time of the first FA diagnosis was 1.6 ± 0.9 years and 1.8 ± 1.1 years for those born vaginally versus via cesarean section, respectively, (p = 0.006). The characteristics of the FA incident cases overall and by sex are summarized in Table 1.
Table 1.
Characteristics of food allergy incident cases, overall, and stratified by sex
IQR = Interquartile range.
Types of FA
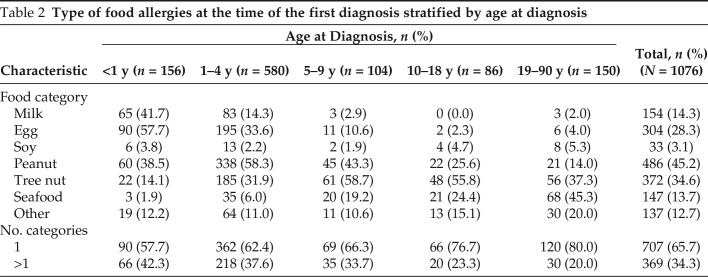
Overall, the most common FA was a peanut allergy in 486 patients (45.2%), followed by a tree nut allergy in 372 (34.6%), and an egg allergy in 304 (28.3%). A third of the patients (n = 369 [34.3%]) were allergic to more than one food category at the time of the initial diagnosis. The distribution of FAs among different age groups are detailed in Table 2. Among the 156 patients first diagnosed at <1 year of age, the most common food allergen was egg (n = 90 [57.7%]), followed by milk (n = 65 [41.7%]) and peanut (n = 60 [38.5%]), whereas, among the 580 patients first diagnosed in the 1–4 year age group, the most common allergen was peanut (n = 338 [58.3%]), followed by egg (n = 195 [33.6%]) and tree nut (n = 185 [31.9%]). Among the 190 children first diagnosed between ages 5 and 18 years, the most common allergen was tree nut (n = 109 [57.4%]), followed by peanut (n = 67 [35.3%]) and seafood (n = 41 [21.6%]). The most common allergen among the 150 patients first diagnosed in adulthood (≥19 years) was seafood (n = 68 [45.3%]). When stratified by mode of delivery at the time of birth for those first diagnosed below 5 years of age, there was no statistically significant difference in the type of FAs between those delivered vaginally and those delivered via cesarean section (data not shown).
Table 2.
Type of food allergies at the time of the first diagnosis stratified by age at diagnosis
Incidence
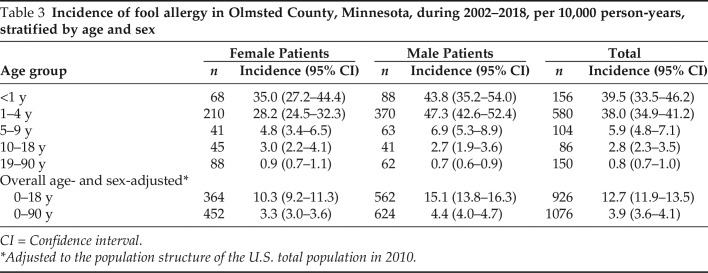
The incidence rates are summarized in Table 3. Overall, the average annual age- and sex-adjusted incidence rate for all ages was 3.9 (95% CI, 3.6–4.1) per 10,000 person-years. The annual incidence was highest among children < 1 year of age, both overall (39.5 [95% CI, 33.5–46.2]) and among the female patients (35.0 [95% CI, 27.2–44.4]). Among the male patients, the annual incidence was highest in children between 1 and 4 years of age at 47.3 (95% CI, 42.6–52.4) per 10,000 person-years. The lowest annual incidence in the male and female patients was in the age group >19 years (0.9 median [IQR] [0.7–11] and 0.7 [0.6–0.9] per 10,000 person-years, respectively). The overall annual incidence of FA was significantly higher among males than among females (4.4 [95% CI, 4.0–4.7] versus 3.3 [95% CI, 3.0–3.6] per 10,000 person-years; p < 0.001).When stratified by age, the annual incidence was significantly higher in the boys compared with the girls in children between 1 and 4 years of age (p < 0.001), but the sex difference was not statistically significant in the other age groups (p > 0.05). The biennial incidence of any FA in all the ages and in the pediatric population (ages 0–18 years) are presented in Fig. 1.
Table 3.
Incidence of fool allergy in Olmsted County, Minnesota, during 2002–2018, per 10,000 person-years, stratified by age and sex
CI = Confidence interval.
*Adjusted to the population structure of the U.S. total population in 2010.
Figure 1.
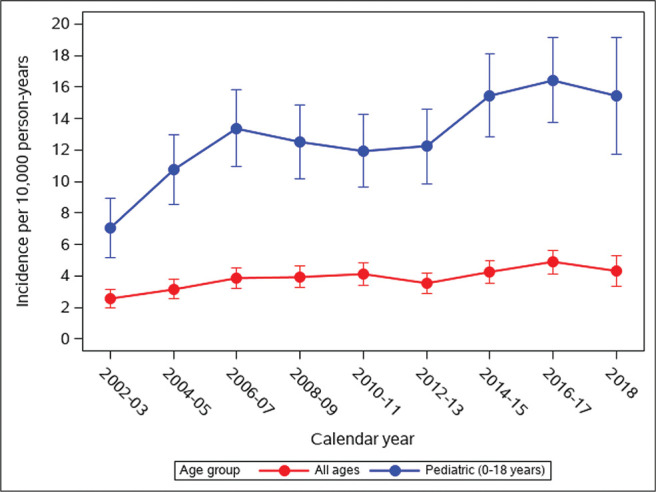
Age- and sex-adjusted biennial incidence of any food allergy per 10,000 person-years in Olmsted County, Minnesota, 2002–2018, for all ages and for ages 0–18 years. Error bars represent 95% confidence intervals (CI).
Over the 17 years reviewed in this study, the biennial incidence rates of FA among all the ages has almost doubled between 2002–2003 and 2016–2017, from 2.5 (95% CI, 2.0–3.1) to 4.9 (95% CI, 4.1–5.6) per 10,000 person years (p < 0.001). In the same time period, the pediatric (ages 0–18 years) biennial incidence rates more than doubled, from 7.0 (95% CI, 5.2–8.9) in 2002–2003 to 16.4 (95% CI, 13.7–19.2) in 2016–2017 per 10,000 person-years (p < 0.001). This striking increase in the incidence of FA was notably the result of two significant rising trends that occurred between 2002–2003 and 2006–2007 (p = 0.004 for all ages, p < 0.001 for ages 0–18 years) and between 2012–2013 and 2016–2017 (p = 0.007 for all ages, p = 0.020 for ages 0–18 years).
Eventually, in 2018, the overall and pediatric biennial incidence rates stabilized at 4.3 (95% CI, 3.3–5.3) and 15.4 (95% CI, 11.7–19.1) cases per 10,000 person-years, respectively. The annual incidence of any FA in children ages 0–4 years and those ages 0–18 years, stratified by sex, showed an overall higher incidence in boys across all years in these age groups are depicted in Fig. 2. The biennial incidence of any FA further, into three age categories, 0–1 year, 1–4 years, and 5–18 years, are stratified in Fig. 3. It is noteworthy that the incidence of FA in the two age groups, 0–1 year and 1–4 years, followed a similar trend between 2002 and 2015, after which each took a different direction. The incidence increased for the age group 0–1 year and declined for the age group 1–4 years in the year period 2016–2017 and in the year 2018. This discrepancy resulted in a statistically significant difference in the incidence of FA between the two groups for the first time during the 18 years of follow up in 2018 (p < 0.05).
Figure 2.
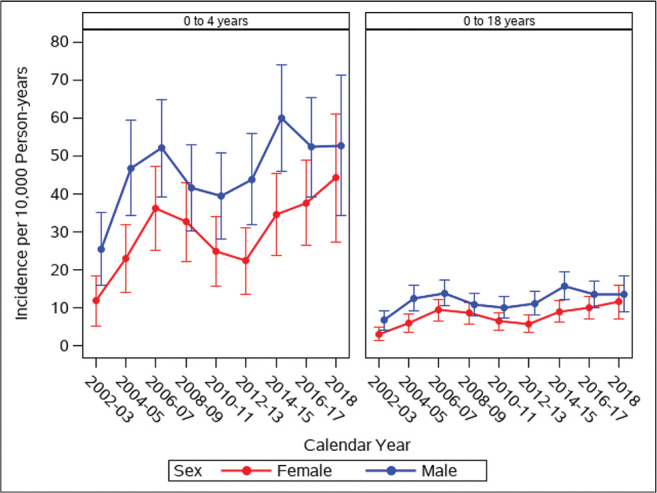
Age- and sex-adjusted biennial incidence of any food allergy per 10,000 person-years in Olmsted County, Minnesota, 2002–2018, for ages 0–4 years (left) and for ages 0–18 years (right), stratified by sex. Error bars represent 95% confidence intervals (CI).
Figure 3.
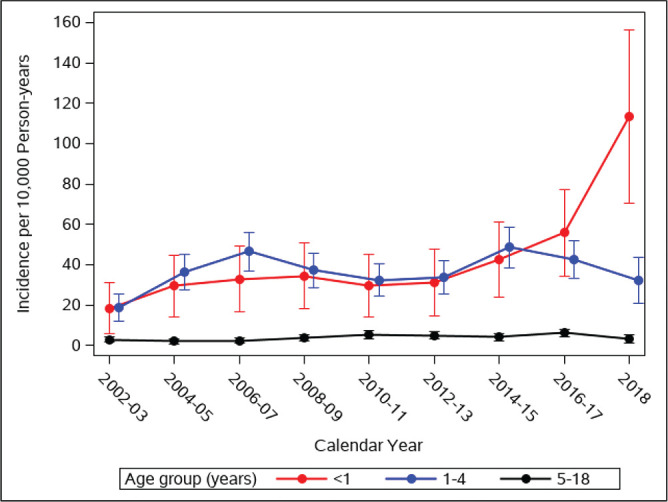
Age- and sex-adjusted biennial incidence of any food allergy per 10,000 person-years stratified by age group of children in Olmsted County, Minnesota, 2002–2018. Error bars represent 95% confidence intervals (CI).
Peanut and Sesame Allergy
The biennial incidence of peanut allergy in the pediatric population (ages 0–18 years) is shown in Fig. 4. The pediatric incidence of peanut allergy followed a similar trend to that of any FA during the first five calendar periods by showing a significant increase between 2002–2003 and 2006–2007, from 3.5 to 8.5 cases per 10,000 person-years (p < 0.001). However, unlike the incidence of any FA that only peaked in the calendar period 2016–2017 (see Fig. 1, red curve), the peak in the incidence of peanut allergy was seen earlier, in 2006–2007, after which, it significantly declined in the next calendar period (8.5 to 5.9; p = .04) and remained relatively stable between 6.2 and 7.5 per 10,000 person-years until 2016–2017. From 2016–2017 to 2018, the pediatric incidence of peanut allergy showed a second decline, from 7.5% (95% CI, 5.7–9.3) to 4.6 (95% CI, 2.6–6.6) of cases per 10,000 person-years (p = 0.048). Interestingly, the number of incident cases of sesame allergy in the pediatric population (ages 0–18 years) was stable at one case biennially between 2002 and 2009. This number jumped to six in the year period 2010–2011 and remained elevated at four to six cases diagnosed in each subsequent year. Sesame allergy was the most diagnosed allergy in the age group 1–4 years.
Figure 4.
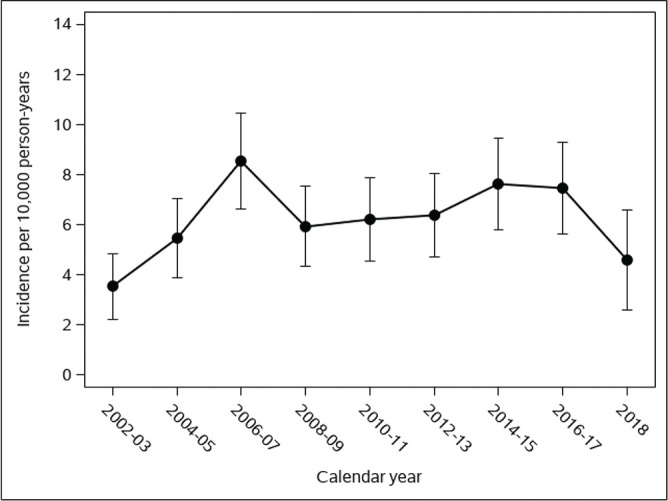
Age- and sex-adjusted biennial incidence of peanut allergy per 10,000 person-years in Olmsted County, Minnesota, 2002–2018, for ages 0–18 years. Error bars represent 95% confidence interval (CI).
DISCUSSION
In 2018, we presented the first population-based study from the United States to evaluate the incidence of FA over 10 years. We found the biennial incidence to have increased dramatically between 2002–2003 and 2006–2007, and stabilized thereafter. In this update, we extended our results to include the next 7 years and noted a second significant rise in the bi-annual incidence of an FA between 2012–2013 and 2016–2017. The most common food allergen identified was egg in infancy, peanut in 1–4 years age group, and, overall, tree nut in the 5–18-year range. Seafood allergy was the most common in adults (≥19 years). Male sex was associated with a higher incidence of an FA. Our study had several unique strengths. Our study presented a population-based approach to accurately estimate the incidence and temporal trends of FA, including the ascertainment of FA cases within a well-defined geographic area, where the medical records for almost all the community members are available for review, which also serves to minimize referral bias, and the standardized criteria used to confirm the diagnosis, which minimizes the potential for misclassification. Many studies in FA have been vulnerable to reporting biases, caused by inconsistencies in design as well as more lenient diagnostic criteria.21–27 More recently, studies focused on an accurate diagnosis of FA in a well-defined population started appearing in recent years, but they are still limited by sampling biases.28,29,30
There has been a lingering question in practicing pediatrician and allergist's mind with the changing AAP recommendation:1,2 Does early introduction of allergenic food actually prevent FA? Analysis of our data suggested that this may be partly true and may contribute to the stabilization in the rising incidence of FA with changes in recommendation of the early introduction of allergenic food. In our cohort, 32 patients had an incident case of sesame allergy, with the highest number of diagnoses being in 2018. Analysis of our data, therefore, indicates that sesame allergy is a growing problem in the United States30,31 and highlighted the newer regulation with the addition of sesame to the eight “major food allergens” in the Food Allergen Labeling and Consumer Protection Act that mandates manufacturers to disclosure the use of sesame as a component in relevant foods, as opposed to the issuance of mere “encouragement” for disclosure.30,31 Sesame allergy is rising and may be a likely reflection of increased sesame consumption in the American societies. Our study had several limitations, one of which being the generalizability of our findings. Multiple REP18 studies have shown that, despite the racially constricted demographic distribution in Olmsted County, the data are generalizable to the whole U.S. population.19 Another limitation of our study was the lack of confirmatory testing through oral food challenge, which was a limitation in any retrospective chart review study.
CONCLUSION
Our population-based study over 17 years showed a higher incidence of FA in boys and a changing FA incidence over time, in part, a reflection of the changing AAP recommendations of early introduction of allergenic foods.
Footnotes
The authors have no conflicts of interest to declare pertaining to this article
This study used the resources of the Rochester Epidemiology Project (REP) medical records-linkage system, which is supported by the National Institute on Aging (NIA; AG 058738), by the Mayo Clinic Research Committee, and by fees paid annually by REP users. The content of this article is solely the responsibility of the authors and does not represent the official views of the National Institutes of Health (NIH) or the Mayo Clinic
REFERENCES
- 1. Sicherer SH, Sampson HA. Food allergy. J Allergy Clin Immunol. 2010; 125(suppl 2):S116–S125. [DOI] [PubMed] [Google Scholar]
- 2. Sampson HA. Update on food allergy. J Allergy Clin Immunol. 2004; 113:805–819. [DOI] [PubMed] [Google Scholar]
- 3. Gupta R, Holdford D, Bilaver L, et al. The economic impact of childhood food allergy in the United States. JAMA Pediatr. 2013; 167:1026–1031. [DOI] [PubMed] [Google Scholar]
- 4. Greenhawt M. Food allergy quality of life. Ann Allergy Asthma Immunol. 2014; 113:506–512. [DOI] [PubMed] [Google Scholar]
- 5. Boyce JA, Assa'ad A, Burks AW, et al. Guidelines for the Diagnosis and Management of Food Allergy in the United States: Summary of the NIAID-Sponsored Expert Panel Report. J Am Acad Dermatol. 2011; 64:175–192. [DOI] [PubMed] [Google Scholar]
- 6. Chafen JJS, Newberry SJ, Riedl MA, et al. Diagnosing and managing common food allergies: a systematic review. JAMA. 2010; 303:1848–1856. [DOI] [PubMed] [Google Scholar]
- 7. Sicherer SH, Muñoz-Furlong A, Godbold JH, et al. US prevalence of self-reported peanut, tree nut, and sesame allergy: 11-year follow-up. J Allergy Clin Immunol. 2010; 125:1322–1326. [DOI] [PubMed] [Google Scholar]
- 8. Asher MI, Montefort S, Björkstén B, et al. Worldwide time trends in the prevalence of symptoms of asthma, allergic rhinoconjunctivitis, and eczema in childhood: ISAAC phases one and three repeat multicountry cross-sectional surveys. Lancet. 2006; 368:733–743. [DOI] [PubMed] [Google Scholar]
- 9. Eder W, Ege MJ, von Mutius E. The asthma epidemic. N Engl J Med. 2006; 355:2226–2235. [DOI] [PubMed] [Google Scholar]
- 10. Nathan R, Meltzer E, Seiner J, et al. Prevalence of allergic rhinitis in the United States. J Allergy Clin Immunol. 1997; 99II (suppl):S808–S814. [PubMed] [Google Scholar]
- 11. Emanuel MB. Hay fever, a post industrial revolution epidemic: a history of its growth during the 19th century. Clin Exp Allergy. 1988; 18:295–304. [DOI] [PubMed] [Google Scholar]
- 12. Fleischer DM, Spergel JM, Assa'ad AH, et al. Primary prevention of allergic disease through nutritional interventions. J Allergy Clin Immunol Pract. 2013; 1:29–36. [DOI] [PubMed] [Google Scholar]
- 13. Du Toit G, Roberts G, Sayre PH, et al. Randomized trial of peanut consumption in infants at risk for peanut allergy. N Engl J Med. 2015; 372:803–813. [DOI] [PMC free article] [PubMed] [Google Scholar]
- 14. McGowan EC, Bloomberg GR, Gergen PJ, et al. Influence of early-life exposures on food sensitization and food allergy in an inner-city birth cohort. J Allergy Clin Immunol. 2015; 135:171–178. [DOI] [PMC free article] [PubMed] [Google Scholar]
- 15. Willits EK, Park MA, Hartz MF, et al. Food allergy: a comprehensive population-based cohort study. Mayo Clinic Proc. 2018; 93:1423–1430. [DOI] [PMC free article] [PubMed] [Google Scholar]
- 16. St. Sauver JL, Grossardt BR, Yawn BP, et al. Use of a medical records linkage system to enumerate a dynamic population over time: the Rochester Epidemiology Project. Am J Epidemiol. 2011; 173:1059–1068. [DOI] [PMC free article] [PubMed] [Google Scholar]
- 17. St Sauver JL, Grossardt BR, Leibson CL, et al. Generalizability of epidemiological findings and public health decisions: an illustration from the Rochester Epidemiology Project. Mayo Clinic Proc. 2012; 87:151–160. [DOI] [PMC free article] [PubMed] [Google Scholar]
- 18. Rocca WA, Yawn BP, St Sauver JL, et al. History of the Rochester Epidemiology Project: half a century of medical records linkage in a US population. Mayo Clinic Proc. 2012; 87:1202–1213. [DOI] [PMC free article] [PubMed] [Google Scholar]
- 19. St Sauver JL, Grossardt BR, Yawn BP, et al. Data resource profile: the Rochester epidemiology project (REP) medical records-linkage system. Int J Epidemiol. 2012; 41:1614–1624. [DOI] [PMC free article] [PubMed] [Google Scholar]
- 20. Mullins RJ. Paediatric food allergy trends in a community-based specialist allergy practice, 1995–2006. Med J Aust. 2007; 186:618–621. [DOI] [PubMed] [Google Scholar]
- 21. Sicherer SH, Muñoz-Furlong A, Sampson HA. Prevalence of peanut and tree nut allergy in the United States determined by means of a random digit dial telephone survey: a 5-year follow-up study. J Allergy Clin Immunol. 2003; 112:1203–1207. [DOI] [PubMed] [Google Scholar]
- 22. Verrill L, Bruns R, Luccioli S. Prevalence of self-reported food allergy in U.S. adults: 2001, 2006, and 2010. Allergy Asthma Proc. 2015; 36:458–467. [DOI] [PMC free article] [PubMed] [Google Scholar]
- 23. Branum AM, Lukacs SL. Food allergy among children in the United States. Pediatrics. 2009; 124:1549–1555. [DOI] [PubMed] [Google Scholar]
- 24. Gupta RS, Warren CM, Smith BM, et al. Prevalence and severity of food allergies among US adults. JAMA Netw Open. 2019; 2:e185630. [DOI] [PMC free article] [PubMed] [Google Scholar]
- 25. Allen KJ, Koplin JJ. The epidemiology of IgE-mediated food allergy and anaphylaxis. Immunol Allergy Clin North Am. 2012; 32:35–50. [DOI] [PubMed] [Google Scholar]
- 26. Osborne NJ, Koplin JJ, Martin PE, et al. Prevalence of challenge-proven IgE-mediated food allergy using population-based sampling and predetermined challenge criteria in infants. J Allergy Clin Immunol. 2011; 127:668–676.e1-e2. [DOI] [PubMed] [Google Scholar]
- 27. Grabenhenrich L, Trendelenburg V, Bellach J, et al. Frequency of food allergy in school-aged children in eight European countries—the EuroPrevall-iFAAM birth cohort. Allergy. 2020; 75:2294–2308. [DOI] [PubMed] [Google Scholar]
- 28. Grimshaw KEC, Bryant T, Oliver EM, et al. Incidence and risk factors for food hypersensitivity in UK infants: results from a birth cohort study. Clin Transl Allergy. 2016; 6:1. [DOI] [PMC free article] [PubMed] [Google Scholar]
- 29. Sokol K, Rasooly M, Dempsey C, et al. Prevalence and diagnosis of sesame allergy in children with IgE-mediated food allergy. Pediatr Allergy Immunol. 2020; 31:214–218. [DOI] [PMC free article] [PubMed] [Google Scholar]
- 30. Warren CM, Chadha AS, Sicherer SH, et al. Prevalence and severity of sesame allergy in the United States. JAMA Netw Open. 2019; 2:e199144. [DOI] [PMC free article] [PubMed] [Google Scholar]
- 31. FDA. FDA encourages manufacturers to clearly declare all uses of sesame in ingredient list on food labels. Available online at https://www.fda.gov/news-events/press-announcements/fda-encourages-manufacturers-clearly-declare-all-uses-sesame-ingredient-list-food-labels; accessed December 12, 2020.


