
Figure 6: Transcription factor WGCNA shows tTreg stimulated 1– 2 times express different ‘tTreg locking’ transcription factors than tTreg stimulated 3–5 times.
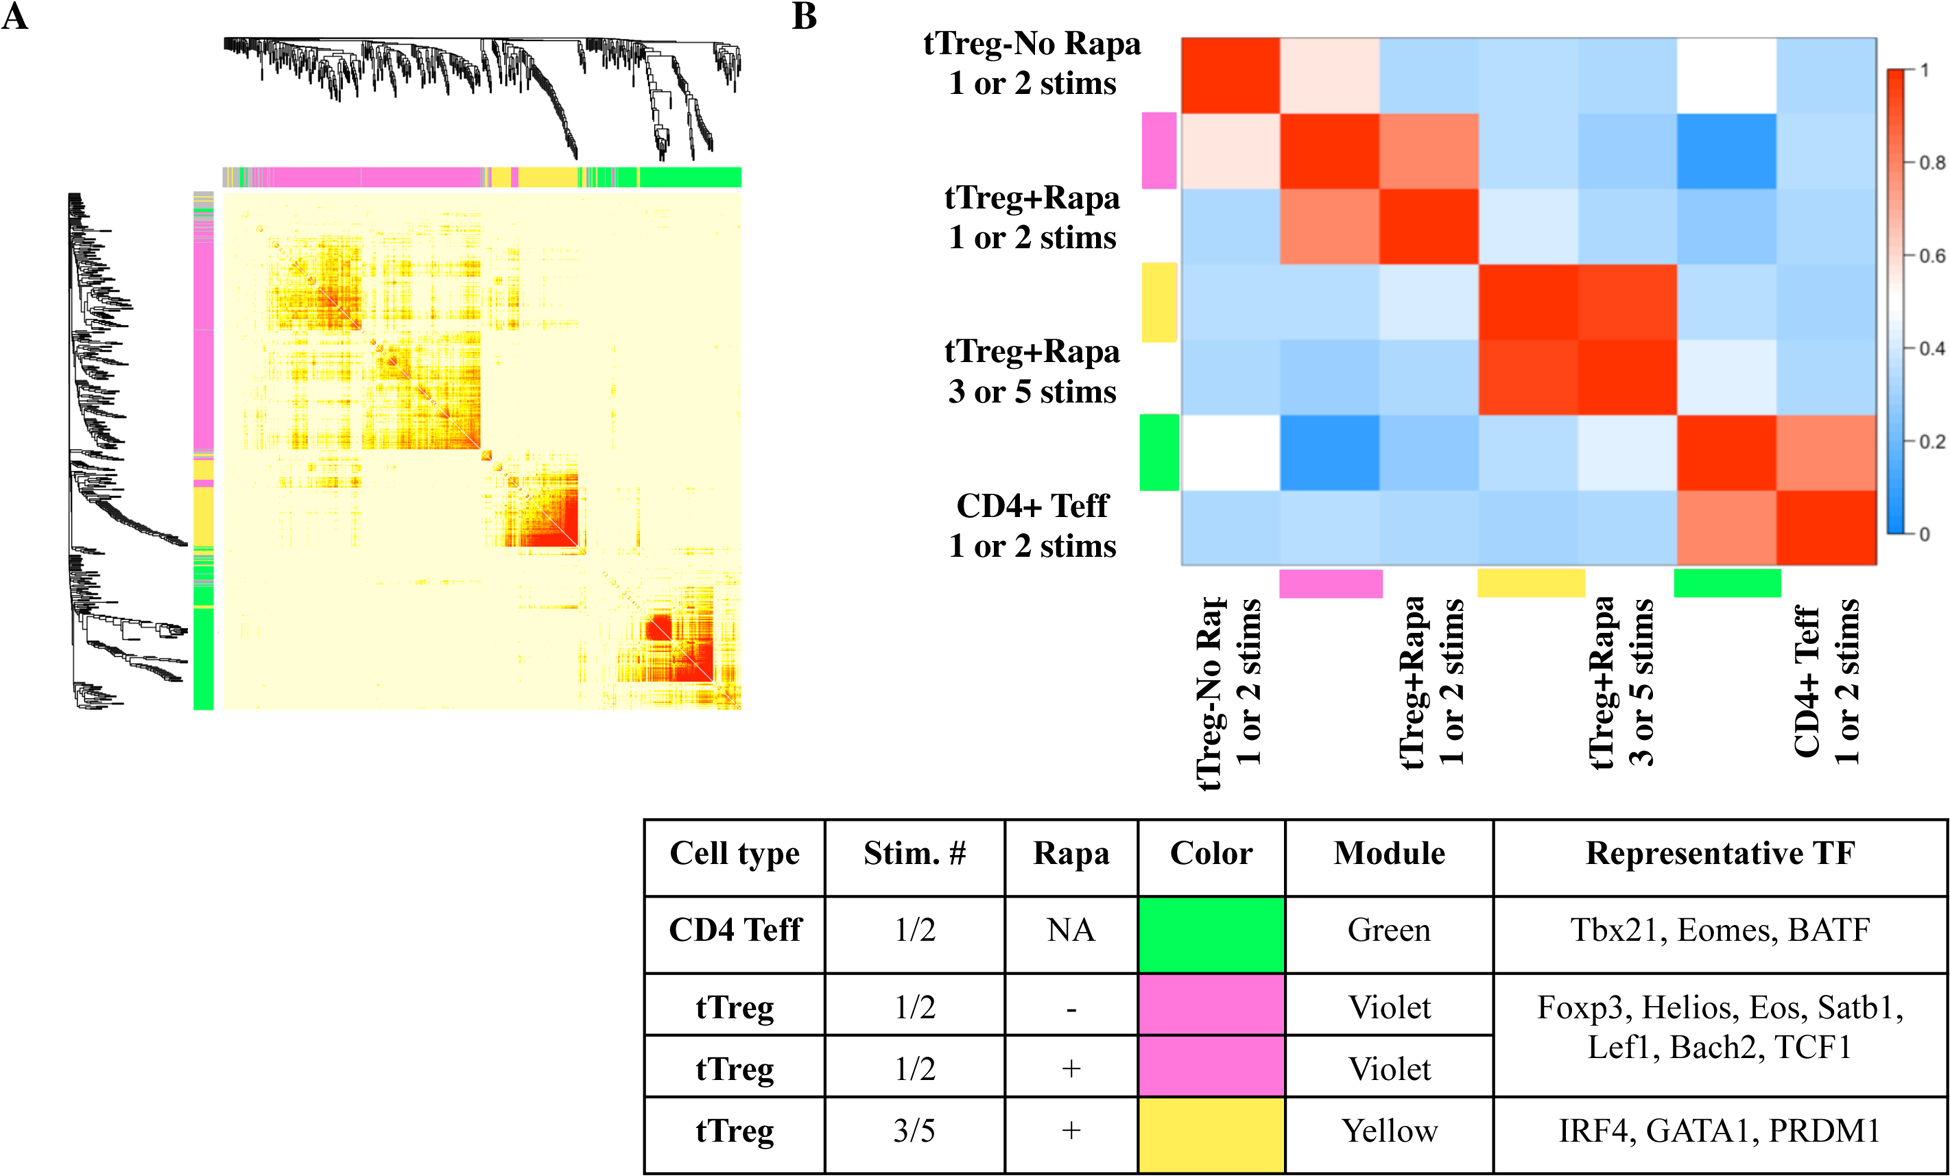
Naïve PB CD4+ T cells and tTreg were sort-purified (CD4+25– 127+45RA+ and CD4+25hi127−45RA+, respectively) and expanded with anti-CD3 mAb-loaded KT64/86 using up to 5 rounds of stimulation, and microarray profiling performed. (A) Topological overlap matrix plot with hierarchical clustering tree and the resulting gene modules from a weighted network of total CD4 Teff, tTreg-No Rapa and tTreg+Rapa transcripts. (B) Eigengene adjacency heatmap showing module eigengene similarity to CD4 Teff, tTreg-No Rapa and tTreg+Rapa.