

Abstract
Early diagnosis of urological diseases is often difficult due to the lack of specific biomarkers. More powerful and less invasive biomarkers that can be used simultaneously to identify urological diseases could improve patient outcomes. The aim of this study was to evaluate a urological disease‐specific scoring system established with a machine learning (ML) approach using Ig N‐glycan signatures. Immunoglobulin N‐glycan signatures were analyzed by capillary electrophoresis from 1312 serum subjects with hormone‐sensitive prostate cancer (n = 234), castration‐resistant prostate cancer (n = 94), renal cell carcinoma (n = 100), upper urinary tract urothelial cancer (n = 105), bladder cancer (n = 176), germ cell tumors (n = 73), benign prostatic hyperplasia (n = 95), urosepsis (n = 145), and urinary tract infection (n = 21) as well as healthy volunteers (n = 269). Immunoglobulin N‐glycan signature data were used in a supervised‐ML model to establish a scoring system that gave the probability of the presence of a urological disease. Diagnostic performance was evaluated using the area under the receiver operating characteristic curve (AUC). The supervised‐ML urologic disease‐specific scores clearly discriminated the urological diseases (AUC 0.78–1.00) and found a distinct N‐glycan pattern that contributed to detect each disease. Limitations included the retrospective and limited pathological information regarding urological diseases. The supervised‐ML urological disease‐specific scoring system based on Ig N‐glycan signatures showed excellent diagnostic ability for nine urological diseases using a one‐time serum collection and could be a promising approach for the diagnosis of urological diseases.
Keywords: biomarker, glycosylation, immunoglobulin, machine learning, urologic disease
Early diagnosis of urological diseases is often challenging. We established a supervised‐ML urological disease‐specific scoring system by obtaining serum Ig N‐glycan signature in a large series of patients from multiple Japanese hospitals. This could be a promising approach for the diagnosis of urological diseases.

Abbreviations
- ADT
androgen deprivation therapy
- AUC
area under the receiver operating characteristic curve
- BCa
bladder cancer
- BPH
benign prostatic hyperplasia
- CRPC
castration‐resistant prostate cancer
- GCT
germ cell tumor
- HSPC
hormone‐sensitive prostate cancer
- HV
healthy volunteer
- miRNA
microRNA
- NSGCT
nonseminoma GCT
- PC
prostate cancer
- PSA
prostate‐specific antigen
- RCC
renal cell carcinoma
- SGCT
seminoma GCT
- US
urosepsis
- UTI
urinary tract infection
- UTUC
upper urinary tract urothelial cancer
1. INTRODUCTION
Early detection of urological diseases is challenging due to the lack of highly specific biomarkers. Screening of HSPC often leads to overdiagnosis and overtreatment due to the low specificity of PSA. 1 Although early detection of RCC, BCa, and UTUC improves the prognosis, there are no specific biomarkers for discrimination of these diseases. 2 , 3 Human chorionic gonadotropin, α‐fetoprotein, and lactate dehydrogenase are useful for detecting and monitoring GCT; however, not all GCT cases are marker positive. 4 Urosepsis is the most common severe disease resulting from UTI and it requires accurate and timely diagnosis to evaluate severity. 5 , 6 Therefore, more powerful and less invasive biomarkers that can be used simultaneously are needed to identify urological diseases and improve patient outcomes.
Several techniques that use miRNAs and exosomes for early diagnosis of urological diseases have been reported. 7 , 8 , 9 , 10 N‐glycosylation is also a promising target for the detection. 2 , 4 , 11 , 12 , 13 , 14 Previously, we focused on aberrant N‐glycosylation of Ig, one of the major serum proteins, and found an aberrant N‐glycan signature of Ig using capillary electrophoresis‐based N‐glycomics, and suggested it might be useful for diagnosing BCa and UTUC. 3 , 15 Statistical analyses to extract disease‐specific N‐glycan signatures from vast amounts of N‐glycomics data on complex N‐glycan structures and their synthetic pathways are limited. Therefore, ML approaches could be an important tool for these analyses. 16 , 17 , 18 , 19 We aimed to simultaneously detect nine urological diseases including five cancers (RCC, BCa, UTUC, PC, and GCT) and three benign diseases (BPH, US, and UTI) using a diagnostic modeling ML approach with Ig N‐glycan signature data.
2. MATERIALS AND METHODS
2.1. Participants
Serum samples were obtained from patients with HSPC (n = 234), castration‐resistant PC (CRPC, n = 94), RCC (n = 100), BCa (n = 176), UTUC (n = 105), GCT (n = 73), UTI (n = 21), UTI with US (n = 145), or BPH (n = 95). These patients were treated at Kyoto University Hospital, Akita University Hospital, Tohoku University Hospital, Yamagata University Hospital, Miyagi Cancer Center Hospital, and Hirosaki University Hospital between June 2007 and July 2022. Thirty‐seven patients were excluded because the presence or absence of disease could not be determined from medical records. Urinary tract infection included cystitis or pyelonephritis without sepsis. Urinary tract infection with US was defined as the presence of UTI and systemic inflammatory response syndrome. 20 All BPH and HSPC patients were selected for prostate biopsy‐proven cases. For supervised‐ML model training purposes, each serum collection was treated separately, even if the patient had multiple serum collections. All serum samples were collected prior to treatment, except for some HSPC patients who underwent ADT and CRPC patients; serum samples from HSPC patients with ADT and CRPC patients were collected during treatment. All samples were stored at −80°C until use. Subjects from community‐dwelling populations involved in the Iwaki Health Promotion Project were also recruited as HVs (n = 269). 21 , 22
2.2. N‐glycomics of Ig
N‐glycomics of Ig was undertaken as described previously. 3 A flowchart is presented in Figure 1. Briefly, 100 μl serum was desalted with a Zeba Spin desalting resin plate (Thermo Fisher Scientific) and then 100 μl desalted serum was applied to a Melon Gel Spin resin plate (Thermo Fisher Scientific). After 5 min of incubation, the flow‐through was collected as the purified Ig fraction. Peptide N‐glycanase treatment and InstantQ fluorescent dye labeling of Ig N‐glycans and a cleanup process was undertaken with an Agilent AdvanceBio Gly‐X and InstantQ kit (Agilent Technologies). The InstantQ‐labeled Ig N‐glycan was then separated with the capillary electrophoresis light emitting diode‐induced fluorescence N‐glycan analysis system (Gly‐Q; Agilent Technologies). The electropherogram for each sample was automatically analyzed with Gly‐Q Manager (hIgG processing method) to define the structures of the N‐glycans (Figure S1).
FIGURE 1.
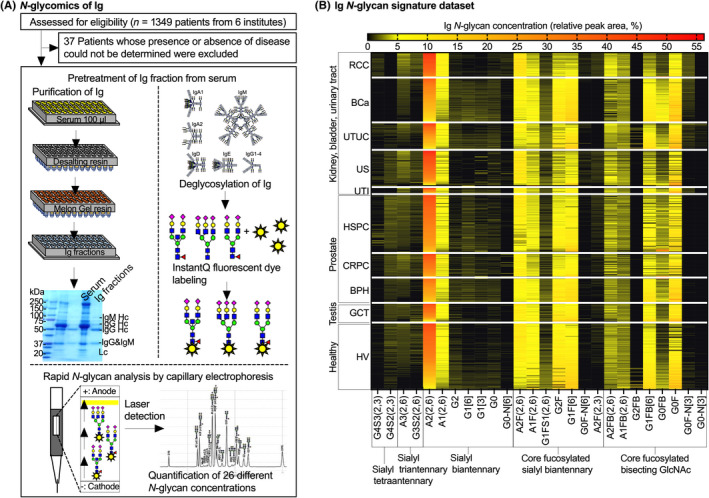
Schematic flow of N‐glycomics of Ig and relative peak area heatmap of 26 different Ig N‐glycans in each disease. (A) A total of 1312 serum samples were subjected to N‐glycomics of Ig. (B) N‐glycan signatures of Ig data. Relative peak area heatmap of 26 different Ig N‐glycans in each disease. Ig N‐glycan concentrations were clustered according to the distinct N‐glycan synthetic pathways and disease groups. BCa, bladder cancer; BPH, benign prostatic hyperplasia; CRPC, castration‐resistant prostate cancer; GCT, germ cell tumor; HSPC, hormone‐sensitive prostate cancer; HV, healthy volunteer; RCC, renal cell carcinoma; US, urosepsis; UTI, urinary tract infection; UTUC, upper urinary tract urothelial cancer
2.3. Supervised‐ML urological disease‐specific diagnostic modeling and statistical analysis
Model building was undertaken using DataRobot version 7.2 (DataRobot, Inc.). To create the urological disease‐specific diagnostic model, the target outcome of the supervised‐ML was set as disease classification data (HSPC, CRPC, RCC, BCa, UTUC, GCT, BPH, US, UTI, and HV). Prior to training, 20% of the Ig N‐glycan signature dataset (Figures 1 and 2) was randomly selected as a holdout dataset. The remaining 80% of the dataset was randomly divided into five mutually exclusive partitions, four of which were used as training and the last used for validation (Figure 3A). Each algorithm was evaluated four additional times by selecting a different partition as the validation data. 23 The AUC was used to evaluate the cross‐validation data (the average of each of the five possible validation partitions) and the TensorFlow Deep Learning Classifier algorithm with the highest AUC (0.9697) was selected as diagnostic model (Figure 3A). The prediction results outputted as the probability scores for the presence of the nine urological diseases. The diagnostic performance such as true and false positive/negative frequencies and AUC of the urological disease‐specific scoring system was validated with the holdout dataset and the whole dataset (Figure 3B) by GraphPad Prism version 9.3.1 (GraphPad Software). The Kruskal–Wallis test was used to analyze differences among multiple groups.
FIGURE 2.

N‐glycan signature of Ig. (A) Twenty‐six different Ig N‐glycans were aligned according to the N‐glycan synthetic pathway. N‐glycan structures are indicated by monosaccharide symbols: yellow circles, galactose (Gal); green circles, mannose (Man); blue squares, N‐acetylglucosamine (GlcNAc); red triangles, fucose (Fuc); and magenta diamonds, N‐acetylneuraminic acid (Neu5Ac). BCa, bladder cancer; BPH, benign prostatic hyperplasia; CRPC, castration‐resistant prostate cancer; GCT, germ cell tumor; HSPC, hormone‐sensitive prostate cancer; HV, healthy volunteer; RCC, renal cell carcinoma; US, urosepsis; UTI, urinary tract infection; UTUC, upper urinary tract urothelial cancer
FIGURE 3.

Supervised machine learning (ML) diagnostic modeling and evaluation of urological disease‐specific score. (A) ML‐supervised diagnostic modeling by DataRobot. Eighty percent of the dataset (n = 1049) was divided into five mutually exclusive partitions, four of which were used as training and the last used for validation used for modeling of urological disease‐specific scores with the TensorFlow Deep Learning Classifier algorithm. (B) Validation of urological disease‐specific scores by true negative/positive frequencies and receiver operating characteristic curve (ROC) analysis using holdout dataset (20% of whole data, n = 262) and ROC analysis of urological disease‐specific scores using the whole dataset (n = 1312). AUC, area under the ROC curve
3. RESULTS
3.1. Immunoglobulin N‐glycan signature of each disease
The characteristics of the participants are summarized in Table 1. Figures 1 and 2 show the concentrations of 26 different Ig N‐glycans aligned according to the N‐glycan synthesis pathway for each disease group (Ig N‐glycan signature) and this dataset was used in DataRobot to create the urological disease‐specific diagnostic scoring system (Figure 3).
TABLE 1.
Characteristics of patients for analysis of Ig N‐glycan signatures
| Total | HSPC | CRPC | RCC | BCa | UTUC | GCT | BPH | US | UTI | HV | p Value |
|---|---|---|---|---|---|---|---|---|---|---|---|
| n = 1312 | 234 | 94 | 100 | 176 | 105 | 73 | 95 | 145 | 21 | 269 | – |
|
Age, years (IQR) |
74 (67,78) | 74 (64,78) | 67 (59,77) | 70 (62,75) | 72 (63,76) | 38 (25,45) | 67 (61,71) | 79 (69,87) | 76 (63,90) | 29 (23,65) | * |
|
Gender n, m/f |
234/0 | 94/0 | 64/36 | 147/29 | 69/36 | 73/0 | 95/0 | 60/85 | 12/9 | 173/96 | * |
|
Urine cytology Class<IV/≥IV /NA |
– | – | – | 100/64/12 | 46/44 /12 | – | – | – | – | – | – |
|
tPSA, ng/ml (median, IQR) |
1.00 (0.04–6.21) | – | – | – | – | – | 5.8 (4.74–7.18) | – | – | – | * |
| wADT/woADT, n | 107/127 | – | – | – | – | – | – | – | – | – | – |
|
SGCT /NSGCT, n |
– | – | – | – | – | 36/37 | – | – | – | – | – |
| Pathological T stage, n (%) | |||||||||||
| Ta,Tis | – | – | 0 (0) | 0 (0) | 6 (6) | – | – | – | – | – | – |
| T1 | – | – | 66 (66) | 108(61) | 21 (20) | – | – | – | – | – | – |
| T2 | – | – | 10 (10) | 27 (15) | 14 (13) | – | – | – | – | – | – |
| T3 | – | – | 17 (17) | 30 (17) | 44 (42) | – | – | – | – | – | – |
| T4 | – | – | 3 (3) | 11 (6) | 3 (3) | – | – | – | – | – | – |
| NA | – | – | 4 (4) | 0 (0) | 16 (15) | – | – | – | – | – | – |
Abbreviations: BCa, bladder cancer; BPH, benign prostatic hyperplasia; CRPC, castration resistant prostate cancer; f, female GCT, germ cell tumor; HSPC, hormone sensitive prostate cancer; HV, healthy volunteer; IQR, interquartile range; m, male/; NA, not available; NSGCT, nonseminoma GCT; RCC, renal cell carcinoma; SGCT, seminoma GCT; tPSA, total prostate‐specific antigen; US, urinary tract infection with sepsis; UTI, urinary tract infection; UTUC, upper urinary tract urothelial cancer; wADT, HSPC with androgen deprivation therapy; woADT, HSPC without androgen deprivation therapy.
p < 0.0001.
3.2. True and false positive/negative frequencies of scores validated in the holdout dataset
True and false positive/negative frequencies of supervised‐ML disease‐specific scores validated in the holdout dataset are shown as a confusion matrix in Figure 4. The scores for RCC detection, BCa detection, and US with UTI detection had significantly higher true positive/negative frequencies (95.0%, 95.5%, and 100%, respectively) in the holdout dataset. Figure 5 shows the impact of specific N‐glycans for the detection of each disease‐specific score. The ML approach suggested that A2F(2,3) mainly contributed to the specific detection of RCC. G2FB mainly contributed to the specific detection of US with UTI. A combination of G4S2(2,3) and G0FB mainly contributed to the specific detection of BCa.
FIGURE 4.

True and false positive/negative frequency in confusion matrix of supervised machine learning urological disease‐specific score evaluated in holdout dataset. The left column shows each disease‐specific scoring system and the upper row shows the predicted results. True positive/negative and false positive/positive rates for cases determined to have each disease using each disease‐specific scoring system are shown. The size of the green circle represents the true positive/negative frequency. The size of the magenta circle represents the false positive/negative frequency. BCa, bladder cancer; BPH, benign prostatic hyperplasia; CRPC, castration‐resistant prostate cancer; GCT, germ cell tumor; HSPC, hormone‐sensitive prostate cancer; HV, healthy volunteer; RCC, renal cell carcinoma; US, urosepsis; UTI, urinary tract infection; UTUC, upper urinary tract urothelial cancer
Figure 5.

Impact of specific N‐glycans for detection of each disease by urological disease‐specific score. The upper graphs represent the impact of N‐glycan structures for the detection of each disease. Relative impact >0.5 is represented as a red bar. A dotted square in the lower Ig N‐glycan synthetic pathway shows the N‐glycan structure with relative impact >0.5 for each disease. N‐glycan structures are indicated by monosaccharide symbols: yellow circles, galactose (Gal); green circles, mannose (Man); blue squares, N‐acetylglucosamine (GlcNAc); red triangles, fucose (Fuc); and magenta diamonds, N‐acetylneuraminic acid (Neu5Ac). BCa, bladder cancer; BPH, benign prostatic hyperplasia; CRPC, castration‐resistant prostate cancer; GCT, germ cell tumor; HSPC, hormone‐sensitive prostate cancer; HV, healthy volunteer; RCC, renal cell carcinoma; US, urosepsis; UTI, urinary tract infection; UTUC, upper urinary tract urothelial cancer
Healthy volunteer scores had a higher true positive/negative frequency (75.4%), and 11.5% or 9.8% of the HV cases were predicted as UTUC or GCT, respectively. G1[6] and G0FB had a high impact on HV detection.
Although the disease‐specific scores for HSPC detection, CRPC detection, and BPH detection had higher true positive/negative frequencies (77.1%, 66.7%, and 61.1%, respectively) and could be used to discriminate between PC and non‐PC diseases, 6.2% or 10.4% of HSPC cases were predicted as CRPC or BPH, 27.8% of CRPC cases were predicted as HSPC, and 22.2% of BPH cases were predicted as HSPC. The combination of G4S2(2,3), G1[6], and G0FB were important for HSPC detection, and a combination of A1FB, G1FB, G1[6], and G0FB were important for BPH detection. N‐glycans [A3(2,6), A2(2,6), and A1(2,6)] contributed to CRPC detection.
Disease‐specific scores for UTUC detection, GCT detection, and UTI detection had lower true positive/negative frequencies (38.5%, 57.1%, and 40.0%, respectively). A total of 46.2% of UTUC cases were predicted as HV. A total of 14.3% or 21.4% of GCT cases were predicted as HSPC or HV. Sixty percent of UTI cases were predicted as BCa. The number of high‐impact N‐glycans required for the detection of UTUC, GCT, or UTI was 10, 5, and 6 types, respectively. Among the N‐glycans that were required for the detection of UTUC and GCT, G1[6] and G0FB were also important N‐glycans for the detection of HV and HSPC. Among the N‐glycans required for detection of UTI, G4S2(2,3) was also an important N‐glycan for the detection of BCa.
3.3. Diagnostic accuracy of scores for the detection of each disease in the whole dataset
The diagnostic accuracy of scores for the detection of each disease in the whole dataset is shown in Figure 6 and Table S1. The AUC and specificity at 90% sensitivity of the RCC score versus each disease had a higher value (0.99, 99%, respectively) and could also detect RCC at any pathological stage (pT) (Figure 7). The AUC and specificity at 90% sensitivity of the BCa score versus each disease, except for UTI, had a higher value (0.99% and 98%, respectively) and UTI had a slightly lower value (0.88% and 64.8%, respectively). The BCa score could also indicate BCa at any pT of BCa or at any urine cytology status (Figure 7). The AUC and specificity at 90% sensitivity of UTUC scores versus each disease, except for HV, were greater than 0.93% and 77.1%, respectively, and HV had slightly lower values (0.88% and 58.1%, respectively). The UTUC score also indicated UTUC at any pT or at any urine cytology status (Figure 7).
FIGURE 6.
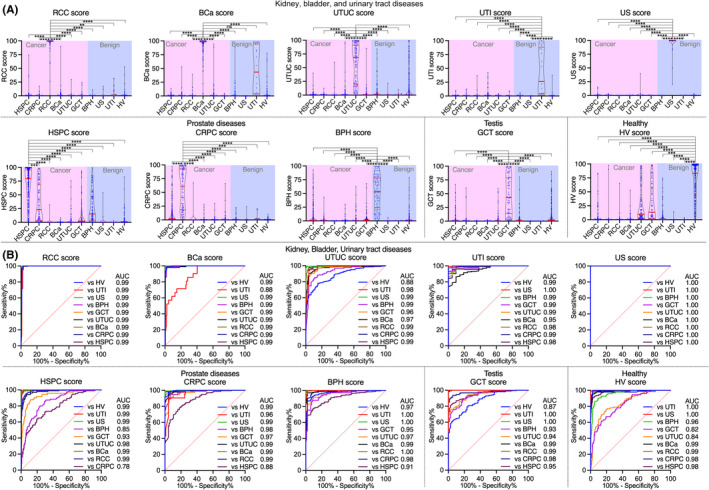
Diagnostic accuracy of supervised machine learning urological disease‐specific score for detection of each disease in whole data. (A) Violin plot of urological disease‐specific scores for detecting each disease in the whole dataset. The red line in the violin plots indicates the interquartile range (IQR) and median value. *p < 0.05, **p < 0.005, ***p < 0.001, ****p < 0.0001. ns, not significant. (B) Receiver operating characteristic (ROC) analysis of urological disease‐specific scores for detecting each disease. AUC, area under the ROC curve; BCa, bladder cancer; BPH, benign prostatic hyperplasia; CRPC, castration‐resistant prostate cancer; GCT, germ cell tumor; HSPC, hormone‐sensitive prostate cancer; HV, healthy volunteer; RCC, renal cell carcinoma; US, urosepsis; UTI, urinary tract infection; UTUC, upper urinary tract urothelial cancer
FIGURE 7.

Each urological disease‐specific score classified as clinical or pathological parameter in the whole dataset. (A) Violin plot and receiver operating characteristic (ROC) analysis of renal cell carcinoma (RCC) score classified as a pathological stage in whole dataset. (B, C) Violin plots and ROC analyses of bladder cancer (BCa) score and upper urinary tract urothelial cancer (UTUC) score classified as a pathological stage or urine cytology class <IV/≥IV in whole dataset. (D) Violin plot, scatter plot, and ROC analysis of total prostate‐specific antigen (PSA) and hormone‐sensitive prostate cancer (HSPC) score between benign prostatic hyperplasia (BPH) and HSPC groups in the whole dataset. (E) Violin plot and ROC analysis of germ cell tumor (GCT) score classified as seminoma (SGCT) and nonseminoma (NSGCT) in the whole dataset. AUC, area under the ROC curve; NA, not available; ns, not significant
The AUC and specificity at 90% sensitivity of the HSPC score versus each disease, except for prostate diseases, were greater than 0.93% and 83.3%, respectively, and had a slightly lower value versus BPH (0.85% and 55.1%, respectively) and versus CRPC (0.78% and 39.3%, respectively). The AUC and specificity at 90% sensitivity of the CRPC score versus each disease, except for HSPC, were greater than 0.97% and 92.6%, respectively, and there was a slightly lower value versus HSPC (0.88% and 61.7%, respectively). The AUC of HSPC score (0.85) also superior to that of total PSA (0.73), and there was no strong correlation between total PSA and HSPC score (Figure 7).
The AUC and specificity at 90% sensitivity of the GCT score versus each disease, except for HV, were greater than 0.93% and 78.1%, respectively, and there was a slightly lower value versus HV (0.87% and 57.5%, respectively). The GCT score also could detect both seminoma (SGCT) and nonseminoma (NSGCT) (Figure 7).
The AUC and specificity at 90% sensitivity of the BPH score versus each disease, except for HSPC, were greater than 0.95% and 84.2%, respectively, and there was a slightly lower value versus HSPC (0.91% and 68.4%, respectively). The AUC and specificity at 90% sensitivity of the US score versus each disease were significantly higher (1.00% and 100%, respectively). The AUC and specificity at 90% sensitivity of the UTI score versus each disease, except for BCa, were greater than 0.98% and 95.2%, respectively, and there was a slightly lower value versus BCa (0.95% and 81.0%, respectively). The AUC and specificity at 90% sensitivity of the HV score versus each disease, except for GCT and UTUC, were greater than 0.96% and 90.0%, respectively, and there was a slightly lower value versus GCT (0.82% and 48.7%, respectively) and versus UTUC (0.84% and 52.4%, respectively).
3.4. Diagnostic accuracy of scores for the detection of each disease in the holdout dataset
The diagnostic accuracy of scores for the detection of each disease in the whole dataset is shown in Figure S2 and Table S2. The AUC and specificity at 90% sensitivity of the RCC score versus each disease had a higher value (1.00, 100%, respectively). The AUC and specificity at 90% sensitivity of the BCa score versus each disease, except for UTI, had a higher value (0.99% and 98%, respectively) and UTI had a slightly lower value (0.90% and 77.0%, respectively). The AUC and specificity at 90% sensitivity of UTUC scores versus each disease, except for HV, were greater than 0.90% and 61.5%, respectively, and HV had slightly lower values (0.86% and 38.5%, respectively).
The AUC and specificity at 90% sensitivity of the HSPC score versus each disease, except for prostate diseases, were greater than 0.92% and 72.9%, respectively, and had a slightly lower value versus BPH (0.87% and 68.7%, respectively) and versus CRPC (0.84% and 50.0%, respectively). The AUC and specificity at 90% sensitivity of the CRPC score versus each disease, except for HSPC, were greater than 0.96% and 72.2%, respectively, and there was a slightly lower value versus HSPC (0.93% and 72.2%, respectively).
The AUC and specificity at 90% sensitivity of the GCT score versus each disease, except for HV, were greater than 0.94% and 85.7%, respectively, and there was a slightly lower value versus HV (0.84% and 51.0%, respectively). The AUC and specificity at 90% sensitivity of the BPH score versus each disease, except for HSPC, were greater than 0.98% and 94%, respectively, and there was a slightly lower value versus HSPC (0.92% and 61.1%, respectively). The AUC and specificity at 90% sensitivity of the US score versus each disease were significantly higher (1.00% and 100%, respectively). The AUC and specificity at 90% sensitivity of the UTI score versus each disease were greater than 0.97% and 100%, respectively. The AUC and specificity at 90% sensitivity of the HV score versus each disease, except for GCT and UTUC, were greater than 0.96% and 86.7%, respectively, and there was a slightly lower value versus GCT (0.84% and 54.1%, respectively) and versus UTUC (0.77% and 42.6%, respectively).
4. DISCUSSION
Early detection of urological diseases is challenging due to the scarcity of highly specific biomarkers. Biomarkers that can precisely detect multiple urological diseases simultaneously in a single measurement would be of great benefit. Although several promising biomarkers have been reported for early detection of urological diseases using miRNAs and exosomes. 7 , 8 , 9 , 10 there is only one report on diagnostic Ig N‐glycan signatures of urological diseases. 3 Glycomics is a new subspecialty in omics science and holds great promise as a next‐generation biomarker for precision medicine. Although several researchers have reported aberrantly sialylated, agalactosylated, and fucosylated N‐glycans on Ig due to disease‐associated immunoreactions, 24 , 25 , 26 , 27 , 28 , 29 , 30 there have been no studies that have examined changes in the entire N‐glycan synthesis pathway for Ig. Previously, we showed that discriminant analysis based diagnostic scoring systems using Ig N‐glycan signatures for detection of BCa and UTUC were superior to urine cytology. 3 , 15 This suggests that a comprehensive analysis of the N‐glycan synthesis pathway of Ig might be promising and disease‐specific. Several N‐glycan signatures, such as sialylation, fucosylation, bisecting GlcNAcylation, and branching, are regulated by various glycosyltransferase activities, and their synthetic pathways could influence each other. Although discriminating three or more diseases by discriminant analysis using N‐glycan signatures has been limited, an ML approach combined with omics data has been used for early detection of diseases, including cancer 16 , 17 , 18 , 19 and seems to be suitable for extraction of disease‐specific N‐glycan features and precise discrimination between benign and malignant conditions.
Here, we showed excellent diagnostic performance of the supervised‐ML disease‐specific scoring system (Figures 4, 6, 7, and S2) in both holdout and whole datasets, and distinct N‐glycan patterns were found that contributed to detection of each disease (Figure 5). Although an imaging technique for RCC detection is widely used, it was difficult to detect until the tumor grows to a detectable size, and 30% of cases are metastatic RCC at diagnosis. 2 , 31 We found that a α2,3 sialyl biantennary core fucosyl N‐glycan [A2F(2,3)] on Ig contributes significantly to the specific detection of RCC, and the RCC score could even identify a small RCC, such as pT1a (Figure 7), as well as discriminate between RCC and UTUC. Thus, RCC score will be a highly promising biomarker for early diagnosis of RCC and for differentiation between invasive renal pelvis cancer and RCC in the future.
A combination of α2,3 sialyl tetraantennary N‐glycan [G4S2(2,3)] and agalactosyl bisecting GlcNAc core fucosyl N‐glycan (G0FB) allowed specific detection of BCa. G4S2(2,3) also had a significant impact on UTI detection, leading to false positive/negative results for BCa detection, suggesting the need to combine urine culture test results and other factors to discriminate between BCa and UTI. In addition, two N‐glycans, that is, monogalactosyl biantennary N‐glycan (G1[6]) and agalactosyl bisecting GlcNAc core fucosyl N‐glycan (G0FB), had a high impact on the detection of UTUC. They also had a high impact on the detection of HV and GCT, leading to false positive/negative results for UTUC detection. Imaging or urine cytology for BCa and UTUC detection was useful for detection of these diseases, but patients often have invasive disease at diagnosis due to a lack of specific biomarkers for early detection. 3 The BCa and UTUC scores showed distinct N‐glycan patterns that contributed to detection of BCa and UTUC, and both scores showed excellent diagnostic accuracy at any pathological stage or at any urine cytology status of both urothelial cancers (Figure 7). Thus, BCa and UTUC scores will be promising biomarkers for early detection and also discriminate between BCa and UTUC, suggesting that there is a benefit to selection of disease‐specific treatment.
The same two N‐glycans that were useful for HV, UTUC, and GCT detection, that is, G1[6] and G0FB, were also useful for the detection of HSPC or BPH. However, a combination of G4S2(2,3), G1[6], and G0FB was important for HSPC detection, and a combination of A1FB, G1FB, G1[6], and G0FB was important for BPH detection. These results suggested that G1[6] and G0FB were highly important for the detection of several diseases (HV, UTUC, GCT, HSPC, and BPH), and that more combinations of N‐glycans in addition to G1[6] and G0FB are needed to differentiate these diseases. Meanwhile, sialyl triantennary and biantennary N‐glycan [A3(2,6), A2(2,6), and A1(2,6)] pathways strongly contributed to the detection of CRPC, suggesting that this sialyl branching N‐glycan pathway might be specific for the detection of castration resistance. Further basic study on the relevance between sialyl branching N‐glycan on Ig and the acquisition of castration resistance should clarify the mechanism. Although PSA is a well‐known gold standard biomarker in PC diagnosis and monitoring of disease progression, it often leads to overdiagnosis and overtreatment. 1 , 14 Although further follow‐up studies are needed, the disease‐specific score developed in this study was shown to identify not only HSPC, BPH, and HV, but also CRPC with high accuracy; in particular, the HSPC score was much superior to the total PSA test, suggesting its potential as a biomarker to reduce overdiagnosis in PC in the future.
For discrimination between mild UTI and severe urosepsis with UTI, the impact of the N‐glycan pattern was completely different, suggesting that severe sepsis caused by UTI can be clearly distinguished from mild UTI. In US with UTI‐specific detection, galactosyl bisecting GlcNAc core fucosyl N‐glycan (G2FB) on Ig was found to be the main contributor. Although procalcitonin and the platelet count are useful for evaluating the severity of US, more precise diagnostic biomarkers are required for evaluation of the severity of disease. 5 , 6 The US score could be a promising biomarker of severe US detection.
Furthermore, although the GCT score showed slightly false positive results versus HV, the GCT score showed excellent diagnostic accuracy versus non‐GCT diseases and would be a promising biomarker for early detection of GCT. The GCT score could also detect both SGCT and NSGCT, suggesting that the GCT score will be a promising biomarker for marker‐negative NSGCT (Figure 7).
These results suggested that the N‐glycan signature reflects the systemic immune status, and that urological diseases associated with inflammation, such as US associated with UTI, RCC, and BCa, are easily discriminated because of the significant changes in the N‐glycan signature, while urological diseases with low or mild inflammation are difficult to discriminate according to the N‐glycan signature. Menni et al reported N‐glycan profiling of IgG involved in the humoral immune response to identify the risk of cardiovascular disease. 32 Distinct N‐glycosylation profiles have been linked to diverse effector functions of IgG. 30 , 33 , 34 Although we investigated the mixture of Ig (including IgG, IgM, and IgA), the overall results of this study hypothesized that Ig N‐glycosylation traits could identify disease risk by reflecting varying states of systemic inflammation and immune activation. Further basic studies on whether the N‐glycan signature is altered by disease onset should clarify the mechanism.
The limitations of this study were the retrospective nature, limited pathological information, and changes over time with the treatment course not considered, which could lead to selection bias.
The findings presented herein could enable the detection of nine urological diseases using a one‐time serum collection. Further external validation trials are needed to validate the urological disease‐specific scoring system in routine clinical practice.
AUTHOR CONTRIBUTIONS
Study concept and design: H. Iwamura, T. Yoneyama, C. Ohyama. Acquisition of data: H. Iwamura, K. Mizuno, S. Akamatsu, S. Hatakeyama, S. Narita, T. Narita, S. Yamashita, S. Kawamura, T. Sakurai, N. Fujita, H. Kodama, D. Noro, I. Kakizaki, S. Nakaji, K. Itoh, N. Tsuchiya, A. Ito, T. Habuchi, C. Ohyama, T. Yoneyama. Analysis and interpretation of data: H. Iwamura, T. Yoneyama. Drafting of the manuscript: H. Iwamura, K. Mizuno, S. Akamatsu, S. Hatakeyama, S. Narita, T. Narita, S. Yamashita, S. Kawamura, T. Sakurai, N. Fujita, H. Kodama, D. Noro, I. Kakizaki, S. Nakaji, K. Itoh, N. Tsuchiya, A. Ito, T. Habuchi, C. Ohyama, T. Yoneyama. Critical revision of the manuscript for important intellectual content: T. Yoneyama, H. Iwamura, C. Ohyama. Statistical analysis: T. Yoneyama, H. Iwamura. Obtaining funding: H. Iwamura, K. Mizuno, S. Nakaji, C. Ohyama. Administrative, technical, or material support: K. Mizuno, S. Akamatsu, S. Htakeyama, S. Narita, T. Narita, S. Yamashita, S. Kawamura, T. Sakurai, N. Fujita, H. Kodama, D. Noro, S. Nakaji, N. Tsuchiya, A. Ito, T. Habuchi, T. Yoneyama. Supervision: C. Ohyama, T. Yoneyama.
DISCLOSURE
The authors declare no conflict of interest.
ETHICAL STATEMENT
This study was approved by the ethics committee of each institute and the ethics committee of Hirosaki University Graduate School of Medicine (“Study of carbohydrate structure change in urological disease”; approval number: 2019–099, approval date: March 13, 2020 https://www.med.hirosaki‐u.ac.jp/hospital/outline/resarch/resarch.html). Written informed consent was obtained from all patients.
Supporting information
Figure S1
Figure S2
Table S1
Table S2
ACKNOWLEDGMENTS
All authors thank Yukie Nishizawa, Mitsuharu Miyadate, and Satomi Sakamoto, technical assistants of Hirosaki University Graduate School of Medicine, for their invaluable help with sample collection and data management. This study was supported by the Japan Society for the Promotion of Science (JSPS) KAKENHI (grant nos. 20K18130 and 20K18083) and by the Japan Science and Technology Agency (JST) Center of Innovation (COI) program (grant no. JPMJCE1302) and COI program for young scientist collaborative research fund project (grant no. R03W14).
Iwamura H, Mizuno K, Akamatsu S, et al. Machine learning diagnosis by immunoglobulin N‐glycan signatures for precision diagnosis of urological diseases. Cancer Sci. 2022;113:2434‐2445. doi: 10.1111/cas.15395
Funding information
Japan Society for the Promotion of Science KAKENHI, Grant/Award Number: 20K18130, 20K18083; Japan Science and Technology Agency Center of Innovation program, Grant/Award Number: JPMJCE1302, R03W14
DATA AVAILABILITY STATEMENT
All data needed to evaluate the conclusions in the paper are present in the paper and/or the Supplementary Materials. Additional data related to this paper may be requested from the authors.
REFERENCES
- 1. Yoneyama T, Yamamoto H, Sutoh Yoneyama M, et al. Characteristics of alpha2,3‐sialyl N‐glycosylated PSA as a biomarker for clinically significant prostate cancer in men with elevated PSA level. Prostate. 2021;81:1411‐1427. [DOI] [PMC free article] [PubMed] [Google Scholar]
- 2. Hatakeyama S, Amano M, Tobisawa Y, et al. Serum N‐glycan alteration associated with renal cell carcinoma detected by high throughput glycan analysis. J Urol. 2014;191:805‐813. [DOI] [PubMed] [Google Scholar]
- 3. Kodama H, Yoneyama T, Tanaka T, et al. N‐glycan signature of serum immunoglobulins as a diagnostic biomarker of urothelial carcinomas. Cancer Med. 2021;10:1297‐1313. [DOI] [PMC free article] [PubMed] [Google Scholar]
- 4. Narita T, Hatakeyama S, Yoneyama T, et al. Clinical implications of serum N‐glycan profiling as a diagnostic and prognostic biomarker in germ‐cell tumors. Cancer Med. 2017;6:739‐748. [DOI] [PMC free article] [PubMed] [Google Scholar]
- 5. Jiang L, Lin SH, Wang J, Chu CK. Prognostic values of procalcitonin and platelet in the patient with urosepsis. Medicine (Baltimore). 2021;100:e26555. [DOI] [PMC free article] [PubMed] [Google Scholar]
- 6. Zhang X, Zhan X, Huang B, Li S, Xu Y. The early diagnostic efficacy of serum histone H3 in rabbit urosepsis model. Biomed Res Int. 2021;2021:9969344‐9969317. [DOI] [PMC free article] [PubMed] [Google Scholar] [Retracted]
- 7. Matsuzaki J, Ochiya T. Circulating microRNAs: next‐generation cancer detection. Keio J Med. 2020;69:88‐96. [DOI] [PubMed] [Google Scholar]
- 8. Urabe F, Matsuzaki J, Yamamoto Y, et al. Large‐scale circulating microRNA profiling for the liquid biopsy of prostate cancer. Clin Cancer Res. 2019;25:3016‐3025. [DOI] [PubMed] [Google Scholar]
- 9. Usuba W, Urabe F, Yamamoto Y, et al. Circulating miRNA panels for specific and early detection in bladder cancer. Cancer Sci. 2019;110:408‐419. [DOI] [PMC free article] [PubMed] [Google Scholar]
- 10. Ramirez‐Garrastacho M, Bajo‐Santos C, Line A, et al. Extracellular vesicles as a source of prostate cancer biomarkers in liquid biopsies: a decade of research. Br J Cancer. 2021;126:331‐350. [DOI] [PMC free article] [PubMed] [Google Scholar]
- 11. Maho Amano MT. N‐ and O‐glycome analysis of serum and urine from bladder cancer patients using a high‐throughput glycoblotting method. J Glycomics Lipidomics. 2013;03:1‐8. [Google Scholar]
- 12. Nouso K, Amano M, Ito YM, et al. Clinical utility of high‐throughput glycome analysis in patients with pancreatic cancer. J Gastroenterol. 2013;48:1171‐1179. [DOI] [PubMed] [Google Scholar]
- 13. Ishikawa T, Yoneyama T, Tobisawa Y, et al. An automated micro‐total immunoassay system for measuring cancer‐associated α2,3‐linked Sialyl N‐glycan‐carrying prostate‐specific antigen may improve the accuracy of prostate cancer diagnosis. Int J Mol Sci. 2017;18:470. [DOI] [PMC free article] [PubMed] [Google Scholar]
- 14. Matsumoto T, Hatakeyama S, Yoneyama T, et al. Serum N‐glycan profiling is a potential biomarker for castration‐resistant prostate cancer. Sci Rep. 2019;9:16761. [DOI] [PMC free article] [PubMed] [Google Scholar]
- 15. Tanaka T, Yoneyama T, Noro D, et al. Aberrant N‐glycosylation profile of serum immunoglobulins is a diagnostic biomarker of urothelial carcinomas. Int J Mol Sci. 2017;18:2632. [DOI] [PMC free article] [PubMed] [Google Scholar]
- 16. Alafeef M, Srivastava I, Pan D. Machine learning for precision breast cancer diagnosis and prediction of the nanoparticle cellular internalization. ACS Sens. 2020;5:1689‐1698. [DOI] [PubMed] [Google Scholar]
- 17. Huber M, Kepesidis KV, Voronina L, et al. Infrared molecular fingerprinting of blood‐based liquid biopsies for the detection of cancer. eLife. 2021;10:e68758. [DOI] [PMC free article] [PubMed] [Google Scholar]
- 18. Chen S, Jiang L, Zheng X, et al. Clinical use of machine learning‐based pathomics signature for diagnosis and survival prediction of bladder cancer. Cancer Sci. 2021;112:2905‐2914. [DOI] [PMC free article] [PubMed] [Google Scholar]
- 19. Nguyen TM, Kim N, Kim DH, et al. Deep learning for human disease detection, subtype classification, and treatment response prediction using epigenomic data. Biomedicine. 2021;9:1733. [DOI] [PMC free article] [PubMed] [Google Scholar]
- 20. Bone RC, Balk RA, Cerra FB, et al. Definitions for sepsis and organ failure and guidelines for the use of innovative therapies in sepsis. The ACCP/SCCM Consensus Conference Committee. American College of Chest Physicians/Society of Critical Care Medicine. Chest. 1992;101:1644‐1655. [DOI] [PubMed] [Google Scholar]
- 21. Oikawa M, Hatakeyama S, Yoneyma T, et al. Significance of serum N‐glycan profiling as a diagnostic biomarker in urothelial carcinoma. Eur Urol Focus. 2018;4:405‐411. [DOI] [PubMed] [Google Scholar]
- 22. Tanaka T, Hatakeyama S, Yamamoto H, et al. Clinical relevance of aortic calcification in urolithiasis patients. BMC Urol. 2017;17:25. [DOI] [PMC free article] [PubMed] [Google Scholar]
- 23. Kang J, Schwartz R, Flickinger J, Beriwal S. Machine learning approaches for predicting radiation therapy outcomes: a clinician's perspective. Int J Radiat Oncol Biol Phys. 2015;93:1127‐1135. [DOI] [PubMed] [Google Scholar]
- 24. Wuhrer M, Selman MH, McDonnell LA, et al. Pro‐inflammatory pattern of IgG1 Fc glycosylation in multiple sclerosis cerebrospinal fluid. J Neuroinflammation. 2015;12:235. [DOI] [PMC free article] [PubMed] [Google Scholar]
- 25. Suzuki Y, Suzuki H, Makita Y, et al. Diagnosis and activity assessment of immunoglobulin A nephropathy: current perspectives on noninvasive testing with aberrantly glycosylated immunoglobulin A‐related biomarkers. Int J Nephrol Renovasc Dis. 2014;7:409‐414. [DOI] [PMC free article] [PubMed] [Google Scholar]
- 26. Malard‐Castagnet S, Dugast E, Degauque N, et al. Sialylation of antibodies in kidney recipients with de novo donor specific antibody, with or without antibody mediated rejection. Hum Immunol. 2015;77:1076‐1083. [DOI] [PubMed] [Google Scholar]
- 27. Kazuno S, Furukawa J, Shinohara Y, et al. Glycosylation status of serum immunoglobulin G in patients with prostate diseases. Cancer Med. 2016;5:1137‐1146. [DOI] [PMC free article] [PubMed] [Google Scholar]
- 28. Rademacher TW, Parekh RB, Dwek RA, et al. The role of IgG glycoforms in the pathogenesis of rheumatoid arthritis. Springer Semin Immunopathol. 1988;10:231‐249. [DOI] [PubMed] [Google Scholar]
- 29. Ferdosi S, Ho TH, Castle EP, Stanton ML, Borges CR. Behavior of blood plasma glycan features in bladder cancer. PLoS One. 2018;13:e0201208. [DOI] [PMC free article] [PubMed] [Google Scholar]
- 30. Maverakis E, Kim K, Shimoda M, et al. Glycans in the immune system and The Altered Glycan Theory of Autoimmunity: a critical review. J Autoimmun. 2015;57:1‐13. [DOI] [PMC free article] [PubMed] [Google Scholar]
- 31. Cheng G, Li M, Ma X, et al. Systematic analysis of microRNA biomarkers for diagnosis, prognosis, and therapy in patients with clear cell renal cell carcinoma. Front Oncol. 2020;10:543817. [DOI] [PMC free article] [PubMed] [Google Scholar]
- 32. Menni C, Gudelj I, Macdonald‐Dunlop E, et al. Glycosylation profile of immunoglobulin G is cross‐sectionally associated with cardiovascular disease risk score and subclinical atherosclerosis in two independent cohorts. Circ Res. 2018;122:1555‐1564. [DOI] [PMC free article] [PubMed] [Google Scholar]
- 33. Huhn C, Selman MH, Ruhaak LR, Deelder AM, Wuhrer M. IgG glycosylation analysis. Proteomics. 2009;9:882‐913. [DOI] [PubMed] [Google Scholar]
- 34. Kaneko Y, Nimmerjahn F, Ravetch JV. Anti‐inflammatory activity of immunoglobulin G resulting from Fc sialylation. Science. 2006;313:670‐673. [DOI] [PubMed] [Google Scholar]
Associated Data
This section collects any data citations, data availability statements, or supplementary materials included in this article.
Supplementary Materials
Figure S1
Figure S2
Table S1
Table S2
Data Availability Statement
All data needed to evaluate the conclusions in the paper are present in the paper and/or the Supplementary Materials. Additional data related to this paper may be requested from the authors.