

Abstract
The recurrence risk of estrogen receptor (ER)‐positive breast cancer remains high for a long period of time, unlike other types of cancer. Late recurrence reflects the ability of cancer cells to remain dormant through various events, including cancer stemness acquisition, but the detailed mechanism is unknown. ESR1 locus enhancing and activating noncoding RNAs (ELEANORS) are a cluster of nuclear noncoding RNAs originally identified in a recurrent breast cancer cell model. Although their functions as chromatin regulators in vitro are well characterized, their roles in vivo remain elusive. In this study, we evaluated the clinicopathologic features of ELEANORS, using primary and corresponding metastatic breast cancer tissues. The ELEANOR expression was restricted to ER‐positive cases and well‐correlated with the ER and progesterone receptor expression levels, especially at the metastatic sites. ELEANORS were detected in both primary and metastatic tumors (32% and 29%, respectively), and frequently in postmenopausal cases. Interestingly, after surgery, patients with ELEANOR‐positive primary tumors showed increased relapse rates after, but not within, 5 years. Multivariate analysis showed that ELEANORS are an independent recurrence risk factor. Consistently, analyses with cell lines, mouse xenografts, and patient tissues revealed that ELEANORS upregulate a breast cancer stemness gene, CD44, and maintain the cancer stem cell population, which could facilitate tumor dormancy. Our findings highlight a new role of nuclear long noncoding RNAs and their clinical potential as predictive biomarkers and therapeutic targets for late recurrence of ER‐positive breast cancer.
Keywords: cancer stemness, dormancy, ER‐positive breast cancer, late recurrence, long noncoding RNA
This study identifies the molecular mechanisms for the late recurrence of breast cancer. The chromatin regulating noncoding RNAs, ELEANORS, activate the cancer stemness CD44 gene and the long‐anticipated predictive biomarker.

Abbreviations
- AI
aromatase inhibitor
- BCSC
breast cancer stem‐like cell
- DISH
dual color in situ hybridization
- DTC
disseminated tumor cell
- ELEANOR
ESR1 locus enhancing and activating noncoding RNA
- ER
estrogen receptor
- HER2
human epidermal growth factor 2 receptor
- IHC
immunohistochemistry
- LNA
locked nucleic acid
- LTED
long‐term estrogen deprivation
- OS
overall survival
- PgR
progesterone receptor
- qRT‐PCR
quantitative RT‐PCR
- RFS
relapse‐free survival
- TAD
topologically associating domain
1. INTRODUCTION
Despite advances in diagnosis and treatment, recurrence remains a fatal problem for breast cancer patients. Breast cancer is heterogeneous and classified into subtypes based on the expression of ER, PgR, and HER2. 1 , 2 Although the underlying mechanism is unknown, ER‐negative subtypes typically relapse within 3 years of diagnosis, whereas ER‐positive subtypes have persistent risk of recurrence beyond 5 years and up to 20 years. 3 Remarkably, the 15‐year recurrence and mortality rates are comparable in patients who were diagnosed with ER‐positive or ER‐negative subtypes at early stages. 4 Late recurrence reflects the capacity of circulating tumor cells or DTCs to be in a dormant state for a long period, which eventually progress to activate metastatic growth and cause a fatal condition. 5 , 6 Dormant metastasis has been proposed to be linked to BCSCs, characterized as having high tumorigenicity and self‐renewal ability, which express the adhesion molecule CD44 but not CD24. 7 However, the mechanisms underlying the biology of dormancy remain unclear, and new diagnostic markers are required to identify patients at high risk of late recurrence.
Deep sequencing of mammalian transcripts has revealed the presence of numerous noncoding RNAs that are not translated into proteins. Many of them are dysregulated in cancers, and act as either oncogenic or tumor‐suppressing factors. Nuclear noncoding RNAs often regulate gene expression through various mechanisms, including epigenetics and 3D genome architectures. 8 , 9 , 10 Therefore, noncoding RNAs are potential diagnostic markers and therapeutic targets.
ELEANORS are a cluster of noncoding RNAs originally found in a model of aromatase inhibitor therapy‐resistant breast cancer, the LTED cells. These cells were established from ER‐positive breast cancer cell lines, including MCF7 and HCC1428. 11 ELEANORS are transcribed from a TAD of approximately 1 Mb (chr6: 151,750,000–152,750,000), which contains four genes including the ER‐coding ESR1 gene. 12 In the LTED nucleus, ELEANORS accumulate around the ESR1 gene to form an ELEANOR cloud and activate the entire ELEANOR TAD. Among the ELEANORS, characterizations of u‐ELEANOR, 11 pa‐ELEANOR, 12 and ELEANOR2 13 have revealed their importance for ELEANOR cloud formation and transcriptional activation of the genes in the ELEANOR TAD. 14 ELEANORS were characterized to balance between proliferation and apoptosis in in vitro experiments. Further explorations of the clinical significance of ELEANORS and their possible functions as diagnostic and prognostic markers have been eagerly anticipated.
In the present study, we evaluated the clinicopathologic features of ELEANORS in a wide range of clinical breast cancer samples, and identified a novel correlation between the noncoding RNAs in primary tumors and late recurrence. We also obtained mechanistic insight into cancer dormancy, including stemness gene activation by nuclear noncoding RNAs.
2. MATERIALS AND METHODS
2.1. Patients
We used clinical breast cancer samples from two independent cohorts: (1) 185 primary breast cancer patients who underwent surgeries for 2–5 cm (pT2) tumors of all pathological types from 2005 to 2006 at the Cancer Institute Hospital of Japanese Foundation for Cancer Research (JFCR); and (2) 167 metastatic breast cancer patients who underwent surgeries for their primary ER‐positive breast cancers between 2001 and 2016 and subsequently underwent biopsies or resections for the recurrent sites. In cohort (2), paired primary and metastatic site tissues were used. Information about the study was disclosed on a website where the participants could refuse to participate. This study was approved by the research ethics committee of the Cancer Institute Hospital of JFCR (project identification number: 2019–1024).
2.2. Immunohistochemical analysis and DISH
Immunohistochemistry and DISH were carried out and evaluated as described in Appendix S1. The Abs used in this study are listed in Table S1.
We used RNA‐FISH on 4 µm sections using a ZytoLight FISH Tissue Implementation Kit (ZytoVision, Z‐2028–20), as follows. The slides with the sections were heated for 10 min at 70°C, treated with xylene three times for 5 min, rehydrated in a series of graded ethanol solutions, washed with dH2O, incubated for 15 min in Heat Pretreatment Solution Citric at 98°C, and then washed with dH2O. The slides were then treated with Pepsin Solution for 30 min at 37°C in a humidity chamber, washed with 2× SSC for 5 min, and then with dH2O for 1 min. The slides were dehydrated and air‐dried. A probe that was predenatured by heating at 75°C for 10 min was then added. After 2 days of hybridization at 37°C, the slides were washed with Wash Buffer three times at 37°C, dehydrated, and mounted with ProLong Diamond Antifade with DAPI (Thermo Fisher Scientific). As probes, A SPEC ESR1/CEN6 Dual Color Probe (ZytoVision, Z‐2069–200), and BAC‐probes containing the ELEANOR locus (RP11‐450E24) and the CD44 locus (RP11‐790K21) were used.
2.3. Cell culture and siRNA and LNA transfections
HCC1428 cells (ATCC) and HCC1428‐LTED cells were cultured as previously described. 12 siRNA and LNA transfections were carried out with RNAiMAX (Invitrogen). The siRNA and LNA sequences are listed in Table S2. The cells were analyzed 48 h after transfection by qRT‐PCR, immunoblotting, and Transwell assay.
2.4. Fluorescence activated cell sorter analysis
At 72 h after the LNA transfection, cells (1 × 10⁶) were suspended in 50 μl PBS/BSA buffer containing 2% BSA, and incubated with Abs against CD44‐PE (BD, 515) and CD24‐FITC (BD, ML5) or both isotype controls (BD) for 30 min at 4°C. To exclude dead cells, 7‐AAD (BD) was added. Samples were analyzed by FACSLyrics (BD). Experiments were repeated in triplicate. Data analysis was undertaken using FLOWJo version 10.7 software.
2.5. Mouse xenograft
Female NOD/SCID mice were purchased from Charles River Laboratories. For xenograft tumor formation, HCC1428 and HCC1428‐LTED cells (5 × 10⁶) were mixed with equal volumes of Matrigel matrix (Corning) and injected into the mammary fat pads of mice, 2 weeks after ovariectomy. HCC1428, MDA‐MB‐231, and MDA‐MB‐468 cells (5 × 10⁶) with Matrigel were also injected into mice without ovariectomy. Tumor volume was measured weekly and estimated by using the formula: tumor volume (mm3) = (length × width × width) / 2.
Detailed methods for selection of clinical tissue sections, tissue microarray preparation, classification of breast cancer subtypes, microscopic analysis, qRT‐PCR analysis, immunoblotting, tumorsphere assay, Transwell assay, and CCK‐8 assay are described in Appendix S1. Primers used for qRT‐PCR analysis are listed in Table S3.
2.6. Statistical analysis
Pearson’s χ2‐test was used for two‐group comparisons and the t‐test was used to compare the means among groups. Spearman’s rank correlation coefficient (rs) was used to investigate correlations between two ranks and interpreted as follows: very weak (0.00–0.19), weak (0.20–0.39), moderate (0.40–0.69), strong (0.70–0.89), and very strong (0.90–1.00). The Kaplan–Meier method was used to estimate the survival curves, which were compared using log–rank tests or Wilcoxon tests. Multivariate analysis was carried out by using the Cox proportional hazards model. p values below 0.05 were considered statistically significant. Statistical analysis was undertaken with JMP13.2.1 software (SAS Institute, Inc.).
3. RESULTS
3.1. ELEANOR cloud is correlated with ER expression in human breast cancer tissues
To investigate the clinical significance of ELEANORS, we assessed ELEANOR expression in 185 primary breast cancers with pathological sizes from 2 to 5 cm (pT2), including all the main subtypes. Intense ELEANOR FISH signals were often detected in the nuclei of carcinoma cells and classified as follows: score 0, score 1 (small ELEANOR), and score 2 (large ELEANOR; Figure 1A). Furthermore, score 0 was considered as ELEANOR−, and scores 1 and 2 were considered as ELEANOR+. After excluding seven indeterminate cases with samples that were unsuitable for FISH procedures, we identified 58 cases (33%) with ELEANOR+ tumors (Figure 1A).
FIGURE 1.

ELEANOR expression is positively correlated with estrogen receptor (ER) expression and late recurrence in breast cancer patients. (A) ELEANOR scoring of 178 primary breast cancers. FISH images represent three groups: score 0 (ELEANOR negative), score 1 (small ELEANOR), and score 2 (large ELEANOR). Scores 1 and 2 were defined as ELEANOR+. (B) Mosaic plot showing proportions of ELEANOR+ and ELEANOR− patients in each breast cancer subtype. The actual number is indicated in each box (total, n = 178). TNBC, triple‐negative breast cancer. (C) Representative H&E (top), ER immunohistochemistry (IHC) (middle), and corresponding RNA FISH (bottom) images for cases with ELEANOR scores of 0–2 (left to right). Scale bars, 100 (top and middle) and 10 μm (bottom). (D) Mosaic plot showing the association between the ELEANOR scores and the ER expression levels in IHC, proportion score (left) and intensity score (right) by the Allred scoring system. Actual numbers detected are indicated in each box. rs, Spearman's rank correlation coefficient. (E) Kaplan–Meier curves showing relapse‐free survival (left) and overall survival (right) of ER‐positive primary patients with ELEANOR+ and − tumors (n = 141, log–rank test). The ELEANOR+ group showed higher risk of recurrence over 5 years after surgery
The ELEANOR expression was observed in luminal A‐like, luminal B‐like, and luminal‐HER2 type breast cancers, which were all ER‐positive (Figure 1B) and was absent from ER‐negative subtypes, HER2, and triple‐negative breast cancer. We then focused only on the ER‐positive group (n = 141) and found that the ELEANOR expression was significantly frequent in tumors from patients who were postmenopausal or over 50 years old (Table 1). The presence of an ELEANOR cloud was often correlated with ER expression (Figure 1C). The common Allred scoring system for ER using IHC showed that higher ELEANOR scores were correlated with higher proportions of ER‐positive cells (ER proportion score) and higher ER staining intensities (ER intensity score) (Spearman’s rank correlation test, rs = 0.30, rs = 0.25, respectively; Figure 1D). These results are consistent with previous in vitro observations 11 that ELEANORS are prevalent in LTED cells and overexpressing ER through the chromatin‐regulating function of ELEANORS.
TABLE 1.
Association of ELEANOR expression with clinicopathologic parameters in 141 estrogen receptor‐positive breast cancer patients
| Parameter | ELEANOR expression, n (%) | p value | |
|---|---|---|---|
| Positive (n = 58) | Negative (n = 83) | ||
| Age (years) | |||
| <50 | 11 (19) | 40 (48) | <0.001** |
| ≥50 | 47 (81) | 43 (52) | |
| Menopausal statusa | |||
| Premenopausal | 17 (29) | 47 (57) | 0.001** |
| Postmenopausal | 41 (71) | 35 (43) | |
| Grade | |||
| 1, 2 | 43 (74) | 60 (72) | 0.810 |
| 3 | 15 (26) | 23 (28) | |
| Ki‐67b | |||
| Low, intermediate | 50 (88) | 67 (84) | 0.520 |
| High | 7 (12) | 13 (16) | |
| PgR | |||
| Positive | 46 (79) | 64 (77) | 0.760 |
| Negative | 12 (21) | 19 (79) | |
| HER2 | |||
| Positive | 5 (9) | 3 (4) | 0.210 |
| Negative | 53 (91) | 80 (96) | |
| ly | |||
| Positive | 29 (50) | 46 (55) | 0.530 |
| Negative | 29 (50) | 37 (45) | |
| Axillary lymph node metastasis | |||
| Positive | 28 (48) | 41 (49) | 0.900 |
| Negative | 30 (52) | 42 (51) | |
| No. of metastatic axillary lymph nodes | |||
| 0–3 | 50 (86) | 75 (90) | 0.440 |
| ≥4 | 8 (14) | 8 (10) | |
| Adjuvant therapy | |||
| Endocrine therapyc | 53/57 (93) | 69/81 (85) | 0.160 |
| Chemotherapyd | 30/57 (53) | 56/83 (67) | 0.080 |
| Radiation therapye | 21/57 (37) | 29/83 (63) | 0.820 |
One patient with unknown menopausal statusa and four patients with undetermined Ki‐67b were excluded from the analysis. Three patients with unknown history of endocrine therapyc and one patient with unknown history of chemotherapyd and radiation therapye were excluded from the analysis.
Abbreviations: HER2, human epidermal growth factor 2 receptor; ly, lymphatic invasion; PgR, progesterone receptor.
**p < 0.01.
3.2. ELEANOR expression could facilitate late recurrence in ER‐positive breast cancer
Assessments of the same ER‐positive group (n = 141) showed that patients with ELEANOR+ primary tumors have worse RFS and OS than ELEANOR− patients (Figure 1E). Among the ER‐positive subtypes, the difference between ELEANOR+ and − was more significant in luminal B‐like subtype, but not luminal A‐like subtype (Figure S1A). We then divided the Kaplan–Meier survival curves of Figure 1E into early (0–5 and 0–8 years after surgery for RFS and OS, respectively) and late (>5 and >8 years after surgery for RFS and OS, respectively) time windows (Figure S1B). We found that ELEANOR+ was prognostic for late (log–rank test, p = 0.006) but not early (log–rank test, p = 0.67) recurrence risk (Figure S1B, top). The same was true for OS (Figure S1B, bottom panel). Furthermore, the patients with ELEANOR scores of 1 and 2 had similar worse RFS beyond 5 years after surgery, compared to those with an ELEANOR score of 0 (Figure S2).
These results demonstrate that ELEANORS are involved in the late recurrence of ER‐positive breast cancer. A multivariate analysis adjusting for grade and HER2 status showed that ELEANOR expression could serve as an independent recurrence risk factor of ER‐positive breast cancer patients (hazard ratio = 2.40, p = 0.014; Table 2). Furthermore, subgroup analyses of patients who received adjuvant endocrine therapies also showed that ELEANOR+ patients had higher recurrence rates beyond 5 years after surgery (Figure S1C). These results suggest that ELEANORS play a pivotal role in the acquisition of resistance to adjuvant endocrine therapy.
TABLE 2.
Univariate and multivariate analyses of relapse‐free survival in 141 estrogen receptor‐positive breast cancer patients
| Variable | Univariate p value | Multivariate analysis | |
|---|---|---|---|
| Multivariate p value | Hazard ratio (95% CI) | ||
| ELEANOR status (negative/positive) | 0.017* | 0.014* | 2.40 (1.20–4.95) |
| Grade (1–2/3) | 0.034* | 0.11 | − |
| HER2 status (negative/positive) | 0.021* | 0.42 | − |
| No. of metastatic axillary lymph nodes (0–3/≥4) | 0.080 | − | − |
| Menopausal status (pre/postmenopausal) | 0.43 | − | − |
| ly (negative/positive) | 0.66 | − | − |
| Ki‐67 (low, intermediate/high) | 0.72 | − | − |
| PgR status (negative/positive) | 0.93 | − | − |
Abbreviations: CI, confidence interval; HER2, human epidermal growth factor 2 receptor; ly, lymphatic invasion; PgR, progesterone receptor, −, not included in analysis.
*p < 0.05.
3.3. ELEANORS maintain ER and PGR expression after metastasis
To investigate the involvement of ELEANORS in the recurrence in more detail, we next used 167 paired samples from ER‐positive primary tumors and their corresponding metastases. We undertook an ELEANOR FISH analysis, excluded 28 cases that were unsuitable for the FISH procedures, and analyzed the remaining 139 cases. We found that ELEANORS were expressed in 45 cases (32%) of primary tumors and 40 cases (29%) of metastatic sites. Consistent with the results in Figure 1E, a set of these clinical samples showed that the patients with ELEANOR+ primary tumors relapsed later than ELEANOR− patients (Figure 2A). This again supports the idea that ELEANORS are involved in late recurrence. The analysis of this dataset also indicated that ELEANORS are overrepresented in lung metastases (Tables S4 and S5).
FIGURE 2.

ELEANOR expression in primary tumors could predict less negative conversion of estrogen receptor (ER)/progesterone receptor (PgR) expression in recurrence. (A) Kaplan–Meier analysis showing the time to recurrence in patients with the indicated ELEANOR status in their primary tumors (n = 139, Wilcoxon test). Numbers at risk at each time point are shown. The ELEANOR+ patients relapsed later than the ELEANOR– patients. (B) FISH analysis of ELEANOR expression in pairs of primary and metastatic breast cancers (n = 139). Representative cases in which ELEANORS remained negative (− to −), remained positive (+ to +), changed from negative to positive (− to +) and from positive to negative (+ to −) after metastasis are shown from top to bottom. All primary tumors tested in this study are ER‐positive. Scale bars, 10 μm. (C) Mosaic plots showing the rates of changes in the ER (left) and PgR (right) statuses after metastasis. Patients without ELEANOR expression in their primary tumors (–) had higher frequencies of negative conversions of ER and PgR expression (dark blue area), while those with ELEANOR expression in their primary tumors (+) tended to maintain ER and PgR expression (purple area). Actual numbers are shown in each area (total, n = 139). p values were calculated from Pearson's χ2‐test to evaluate the correlation between primary ELEANOR expression and each negative conversion
We then followed up the changes in ELEANOR expression for each person (Figure 2B), as all patients in this group eventually experienced recurrence. Of the 139 cases, 116 (83%) showed the same ELEANOR status in primary and metastatic sites, and 31 of the 45 cases (69%) remained ELEANOR+ after metastasis (Tables 3 and S6). We detected a slight increase of ELEANOR expression in patients after adjuvant endocrine therapy, including AI treatment, although it was not statistically significant, partly due to the small sample size (Pearson’s χ2‐test, p = 0.18; Table S7).
TABLE 3.
Changes in ELEANOR expression after breast cancer metastasis
| ELEANOR expression in primary tumors | ELEANOR expression in metastatic sites, n (%) | |
|---|---|---|
| Negative (n = 99) | Positive (n = 40) | |
| Negative (n = 94) | 85 (90) | 9 (10) |
| Positive (n = 45) | 14 (31) | 31 (69) |
Alterations of hormone receptor (ER and PgR) status after metastasis have impacts on prognostic values. Patients with a negative conversion of ER status tend to experience worse prognoses than those with persistent receptor‐positive disease. 15 , 16 Therefore, we analyzed the association between the hormone receptor status changes and the ELEANOR expression in primary tumors. We found that patients with ELEANOR+ primary tumors had less frequent conversions of their ER and PgR expression status from positive to negative after metastasis (Pearson’s χ2‐test, p = 0.012, p = 0.036, respectively; Figure 2C).
To elucidate how ELEANORS affect ER/PgR expression during cancer progression, we assessed their correlations in both primary and metastatic sites. Analyses of the breast cancer biomarker status indicated that ELEANOR expression in metastatic sites was significantly correlated with PgR+ and HER2−, which was not observed in primary tumors (Table 4). Detailed immunostaining analyses using the Allred scoring system showed that the ELEANOR scores were more strongly correlated with the ER proportion scores in metastatic sites (rs = 0.38 and p < 0.001; Figure 3A, bottom left panel), as compared to primary tumors (rs = 0.23 and p = 0.006; Figure 3A, top left panel). The stronger correlation of ELEANORS and ER in metastatic sites than in primary tumors was also confirmed by measuring the ER signal intensities (rs = 0.49 for metastatic sites, rs = 0.37 for primary tumors; Figure 3A, right panels). Furthermore, we detected a positive correlation between ELEANORS and PgR in metastatic sites (rs = 0.29 for proportion score, rs = 0.23 for intensity score; Figure 3B, bottom panels), which was not observed in primary tumors (Figure 3B, top panels). These results suggested that ELEANORS activate ER gene expression, leading to further activation of its target genes as a transcription factor, including the PgR gene, after metastasis. 17 , 18 Therefore, ELEANORS could play a role in breast cancer metastatic progression through ER signaling pathway activation.
TABLE 4.
Association between ELEANOR expression and pathological parameters in 139 pairs of primary and metastatic breast cancers
| Parameter | ELEANOR expression in primary tumors, n (%) | ELEANOR expression in metastatic sites, n (%) | ||||
|---|---|---|---|---|---|---|
| Positive (n = 45) | Negative (n = 94) | p value | Positive (n = 40) | Negative (n = 99) | p value | |
| ER | ||||||
| Positive | 45 (100) | 94 (100) | – | 40 (100) | 82 (83) | <0.001** |
| Negative | 0 (0) | 0 (100) | 0 (0) | 17 (17) | ||
| PgR | ||||||
| Positive | 36 (80) | 76 (81) | 0.91 | 31 (78) | 47 (48) | <0.001** |
| Negative | 9 (20) | 18 (19) | 9 (23) | 52 (53) | ||
| HER2 | ||||||
| Positive | 5 (11) | 15 (16) | 0.45 | 1 (3) | 19 (19) | 0.004** |
| Negative | 40 (89) | 79 (84) | 39 (98) | 80 (81) | ||
| Grade | ||||||
| 1, 2 | 33 (73) | 68 (72) | 0.90 | 34 (85) | 80 (81) | 0.550 |
| 3 | 12 (27) | 26 (28) | 6 (15) | 19 (19) | ||
| Ki‐67a | ||||||
| Low, intermediate | 31 (70) | 59 (66) | 0.57 | 30 (75) | 72 (74) | 0.920 |
| High | 13 (30) | 31 (34) | 10 (25) | 25 (26) | ||
Five primary cases and two metastatic cases with indeterminate Ki‐67a were excluded from this analysis.
Abbreviations: ER, estrogen receptor; HER2, human epidermal growth factor 2 receptor; PgR, progesterone receptor.
**p < 0.01.
FIGURE 3.

ELEANOR expression becomes positively correlated with progesterone receptor (PgR) expression in metastatic sites. (A, B) Mosaic plots showing the association between ELEANOR scores 0–2 and (A) estrogen receptor (ER) or (B) PgR status, determined by the Allred score. ER proportions (left) and ER intensities (right) in primary (top) and metastatic (bottom) tissues are shown. ELEANOR expression has a positive correlation with ER expression in both primary and metastatic tissues (A), and a correlation with PgR expression in metastatic tissues (B). rs, Spearman's rank correlation coefficient
3.4. ELEANORS activate the CD44 gene and breast cancer stemness
Late recurrence is supported by several factors, including tumor dormancy, cancer stemness, and resistance to endocrine therapy. CD44+/CD24−/low is a biomarker for BCSCs. CD44 is a cell adhesion molecule that plays an important role in cancer progression and metastasis. 19 , 20 We therefore analyzed BCSCs with the ER‐positive cell lines HCC1428 and MCF7 as a model for ER‐positive breast cancer and their LTED cells as an in vitro model representing endocrine resistance with high expression of ELEANORS. 11 HCC1428‐LTED cells had higher sphere‐forming ability as compared to the original HCC1428 cells, suggesting the presence of BCSCs (Figure 4A). We knocked down the ELEANOR2 RNA, the most abundant member of the ELEANORS, with LNA and then analyzed the effect on CD44/CD24 expression with a FACS. As shown in Figure 4B, the ELEANOR2 knockdown significantly decreased the BCSC population (CD44+/CD24−/low).
FIGURE 4.

ELEANORS activate CD44 gene expression for breast cancer stemness. (A) Higher tumorsphere‐forming ability is shown in HCC1428‐long‐term estrogen deprivation (LTED) cells than in HCC1428 cells. Images of tumorspheres were captured (left) and quantified (right). (B) FACS analysis of stem cell surface markers, CD44+/CD24−/low, in HCC1428‐LTED cells with ELEANOR2 knockdown (left) and quantification (right). (C, D) Quantitative RT‐PCR (qRT‐PCR) analyses of ESR1 mRNA, ELEANORS, and CD44 mRNA. CD44 expression was increased in HCC1428‐LTED cells, which overexpress ELEANORS, compared to HCC1428 cells (C). CD44 expression was reduced with ELEANOR knockdown (D, right columns). (E) Immunoblot analysis of CD44 (top) and its quantification (bottom). (F) FACS analysis of the CD44+ cell population (left) and its quantification (right) in HCC1428‐LTED cells. The number of CD44+ cells was reduced by ELEANOR knockdown. The most frequent value in the analysis was set at 100. (G) Quantitative RT‐PCR analyses of ESR1 mRNA, ELEANORS, and CD44 mRNA. CD44 expression was not reduced by ESR1 mRNA knockdown. (H) Immunoblot analysis of estrogen receptor‐α (ERα) in HCC1428‐LTED cells treated with the indicated siRNAs and locked nucleic acids (LNAs). (E, H) GAPDH served as a loading control. FACS data (B, F) are representative of three independent experiments. (A–G) Values are mean ± SE. p values were determined by independent sample t‐tests: *p < 0.05, **p < 0.01, ***p < 0.001
The qRT‐PCR analysis revealed that the CD44 mRNA, as well as two specific ELEANORS, ELEANOR2 and pa‐ELEANOR, 11 , 13 are overexpressed in HCC1428‐LTED cells, as compared to HCC1428 cells (Figure 4C). Expression of CD44 mRNA decreased with knockdowns of those ELEANORS (Figure 4D). The immunoblot analysis revealed that CD44 protein expression also correlated with ELEANOR expression (Figure 4E). Furthermore, the FACS analysis showed that the ELEANOR knockdown decreased the CD44+ population in HCC1428‐LTED cells (Figure 4F).
MCF7‐LTED cells, another ELEANOR‐expressing cell line, also showed higher sphere‐forming ability (Figure S3A), and higher expression levels of CD44 mRNA (Figure S3B) and protein (Figure S3D), than the parental MCF7 cells. The effect of the ELEANOR knockdown on CD44 expression in MCF7‐LTED cells was significant at the mRNA level (Figure S3C), but had minor to no effects at the protein level (Figure S3D,E), probably due to the low initial CD44 protein level in MCF7‐LTED cells. The FACS analysis of MCF7‐LTED cells showed a slight but significant decrease in the numbers of CD44+ cells by the ELEANOR2 knockdown (Figure S3F). These data suggest the conserved function of ELEANORS in different cell lines.
These findings indicated that ELEANORS are involved in the upregulation of the CD44 gene. In contrast, the CD44 mRNA expression level was not affected by the ESR1 mRNA knockdown (Figure 4G), despite the fact that both the ESR1 mRNA and ELEANOR knockdowns equally and expectedly repressed ER protein expression (Figure 4H). These results exclude the possibility of the involvement of ER proteins in the activation of CD44 expression in LTED cells. The acquisition of cell migration ability is also an important part of metastasis. The ELEANOR knockdown experiments did not show a significant decrease in this activity (Figure S4). We further investigated whether the upregulation of CD44 by ELEANORS directly contributes to the high sphere‐forming ability. We knocked down CD44 in LTED cells, and found that the CD44 knockdown significantly suppressed the sphere formation abilities of HCC1428‐ and MCF7‐LTED cells (Figure 5A). These findings implied that ELEANORS play a role in cancer stemness through upregulation of CD44.
FIGURE 5.

ELEANORS could upregulate the CD44 gene in mouse xenografts. (A) Tumor sphere assays of HCC1428‐long‐term estrogen deprivation (LTED) and MCF7‐LTED cells with the CD44 knockdown. Images of tumorspheres were captured (left) and quantified (right). (B) HCC1428 and HCC1428‐LTED cells were xenografted to mammary fat pads in ovariectomized mice, and the tumor sizes were measured (left; n = 8, each group). The tumors formed with HCC1428‐LTED transplantations are shown (top photographs). No tumors were formed in mice transplanted with the original HCC1428 cells. The H&E staining, estrogen receptor (ER) immunohistochemistry, and ELEANOR FISH images from the tumors in the xenografted mice are shown (bottom). Scale bars, 1 cm, 50 μm, and 10 μm (left to right). (C) Quantitative RT‐PCR (qRT‐PCR) analyses of ESR1 mRNA, ELEANORS, and CD44 mRNA levels in LTED cells before (in vitro) and after (in vivo) transplantation. (D) qRT‐PCR analyses of CD44 mRNA and (E) representative images of CD44 immunohistochemistry of tumors in mice transplanted with the indicated cells. Scale bar, 50 μm. In (D) and (E), HCC1428, MDA‐MB‐231, and MDA‐MB‐468 cells were transplanted into mice without ovariectomy, to let the cells form tumors. (F) RNA‐FISH images of ELEANORS and centromere 6 (left) and ELEANORS and CD44 (middle). Nuclei with ELEANOR signals overlapping with the CEN6 (blue bar) or CD44 (red bar) signals were quantified (right). p values were calculated using the two‐tailed Fisher's exact test. (A–C) Each value represents the mean ± SE. p values were determined by t‐tests: *p < 0.05, ***p < 0.001
3.5. ELEANORS upregulate the CD44 gene in mouse xenografts and clinical breast cancer
To further explore the characteristics of ELEANORS in vivo, HCC1428 cells and HCC1428‐LTED cells were xenografted to mammary fat pads in ovariectomized NOD/SCID mice, and tumor formations were evaluated (n = 8, each group). None of the mice injected with the original HCC1428 cells formed palpable tumors, whereas those injected with HCC1428‐LTED cells showed tumor formation (Figure 5B, graph and photographs). A FISH analysis revealed the persistent expression of ELEANORS in the transplanted HCC1428‐LTED cells (Figure 5B, micrograph). These results suggest that the BCSC population appeared or increased in the HCC1428‐LTED cells with the ELEANOR expression. 21 In fact, qRT‐PCR indicated that the CD44 mRNA level in HCC1428‐LTED cells was upregulated in the xenografted mouse, as compared with the level in cells cultured in vitro before the transplantation (Figure 5C). The CD44 mRNA (Figure 5D) and protein (Figure 5E) expression levels were higher in the tumors derived from the HCC1428‐LTED cells transplanted to ovariectomized mice than those from the HCC1428 cells transplanted in nonovariectomized mice. The CD44 mRNA was upregulated to a level comparable to that of tumors formed by the transplantation of the CD44‐expressing triple‐negative cell line, MDA‐MB‐231 (Figure 5D). The CD44 protein level in the transplanted HCC1428‐LTED cells was even higher than that in MDA‐MB‐231 cells, and similar to that in triple‐negative MDA‐MB‐468 cells (Figure 5E).
To test whether the elevated CD44 expression occurs near the ELEANOR cloud, we simultaneously visualized ELEANORS and the sites of CD44 transcription by RNA‐FISH, using tumors derived from HCC1428‐LTED cells that were xenografted into ovariectomized mice. We found that CD44 more frequently overlapped with ELEANORS, as compared to the control centromere 6 (Figure 5F). This finding suggested that ELEANORS could upregulate CD44 gene expression by providing a transcriptionally active nuclear environment. 11 However, the possibility of indirect effect is not excluded.
To investigate whether the CD44 expression state is correlated with ELEANOR expression in clinical samples, we next analyzed CD44 expression in pT2 primary ER‐positive breast cancer tissues (n = 141), as shown in Figure 1E. A representative IHC analysis of CD44 revealed more CD44‐positive cells in the ELEANOR+ group (scores 1 and 2; Figure 6A). The Allred scoring system showed very weak to weak correlations between the ELEANOR scores and the proportion and intensity scores of the CD44 expression (Figure 6B; rs = 0.19, p = 0.02 and 0.20, p = 0.02, respectively). In addition to the analyses of cultured cell lines (Figures 4 and 5), these results from the patients’ tissues implied the involvement of ELEANORS in late recurrence by maintaining BCSCs through CD44 gene activation, in addition to ER signaling activation.
FIGURE 6.
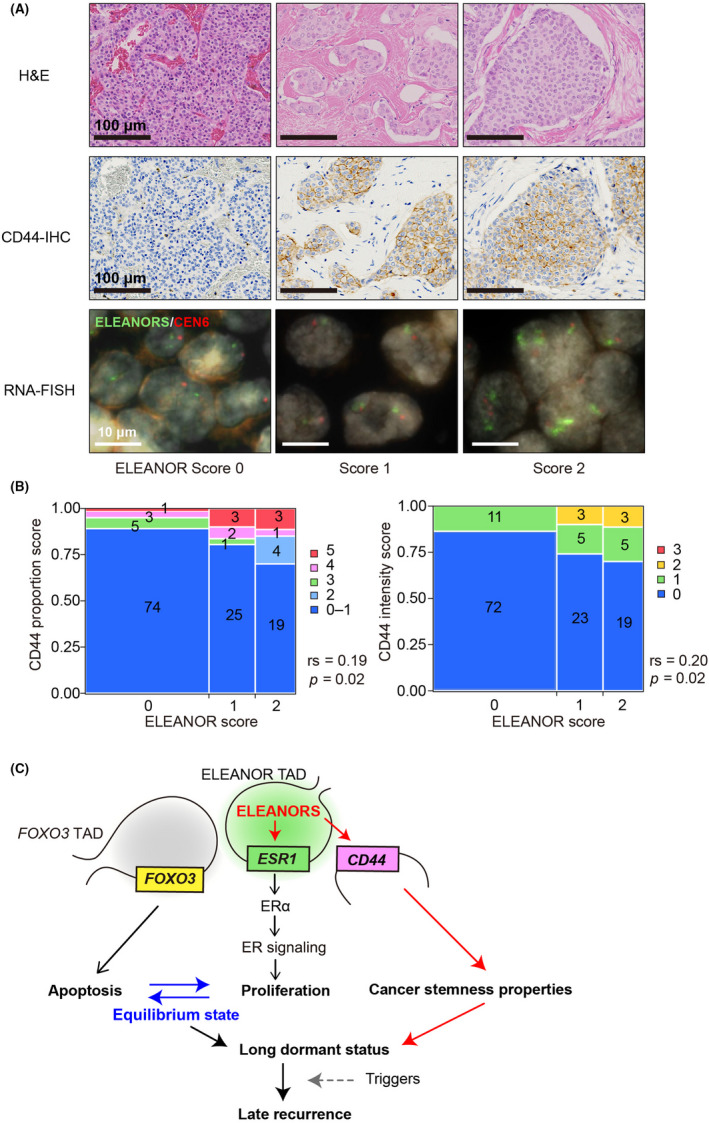
ELEANORS could play a role in late recurrence through CD44 gene activation. (A) Representative H&E (top), immunohistochemistry (IHC) for CD44 (middle), and ELEANOR FISH (bottom) for tissues with ELEANOR scores of 0–2. Scale bars, 100, 100, and 10 μm (top to bottom, respectively). (B) Mosaic plots showing the association between ELEANOR scores and CD44 expression levels, determined with IHC. The CD44 proportion score (left) and intensity score (right) were determined by the Allred scoring system. Actual numbers detected are indicated in each box. rs, Spearman's rank correlation coefficient. (C) A proposed model. The equilibrium mechanism between cell proliferation (estrogen receptor [ER] signaling activation, middle) and apoptosis (FOXO3 gene activation, left) through ELEANORS was previously reported. 12 This study showed a correlation between ELEANORS and active ESR1 (middle) and CD44 (right) in clinical tissues. All of these properties contribute to late recurrence through tumor dormancy. TAD, topologically associating domain
4. DISCUSSION
In the present study, we have evaluated clinicopathologic features of ELEANORS in primary and metastatic breast cancer. We found that 33% of primary tumors from all subtypes were ELEANOR+, and exclusively ER‐positive. Approximately 41% of ER‐positive primary tumors were ELEANOR+, which has higher recurrence risk beyond 5 years after surgery. We found a strong correlation between the presence of ELEANORS and active ESR1 and CD44, which might both contribute to a long dormant status (Figure 6C). Our study provides the long‐anticipated molecular mechanisms and a predictive biomarker of late recurrence.
Late recurrence reflects the capacity of DTCs remaining in a dormant state for protection from cancer therapeutics or unfavorable microenvironments, such as immune surveillance, while also maintaining their tumorigenic features for final outgrowth to macrometastasis. 5 , 22 , 23 Indeed, several studies implied that BCSCs, which are the majority of DTCs, play critical roles in the acquisition of resistance to chemotherapy 24 and endocrine therapy. 25 , 26 The resistance in endocrine therapy is regulated by a complex network 27 that includes modulation of ER signaling and activation of growth factor signaling factors, 28 , 29 such as NOTCH, 30 Wnt, 31 and Hedgehog, 32 through enrichment of BCSCs. For ER signaling, the ER‐positive status was retained in most endocrine‐resistant recurrent tumors. 33 , 34 Evidence supports the contribution of ER signaling to the enhancement of BCSCs and endocrine resistance. 35 Despite the central role and higher frequency in approximately 20% of metastatic ER‐positive breast cancers, 36 ESR1 mutations were rare (<1%) in primary untreated tumors from The Cancer Genome Atlas data. In contrast, ELEANORS were expressed in primary tumors with high concordance with their expression in metastatic lesions, suggesting that ELEANORS could be drivers of carcinogenesis. Additionally, ELEANOR expression tended to persist with ER and PgR expression in metastasis, suggesting the important contribution of ER signaling to endocrine resistance and recurrence in ER‐positive breast cancer. In parallel with previous research on noncoding RNAs, 37 , 38 we propose that ELEANORS are involved in BCSC regulation (Figure 6C).
Predicting the risk of late recurrence at the initial diagnosis and after adjuvant endocrine therapy is also an important goal for managing patients with ER‐positive breast cancer. As clinicopathologic parameters such as grade or tumor size, other than nodal status, have limited value for estimations of prognosis after 5 years, 3 a more precise scoring system, such as CTS5 39 and a 49‐gene signature, 40 were proposed. In this study, the multivariate analysis showed that ELEANORS are an independent recurrence risk factor of ER‐positive breast cancer. This shed light on the potential of ELEANORS for predicting the recurrence risk beyond 5 years.
Among ER‐positive breast cancer patients, we found that ELEANORS were present at similar rates in both primary tumors and metastatic sites (29%–32%). These results were somewhat surprising, because ELEANORS were originally detected as being enhanced in a recurrent ER‐positive breast cancer model, LTED cells, which were estrogen‐deprived for a long period to recapitulate the AI therapy. 11 In this study, we found a slight correlation between ELEANOR expression and the administration of adjuvant AI therapy, which was not statistically significant (Table S7). We also detected a significant correlation between ELEANOR expression and postmenopausal status or age over 50 years. Accordingly, ELEANOR expression could be induced by the natural estrogen deprivation of postmenopausal status in breast cancer. It is also noteworthy that the original MCF7 cells contain small but recognizable amounts of ELEANORS, as detected by both FISH and transcriptome analyses. 11 Therefore, our current scores reflect the presence, rather than prevalence, of ELEANORS in breast cancer.
The previous in vitro experiments reflected in vivo events well. 11 For example, ELEANOR expression was significantly correlated with ER overexpression in clinical breast cancer. ELEANORS have been characterized as a new type of noncoding RNA that mediate locus control regulation, 41 delineate the transcriptionally active TAD, and activate the genes within it: ESR1 and three neighboring genes. 12 , 41 The TAD also interacts with another transcriptionally active TAD containing the FOXO3 gene, which is 42.9 Mb away from ESR1 on chromosome 6. FOXO3 is a transcription factor that induces apoptosis. We previously reported that this interaction plays a role in balancing two contradictory activities, cell proliferation and apoptosis, through long‐range chromatin interactions. 12 This could contribute to tumor dormancy by regulating the equilibrium between cell growth and death in vivo.
The RNA‐FISH analysis also revealed the interaction between ELEANORS and CD44 signals. CD44 is located on a different chromosome (chromosome 11) from ELEANORS (chromosome 6), suggesting that ELEANORS could also be involved in the transcriptional regulation of distant genes. CD44 is a cell adhesion molecule and BCSC marker, and might be another important component of tumor dormancy. CD44 has a different isoform pattern of expression within breast cancer subtypes, highlighting the importance of specific variant types in stemness. 42 CD44 reportedly has metastatic capacity through potentiating the adhesion of circulating tumor cells to distant endothelial cells in the bloodstream. 19 , 43 , 44 In fact, ELEANOR knockdown in LTED cells decreased the BCSC population and CD44 gene expression level independently of ER signaling. Overexpression of ELEANORS also showed higher tumor sphere‐forming ability regulated by CD44 expression (Figures 4A and 5A) and tumorigenic features in ovariectomized mice (Figure 5B), suggesting the correlation with BCSCs. Taken together, we propose a working model in which ELEANORS could be involved in late recurrence (Figure 6C). In addition to maintaining an equilibrium between cell proliferation and apoptosis (Figure 6C, left and middle 12 ), ELEANORS could activate the CD44 gene. This would promote the endowment of cancer cells with dormant BCSC properties to survive and eventually induce outgrowth to active metastasis, accompanied by the proliferation abilities resulting from ER activation (Figure 6C, right).
In summary, ELEANORS are proposed as a new prediction marker and therapeutic target against late recurrence in ER‐positive breast cancer. Our results also provide new insights into research regarding cancer initiation, progression, and metastasis regulated by noncoding RNAs.
DISCLOSURE
T.U. is supported from Chugai Pharmaceutical Co., Ltd, Eisai Co., Ltd, AstraZeneca K.K., and Novartis Pharma K.K. N.S. is supported by the Takeda Science Foundation and the Sharyo Foundation. The other authors have no conflict of interest. K.T. and N.S are associate editors of Cancer Science.
Supporting information
Figure S1
Figure S2
Figure S3
Figure S4
Table S1‐S7
Appendix S1
ACKNOWLEDGMENTS
We thank the members of Saitoh’s laboratory and Dr. Tomoyuki Kitagawa (JFCR) for discussions. We greatly appreciate Drs. Rika Yonekura and Makiko Ono (JFCR) for assembling the clinical information. We also appreciate the technical staff members in the Division of Pathology, Cancer Institute of JFCR, for TMA construction, immunostaining, and DISH on clinical samples. This work was supported in part by JSPS KAKENHI grant numbers JP18H05531 (to N.S.), JP16H04744 (to N.S.), JP19H03721 (to T.U.), JP17K10568 (to T.O.), JP21K06898 (to T.O.) and JP20K15722 (to Y.I.). N.S. is supported by the Takeda Science Foundation and the Sharyo Foundation.
Fukuoka M, Ichikawa Y, Osako T, et al. The ELEANOR noncoding RNA expression contributes to cancer dormancy and predicts late recurrence of estrogen receptor‐positive breast cancer. Cancer Sci. 2022;113:2336–2351. doi: 10.1111/cas.15373
Funding information
Japan Society for the Promotion of Science KAKENHI, Grant/Award Number: JP18H05531, JP16H04744, JP19H03721, JP17K10568, JP21K06898, JP20K15722; Takeda Science Foundation; Sharyo Foundation.
REFERENCES
- 1. Perou CM, Sørlie T, Eisen MB, et al. Molecular portraits of human breast tumours. Nature. 2000;406:747‐752. [DOI] [PubMed] [Google Scholar]
- 2. Sørlie T, Perou CM, Tibshirani R, et al. Gene expression patterns of breast carcinomas distinguish tumor subclasses with clinical implications. Proc Natl Acad Sci USA. 2001;98:10869‐10874. [DOI] [PMC free article] [PubMed] [Google Scholar]
- 3. Pan H, Gray R, Braybrooke J, et al. 20‐year risks of breast‐cancer recurrence after stopping endocrine therapy at 5 years. N Engl J Med. 2017;377:1836‐1846. [DOI] [PMC free article] [PubMed] [Google Scholar]
- 4. Goss PE, Chambers AF. Does tumour dormancy offer a therapeutic target? Nat Rev Cancer. 2010;10:871‐877. [DOI] [PubMed] [Google Scholar]
- 5. Zhang XH, Giuliano M, Trivedi MV, Schiff R, Osborne CK. Metastasis dormancy in estrogen receptor‐positive breast cancer. Clin Cancer Res. 2013;19:6389‐6397. [DOI] [PMC free article] [PubMed] [Google Scholar]
- 6. Richman J, Dowsett M. Beyond 5 years: enduring risk of recurrence in oestrogen receptor‐positive breast cancer. Nat Rev Clin Oncol. 2019;16:296‐311. [DOI] [PubMed] [Google Scholar]
- 7. Palomeras S, Ruiz‐Martinez S, Puig T. Targeting breast cancer stem cells to overcome treatment resistance. Molecules. 2018;23(9):2193. [DOI] [PMC free article] [PubMed] [Google Scholar]
- 8. Tachiwana H, Saitoh N. Nuclear long non‐coding RNAs as epigenetic regulators in cancer. Curr Med Chem. 2021(25):5098‐5109. [DOI] [PubMed] [Google Scholar]
- 9. Tachiwana H, Yamamoto T, Saitoh N. Gene regulation by non‐coding RNAs in the 3D genome architecture. Curr Opin Genet Dev. 2020;61:69‐74. [DOI] [PubMed] [Google Scholar]
- 10. Yamamoto T, Saitoh N. Non‐coding RNAs and chromatin domains. Curr Opin Cell Biol. 2019;58:26‐33. [DOI] [PubMed] [Google Scholar]
- 11. Tomita S, Abdalla MOA, Fujiwara S, et al. A cluster of noncoding RNAs activates the ESR1 locus during breast cancer adaptation. Nat Commun. 2015;6:6966. [DOI] [PMC free article] [PubMed] [Google Scholar]
- 12. Abdalla MOA, Yamamoto T, Maehara K, et al. The Eleanor ncRNAs activate the topological domain of the ESR1 locus to balance against apoptosis. Nat Commun. 2019;10:3778. [DOI] [PMC free article] [PubMed] [Google Scholar]
- 13. Fujita R, Yamamoto T, Arimura Y, et al. Nucleosome destabilization by nuclear non‐coding RNAs. Commun Biol. 2020;3:60. [DOI] [PMC free article] [PubMed] [Google Scholar]
- 14. Yamamoto T, Sakamoto C, Tachiwana H, et al. Endocrine therapy‐resistant breast cancer model cells are inhibited by soybean glyceollin I through Eleanor non‐coding RNA. Sci Rep. 2018;8:15202. [DOI] [PMC free article] [PubMed] [Google Scholar]
- 15. Yang YF, Liao YY, Yang M, Peng NF, Xie SR, Xie YF. Discordances in ER, PR and HER2 receptors between primary and recurrent/metastatic lesions and their impact on survival in breast cancer patients. Med Oncol. 2014;31:214. [DOI] [PubMed] [Google Scholar]
- 16. Zhao W, Sun L, Dong G, Wang X, Jia Y, Tong Z. Receptor conversion impacts outcomes of different molecular subtypes of primary breast cancer. Ther Adv Med Oncol. 2021;13:17588359211012982. [DOI] [PMC free article] [PubMed] [Google Scholar]
- 17. Freifeld ML, Feil PD, Bardin CW. The in vivo regulation of the progesterone "receptor" in guinea pig uterus: dependence on estrogen and progesterone. Steroids. 1974;23:93‐103. [DOI] [PubMed] [Google Scholar]
- 18. Jensen EV. Steroid hormones, receptors, and antagonists. Ann N Y Acad Sci. 1996;784:1‐17. [DOI] [PubMed] [Google Scholar]
- 19. Harrell JC, Dye WW, Allred DC, et al. Estrogen receptor positive breast cancer metastasis: altered hormonal sensitivity and tumor aggressiveness in lymphatic vessels and lymph nodes. Cancer Res. 2006;66:9308‐9315. [DOI] [PubMed] [Google Scholar]
- 20. McFarlane S, Coulter JA, Tibbits P, et al. CD44 increases the efficiency of distant metastasis of breast cancer. Oncotarget. 2015;6:11465‐11476. [DOI] [PMC free article] [PubMed] [Google Scholar]
- 21. Al‐Hajj M, Wicha MS, Benito‐Hernandez A, Morrison SJ, Clarke MF. Prospective identification of tumorigenic breast cancer cells. Proc Natl Acad Sci USA. 2003;100:3983‐3988. [DOI] [PMC free article] [PubMed] [Google Scholar]
- 22. Osisami M, Keller ET. Mechanisms of metastatic tumor dormancy. J Clin Med. 2013;2:136‐150. [DOI] [PMC free article] [PubMed] [Google Scholar]
- 23. De Angelis ML, Francescangeli F, Zeuner A. Breast cancer stem cells as drivers of tumor chemoresistance, dormancy and relapse: new challenges and therapeutic opportunities. Cancers. 2019;11(10):1569. [DOI] [PMC free article] [PubMed] [Google Scholar]
- 24. Mukherjee P, Gupta A, Chattopadhyay D, Chatterji U. Modulation of SOX2 expression delineates an end‐point for paclitaxel‐effectiveness in breast cancer stem cells. Sci Rep. 2017;7:9170. [DOI] [PMC free article] [PubMed] [Google Scholar]
- 25. Piva M, Domenici G, Iriondo O, et al. Sox2 promotes tamoxifen resistance in breast cancer cells. EMBO Mol Med. 2014;6:66‐79. [DOI] [PMC free article] [PubMed] [Google Scholar]
- 26. Uchiumi K, Tsuboi K, Sato N, et al. Cancer stem‐like properties of hormonal therapy‐resistant breast cancer cells. Breast Cancer. 2019;26:459‐470. [DOI] [PubMed] [Google Scholar]
- 27. Rodriguez D, Ramkairsingh M, Lin X, Kapoor A, Major P, Tang D. The Central Contributions of Breast Cancer Stem Cells in developing resistance to endocrine therapy in estrogen receptor (ER)‐positive breast cancer. Cancers. 2019;11(7):1028. [DOI] [PMC free article] [PubMed] [Google Scholar]
- 28. Santen RJ, Song RX, Zhang Z, et al. Long‐term estradiol deprivation in breast cancer cells up‐regulates growth factor signaling and enhances estrogen sensitivity. Endocr Relat Cancer. 2005;12(Suppl 1):S61‐S73. [DOI] [PubMed] [Google Scholar]
- 29. Nicholson RI, Hutcheson IR, Jones HE, et al. Growth factor signalling in endocrine and anti‐growth factor resistant breast cancer. Rev Endocr Metab Disord. 2007;8:241‐253. [DOI] [PubMed] [Google Scholar]
- 30. Acar A, Simões BM, Clarke RB, Brennan K. A role for notch signalling in breast cancer and endocrine resistance. Stem Cells Int. 2016;2016:2498764. [DOI] [PMC free article] [PubMed] [Google Scholar]
- 31. Domenici G, Aurrekoetxea‐Rodríguez I, Simões BM, et al. A Sox2‐Sox9 signalling axis maintains human breast luminal progenitor and breast cancer stem cells. Oncogene. 2019;38:3151‐3169. [DOI] [PMC free article] [PubMed] [Google Scholar]
- 32. Ramaswamy B, Lu Y, Teng KY, et al. Hedgehog signaling is a novel therapeutic target in tamoxifen‐resistant breast cancer aberrantly activated by PI3K/AKT pathway. Cancer Res. 2012;72:5048‐5059. [DOI] [PMC free article] [PubMed] [Google Scholar]
- 33. Johnston SR, Saccani‐Jotti G, Smith IE, et al. Changes in estrogen receptor, progesterone receptor, and pS2 expression in tamoxifen‐resistant human breast cancer. Cancer Res. 1995;55:3331‐3338. [PubMed] [Google Scholar]
- 34. Kabos P, Finlay‐Schultz J, Li C, et al. Patient‐derived luminal breast cancer xenografts retain hormone receptor heterogeneity and help define unique estrogen‐dependent gene signatures. Breast Cancer Res Treat. 2012;135:415‐432. [DOI] [PMC free article] [PubMed] [Google Scholar]
- 35. Gelsomino L, Panza S, Giordano C, et al. Mutations in the estrogen receptor alpha hormone binding domain promote stem cell phenotype through notch activation in breast cancer cell lines. Cancer Lett. 2018;428:12‐20. [DOI] [PubMed] [Google Scholar]
- 36. Toy W, Shen Y, Won H, et al. ESR1 ligand‐binding domain mutations in hormone‐resistant breast cancer. Nat Genet. 2013;45:1439‐1445. [DOI] [PMC free article] [PubMed] [Google Scholar]
- 37. Shin VY, Chen J, Cheuk IW, et al. Long non‐coding RNA NEAT1 confers oncogenic role in triple‐negative breast cancer through modulating chemoresistance and cancer stemness. Cell Death Dis. 2019;10:270. [DOI] [PMC free article] [PubMed] [Google Scholar]
- 38. Zheng A, Song X, Zhang L, et al. Long non‐coding RNA LUCAT1/miR‐5582‐3p/TCF7L2 axis regulates breast cancer stemness via Wnt/β‐catenin pathway. J Exp Clin Cancer Res. 2019;38:305. [DOI] [PMC free article] [PubMed] [Google Scholar]
- 39. Dowsett M, Sestak I, Regan MM, et al. Integration of clinical variables for the prediction of late distant recurrence in patients with estrogen receptor‐positive breast cancer treated with 5 years of endocrine therapy: CTS5. J Clin Oncol. 2018;36:1941‐1948. [DOI] [PMC free article] [PubMed] [Google Scholar]
- 40. Kim RS, Avivar‐Valderas A, Estrada Y, et al. Dormancy signatures and metastasis in estrogen receptor positive and negative breast cancer. PLoS One. 2012;7:e35569. [DOI] [PMC free article] [PubMed] [Google Scholar]
- 41. Tomita S, Abdalla MO, Fujiwara S, et al. Roles of long noncoding RNAs in chromosome domains. Wiley Interdiscip Rev. 2017;8(2):e1384. [DOI] [PubMed] [Google Scholar]
- 42. Olsson E, Honeth G, Bendahl PO, et al. CD44 isoforms are heterogeneously expressed in breast cancer and correlate with tumor subtypes and cancer stem cell markers. BMC Cancer. 2011;11:418. [DOI] [PMC free article] [PubMed] [Google Scholar]
- 43. Draffin JE, McFarlane S, Hill A, Johnston PG, Waugh DJ. CD44 potentiates the adherence of metastatic prostate and breast cancer cells to bone marrow endothelial cells. Cancer Res. 2004;64:5702‐5711. [DOI] [PubMed] [Google Scholar]
- 44. Chu JE, Xia Y, Chin‐Yee B, Goodale D, Croker AK, Allan AL. Lung‐derived factors mediate breast cancer cell migration through CD44 receptor‐ligand interactions in a novel ex vivo system for analysis of organ‐specific soluble proteins. Neoplasia. 2014;16:180‐191. [DOI] [PMC free article] [PubMed] [Google Scholar]
Associated Data
This section collects any data citations, data availability statements, or supplementary materials included in this article.
Supplementary Materials
Figure S1
Figure S2
Figure S3
Figure S4
Table S1‐S7
Appendix S1