

Abstract
Tropomyosin receptor kinase (TRK) inhibitors have demonstrated histology‐agnostic efficacy in patients with neurotrophic receptor tyrosine kinase (NTRK) gene fusion. Although responses to TRK inhibitors can be dramatic and durable, duration of response may eventually be limited by acquired resistance via several mechanisms, including resistance mutations such as NTRK1‐G595R. Repotrectinib is a second‐generation TRK inhibitor, which is active against NTRK1‐G595R. However, its efficacy against entrectinib‐resistant tumors has not been fully elucidated. In the present study, we established entrectinib‐resistant tumor cells (M3B) in a brain metastasis model inoculated with NTRK1‐rearranged KM12SM cells and examined the sensitivity of M3B cells to repotrectinib. While M3B cells harbored the NTRK1‐G595R mutation, they were unexpectedly resistant to repotrectinib. The resistance was due to extracellular signal–regulated kinase (ERK) reactivation partially mediated by epidermal growth factor receptor (EGFR) activation. We further demonstrate that the triplet combination of repotrectinib, EGFR inhibitor, and MEK inhibitor could sensitize M3B cells in vitro as well as in a brain metastasis model. These results indicate that resistant mutations, such as NTRK1‐G595R, and alternative pathway activation, such as ERK activation, could simultaneously occur in entrectinib‐resistant tumors, thereby causing resistance to second‐generation inhibitor repotrectinib. These findings highlight the importance of intensive examinations to identify resistance mechanisms and application of the appropriate combination treatment to circumvent the resistance.
Keywords: acquired resistance, neurotrophic receptor tyrosine kinase (NTRK) gene fusion, NTRK1‐G595R, repotrectinib, tropomyosin‐related kinase inhibitors
We explored the resistance mechanism to tropomyosin receptor kinase (TRK) inhibitors. We demonstrated that resistant mutations, such as NTRK1‐G595R, and alternative pathway activation, such as ERK activation, could simultaneously occur in entrectinib‐resistant tumors, thereby causing resistance to entrectinib as well as repotrectinib, and that this resistance could be surmounted by triple inhibitions to TRK, EGFR, and ERK.
Abbreviations
- AREG
amphiregulin
- DUSP
dual‐specificity phosphatases
- EGFR
epidermal growth factor receptor
- EMT
epithelial‐to‐mesenchymal transition
- ERK
extracellular signal–regulated kinase
- HB‐EGF
heparin‐binding EGF
- MAPK
mitogen‐activated protein kinase
- NTRK
neurotrophic receptor tyrosine kinase
- RT‐PCR
reverse‐transcription PCR
- siRNA
small interfering RNA
- TGF‐α
transforming growth factor‐α
- TKI
tyrosine kinase inhibitor
- TRK
tropomyosin receptor kinase
1. INTRODUCTION
Tropomyosin receptor kinase‐A (TRK‐A), TRK‐B, and TRK‐C are members of the tyrosine receptor kinase family, encoded by the NTRK1, NTRK2, and NTRK3 genes, respectively. 1 These tyrosine kinases are highly expressed in neuronal tissues and play crucial roles in the development and function of neurons by neurotrophin activation. 2 The rearrangement of NTRK1‐3 is recognized as an oncogenic driver. It has been identified in multiple tumor types, including mammary analogue secretory carcinoma, soft‐tissue sarcoma, glioma, thyroid cancer, salivary gland cancer, and colorectal cancer, although the incidence of cancer patients with NTRKs rearrangement is rare. 3 The first‐generation TRK inhibitors, namely entrectinib and larotrectinib, which exert favorable action against brain metastasis, have demonstrated remarkable clinical response in patients with NTRKs‐rearranged tumors. 4 , 5 Therefore, entrectinib and larotorectinib were approved by the Food and Drug Administration.
Regardless of the durable response to entrectinib and larotrectinib, their therapeutic activity is limited in time due to acquired resistance. Recent studies have described the acquisition of secondary NTRK mutations, following treatment with entrectinib, in the solvent front (NTRK1‐G595R, NTRK3‐G623R), xDFG (NTRK1‐G667C, NTRK3‐G696A), and gatekeeper (NTRK1‐F589L) regions. 3 , 6 Repotrectinib (TPX‐0005) is a second‐generation TRK inhibitor, which is instrumental in inhibiting the wild‐type (WT) ROS1, TRK‐A, B, C, and ALK, as well as other clinically relevant non–solvent‐front mutations, 7 in these targets. It is also active against brain metastasis. However, its efficacy against entrectinib‐resistant tumors has not been fully elucidated.
In the present study, we established entrectinib‐resistant tumor cells (M3B) in a brain metastasis model inoculated with NTRK1‐rearranged KM12SM cells and examined the sensitivity of M3B cells to repotrectinib. While M3B cells harbored the NTRK1‐G595R mutation, they were unexpectedly resistant to repotrectinib. This resistance was bestowed by extracellular signal–regulated kinase (ERK) reactivation, partially mediated by epidermal growth factor receptor (EGFR) activation. We further demonstrated that the triplet combination of repotrectinib, EGFR inhibitor, and MEK inhibitor could sensitize M3B cells in vitro as well as in a brain metastasis model.
2. MATERIALS AND METHODS
2.1. Cell lines, cell culture, and compounds
The human colon cancer cell line KM12SM was kindly gifted by Dr. I. J. Fidler (MD Anderson Cancer Center) to our group in 1999. KM12SM cells are a highly metastatic variant of KM12C cells, which present the TPM3‐NTRK1 gene rearrangement. 8 , 9 KM12SM cells were maintained and cultured in RPMI‐1640 medium (Thermo Fischer Scientific) with 10% FBS, penicillin (100 units/ml), and streptomycin (50 μg/ml), in a humidified CO2 incubator at 37°C. Ba/F3 transfected with wild‐type TPM3‐NTRK1 (Ba/F3_WT) and Ba/F3 transfected with TPM3‐NTRK1 G595R (Ba/F3_G595R) cells were gifted by Dr. R. Katayama (Japanese Foundation for Cancer Research). Ba/F3_WT, Ba/F3_G595R cells were cultured in DMEM containing 10% FBS. The EGFR‐mutant human lung adenocarcinoma cell line PC9 (del E746_A750) was purchased from RIKEN Cell Bank. Cells were regularly screened for mycoplasma using a MycoAlert mycoplasma detection kit (Lonza). Cell‐line authentication was performed by a short tandem repeat analysis in a laboratory at the National Institute of Biomedical Innovation (Osaka, Japan) in May 2015. Entrectinib, repotrectinib, GDC‐0941, trametinib and gefitinib were purchased from Selleck Chemicals.
2.2. The evaluation of genetic mutations
Whole‐genome sequencing (WGS) was performed on M3B cells, using the BGISEQ‐500 platform (BGI). RNA sequencing analysis of KM12SM cells was undertaken as previously described. 10 In KM12SM and M3B cells, Sanger sequencing and reverse‐transcription PCR (RT‐PCR) were used to confirm acquired mutations in NTRK1 fusion transcripts, and the NTRK1 fusion junction sites. Sanger sequencing analysis was carried out using the BigDye Terminator version 3.1 Cycle Sequencing Kit (Thermo Fisher Scientific) and ABI 3130 Genetic Analyzer (Thermo Fisher Scientific).
2.3. Cell viability assay
Cells (5 × 10³ cells/well) were seeded in 96‐well plates in 100 μl medium containing 10% FBS, incubated for 24 hours, and then treated with inhibitors for 72 hours. Cell viability was measured using MTT solution (Sigma) or a CCK‐8 kit (Dojindo Laboratories). Each experiment was performed at least thrice, with triplicate samples.
2.4. Antibodies and Western blotting
The primary antibodies used were phospho‐TRK‐A (Tyr490), EGFR, phospho‐EGFR (Tyr1068), AKT, phospho‐AKT (Ser473), ERK1/ERK, phospho‐ERK1/ERK2 (Thr202/Thr204), GAPDH (all from Cell Signaling Technology), AREG (Abcam), and TRK‐A (C‐14; Santa Cruz Biotechnology). Western blot analysis was performed as previously described. 11
2.5. RNA interference
Small interfering RNA (siRNA) oligonucleotides specific to NTRK1 (s9745, s9746), EGFR (s563, s565), AREG (s1548, s1549), and siRNA‐negative control were obtained from Thermo Fisher Scientific. Introduction of siRNA was performed using Lipofectamine RNAiMAX (Thermo Fisher Scientific), in accordance with the manufacturer's instructions. NTRK1, EGFR, and AREG knockdowns were confirmed by Western blot.
2.6. Measurement of EGFR ligands by enzyme‐linked immunosorbent assay
Tumor cell culture supernatants were measured for AREG (R&D), transforming growth factor (TGF)‐α, EGF, heparin‐binding EGF (HB‐EGF), and β‐cellulin (Abcam) using enzyme‐linked immunosorbent assay kits, according to the manufacturer's instructions.
2.7. Caspase 3/7 assay
Caspase 3/7 activation assays were performed using the Caspase‐Glo 3/7 Assay Kit (Promega), according to the manufacturer's instructions. The cells (5 × 10³ cells/well) were seeded in 96‐well plates and incubated for 24 hours. After the cells were treated with inhibitors for 24 hours, equal volume of Caspase‐Glo 3/7 reagent was added to each well. The plate was then incubated at room temperature for 1 hour, and the luminescence of each sample was measured with Fluoroskan Ascent (Thermo Fisher Scientific). Caspase 3/7 activity was assessed by the luminescence compensated by cell number.
2.8. Animal experiments
All animal experiments in the present study were performed in strict accordance with the recommendations in the Guide for the Care and Use of Laboratory Animals of the Ministry of Education, Culture, Sports, Science, and Technology, Japan. The protocol was approved by the Committee of Ethics of Experimental Animals and the Advanced Science Research Center, Kanazawa University, Kanazawa, Japan (approval number: AP‐081088). Five‐week‐old male hairless SCID (SHO) mice were purchased from CLEA and Charles River Laboratories Japan, respectively.
For the brain metastasis–mimicking model, tumor cells (1.5 × 10⁵/1.5 μl) were inoculated into the brain, as reported previously. 10 , 12 The development of tumors was tracked in live mice by repeated noninvasive optical imaging of tumor‐specific luciferase activity using the IVIS Lumina XR Imaging System (PerkinElmer). The intensity of the bioluminescence signal was analyzed using Living Image 4.0 software (PerkinElmer), as described previously. 13
2.9. Statistical analysis
Differences between groups were analyzed using one‐way ANOVA, a log rank Mantel‐Cox test, and Student's t test. All statistical analyses were undertaken using GraphPad Prism Ver. 6.0 (GraphPad Software, Inc.). For all analyses, a P value less than 0.05 was considered statistically significant.
3. RESULTS
3.1. Establishment of entrectinib‐resistant M3B cells with NTRK1‐G595R
In the first set of experiments, we induced entrectinib resistance in the microenvironment of the brain. We inoculated KM12SM/Eluc cells, which were transfected with a plasmid expressing the EGFP/Elec gene in KM12SM cells, into the brain of SHO mice. The mice were treated with entrectinib (30 mg/kg) daily after the confirmation of engraftment. The tumor luminescence increased during the subsequent treatment of entrectinib, indicating that the tumor cells had acquired resistance to entrectinib. We obtained brain tumor sections from the mice and cultured them in vitro; the resultant cells are referred to as M3B cells (Figure 1A).
FIGURE 1.
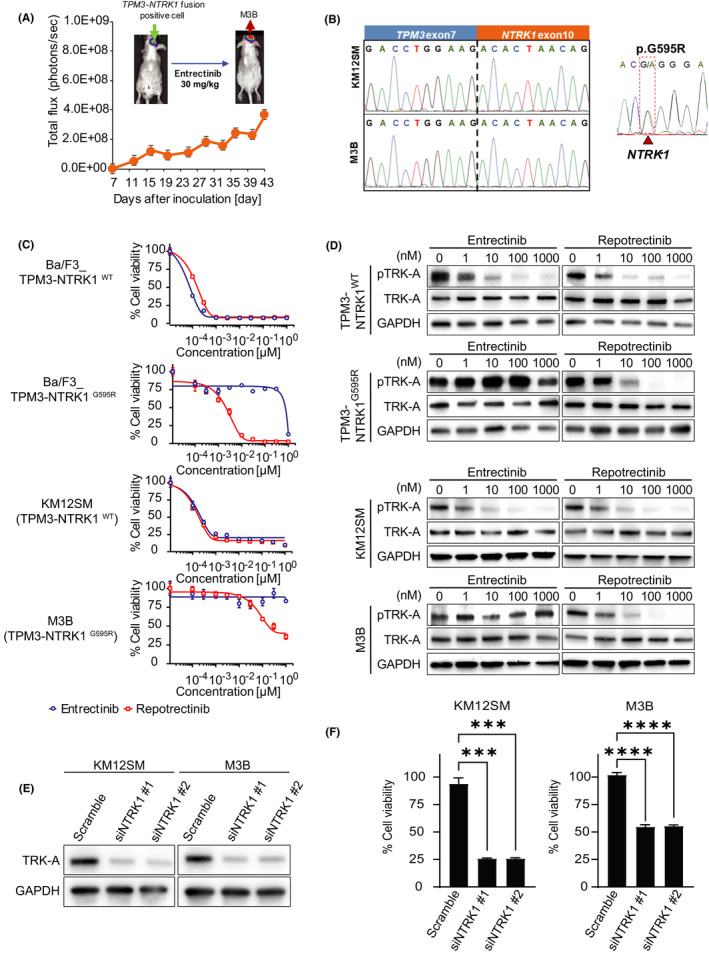
M3B cells with the NTRK1‐G595R mutation acquired repotrectinib resistance caused by a mechanism other than a TRK‐A–mediated axis. A, Establishment of M3B cells with acquired resistance to entrectinib in vivo. KM12SM/Elec cells were inoculated into the brain of SCID mice. The mice were treated daily with or without entrectinib (30 mg/kg). Mean ± SE of total flux is shown in the bottom plot. Thereafter, cells from the entrectinib‐treated brain tumor sections were harvested at the point the bioluminescence increased and were cultured in vitro. The expanded tumor cells were named M3B. B, Sanger sequencing of the RT‐PCR products revealed the identity of the fusion junctions in the TPM3‐NTRK1 fusion transcripts from KM12SM/Elec and M3B cells and products validating the acquired mutation p.G595R in the TPM3‐NTRK1 fusion transcripts only in M3B cells. C, Cells were treated with entrectinib or repotrectinib for 72 h. Cell viability was measured using an MTT assay (n = 6). D, Sensitivity to entrectinib and repotrectinib and Western blot analysis of lysates of these cells treated for 4 h with entrectinib or repotrectinib. E, Tumor cells were transfected with NTRK1‐specific siRNA (siNTRK1) or a scrambled control (scramble). After 48 h, the cell lysates were harvested and evaluated for protein expression by Western blotting. F, Tumor cells were treated with siNTRK or scramble. At 24 h post transfection, cells were treated with 1 μmol/L repotrectinib and cell viability was measured after 72 h using a CCK‐8 kit (n = 6). Error bars represent SEM. Three independent experiments were performed. ***p < 0.0005, ****p < 0.0001
We then performed next‐generation sequencing in the KM12SM and M3B cells. M3B cells did not have the functional gene mutations at major sites including EGFR. Both the KM12SM and M3B cells possessed the TPM3‐NTRK1 fusion gene, the presence of which was further confirmed by direct sequencing of cDNA (Figure 1B). Importantly, we found the mutation G595R in exon 14 of the NTRK1 gene from the M3B cells; this mutation was not present in the KM12SM cells. The NTRK1‐G595R mutations have been reported to induce robust resistance to entrectinib. 6 Therefore, we postulated that M3B cells acquire entrectinib resistance through the NTRK1‐G595R mutation.
3.2. M3B cells with the NTRK1‐G595R mutation were resistant to repotrectinib
We examined the effect of second‐generation TRK inhibitor repotrectinib by employing Ba/F3 models harboring wild‐type TPM3‐NTRK1 (Ba/F3_WT) and TPM3‐NTRK1 G595R (Ba/F3_G595R). Repotrectinib was reported to retain its potent activity against the NTRK1‐G595R mutation. 7 In the Ba/F3 models, both entrectinib and repotrectinib inhibited the viability of Ba/F3_WT cells. As anticipated, repotrectinib, but not entrectinib, inhibited the viability of Ba/F3_G595R cells (Figure 1C).
Next, we examined the sensitivity of native tumor cell lines harboring wild‐type TPM3‐NTRK1 (KM12SM) and TPM3‐NTRK1 G595R (M3B) to repotrectinib, compared with the sensitivity to entrectinib. As anticipated, KM12SM cells were sensitive to both entrectinib and repotrectinib. In addition, M3B cells harboring the NTRK1‐G595R mutation were discernibly resistant to entrectinib compared with KM12SM cells (Figure 1C; IC50 M3B, >1 μmol/L; IC50 KM12SM, 0.34 nmol/L). Surprisingly, the M3B cells were also resistant to repotrectinib (Figure 1C; IC50 M3B, 295.7 nmol/L; IC50 KM12SM, 1.2 nmol/L).
To evaluate the underlying resistance mechanism, we examined the effect of repotrectinib on the phosphorylation of TRK‐A by Western blot (Figure 1D). Repotrectinib inhibited TRK‐A phosphorylation in the M3B cells, to a similar extent as in the KM12SM cells and Ba/F3_G595R cells (Figure 1D). We next determined the effect of TRK‐A knockdown in M3B cells utilizing siRNAs specific for NTRK1. Two different siRNAs specific for NTRK1 successfully knocked down TRK‐A expression and hampered the viability of both KM12SM and M3B cells (Figure 1E,F). However, the effects of NTRK1‐specific siRNAs were discernibly weaker in the M3B cells than in the KM12SM cells. These results suggested that while the M3B cells were partially dependent on TRK‐A in terms of their viability, the M3B cells acquired repotrectinib resistance by a mechanism other than a TRK‐A–mediated axis.
3.3. EGFR activation partly involved in the resistance to repotrectinib in M3B cells
We sought to clarify the mechanism by which M3B cells acquire resistance to repotrectinib. Neither morphology nor the expression of epithelial‐to‐mesenchymal transition (EMT) markers, such as E‐cadherin and N‐cadherin, was remarkably changed between M3B and KM12SM cells (Figure S1A). To determine whether any alternative signaling pathway was activated, we evaluated 43 phospho‐kinases in M3B cells treated with or without repotrectinib for 48 hours using a phospho‐kinase antibody array. Interestingly, the rate of EGFR phosphorylation was slightly higher in the M3B cells than in the KM12SM cells; it was further stimulated by repotrectinib treatment in the M3B cells (Figure 2A). The MET phosphorylation rate was also higher in the M3B cells than in the KM12SM cells; however, the MET phosphorylation in the M3B cells was remarkably inhibited by repotrectinib treatment. Therefore, we focused on the EGFR‐mediated axis as an alternative pathway. Western blot confirmed that the rate of EGFR phosphorylation was increased in the M3B cells compared with the corresponding phosphorylation rate in the KM12SM cells (Figure 2B). Time kinetical analyses revealed that TRK‐A phosphorylation was continuously inhibited by repotrectinib until 48 hours, and phosphorylation of downstream molecules, such as AKT and ERK, was also inhibited until 48 hours in the KM12SM cells. Conversely, while TRK‐A phosphorylation was also continuously inhibited by repotrectinib until 48 hours in the M3B cells, EGFR phosphorylation was upregulated by repotrectinib in a time‐dependent manner. Inhibition of AKT phosphorylation by repotrectinib was weaker in the M3B cells than in the KM12SM cells. To examine the involvement of AKT on repotrectinib resistance, we also evaluated the effect of PI3K inhibitor, GDC‐0941, on the viability of KM12SM and M3B cells in the presence or absence of repotrectinib (Figure S2). GDC‐0941 did not affect the viability of KM12SM or M3B cells, irrespective of the presence of repotrectinib. These results indicate that AKT is not involved in repotrectinib resistance in our model. On the other hand, ERK phosphorylation in the M3B cells was significantly reactivated by 24 hours compared with the KM12SM cells (Figure 2C). These results indicated the activation of the EGFR/ERK pathway and the consequent induction of repotrectinib resistance in M3B cells.
FIGURE 2.
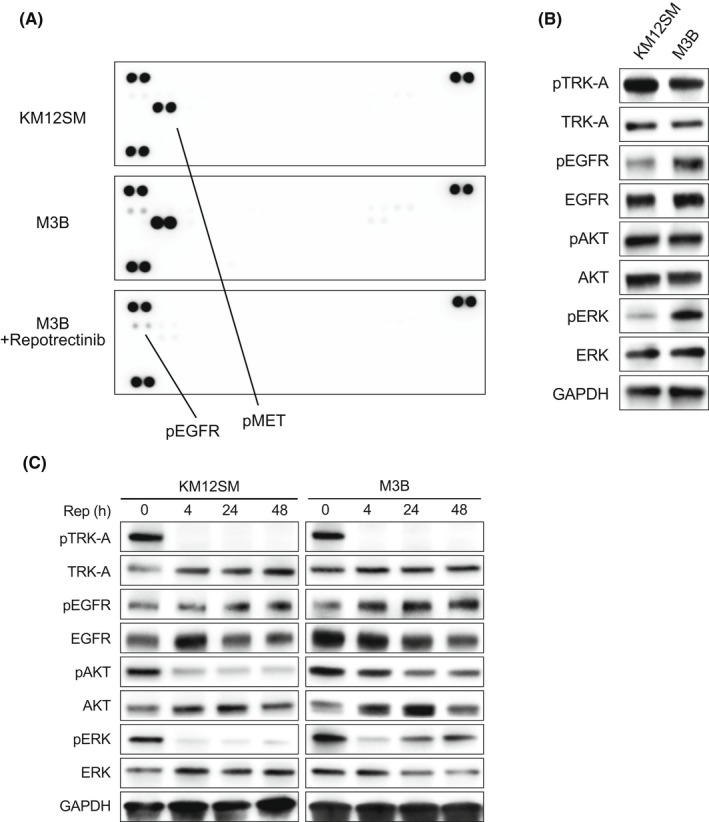
M3B cells demonstrated EGFR activation. A, Tumor cells were treated with or without 1 μmol/L repotrectinib for 48 h, and the cell lysates were analyzed for levels of phosphorylated RTKs using phospho‐receptor tyrosine kinase array. B, Untreated tumor cells were lysed, and the indicated proteins were detected by Western blotting. C, Tumor cells were treated with 1 μmol/L repotrectinib for the indicated time periods, and the harvested lysates were assessed by Western blotting
To show the involvement of EGFR activation in repotrectinib resistance, we evaluated the effect of EGFR knockdown in KM12SM and M3B cells. Knockdown of EGFR by specific siRNA successfully resulted in the concomitant abolition of protein expression (Figure 3A). This resulted in discernibly decreased viability of M3B cells, not KM12SM cells, in the presence of repotrectinib (Figure 3B), indicating that EGFR activation mediates repotrectinib resistance in M3B cells.
FIGURE 3.
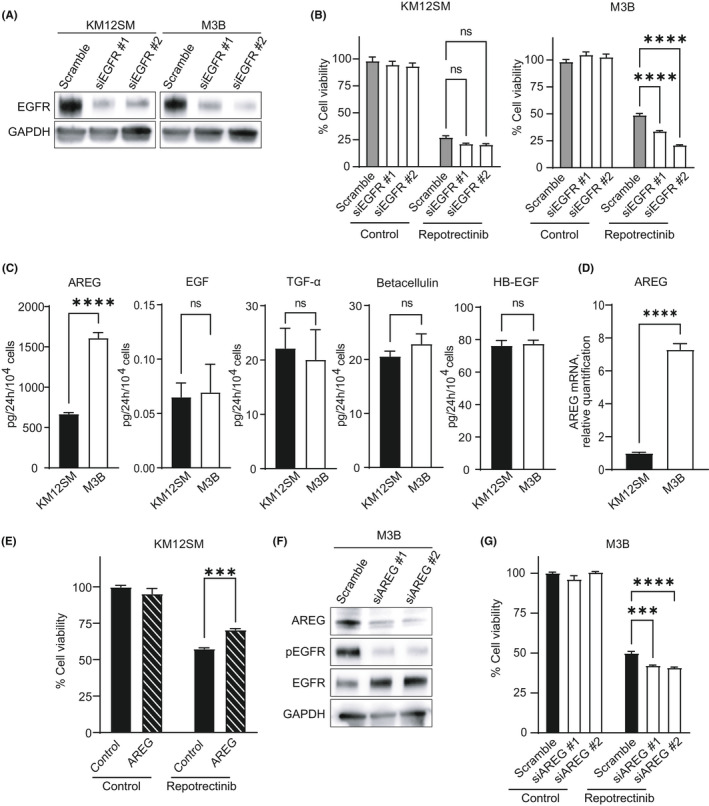
Amphiregulin(AREG)‐triggered EGFR activation partly involved in the resistance to repotrectinib in M3B cells. A, Tumor cells were transfected with EGFR‐specific siRNA (siEGFR) or a scrambled control (scramble). After 48 h, the cell lysates were harvested and evaluated for protein expression by Western blotting. B, Tumor cells were treated with siEGFR or scramble. At 24 h post transfection, cells were treated with 1 μmol/L repotrectinib, and cell viability was measured after 72 h using a CCK‐8 kit (n = 6). Error bars represent SEM. C, Tumor cells (1 × 10⁴ cells per 100 μl per well) were incubated for 24 h, and the culture supernatants were harvested. The levels of the EGFR ligands were measured by ELISA. D, The levels of AREG mRNA were measured by qPCR. E, KM12SM cells were incubated with or without AREG 100 ng/ml in the presence or absence of 1 nM repotrectinib for 72 h. F, M3B cells were transfected with AREG‐specific siRNA (siAREG) or a scrambled control (scramble). After 48 h, the cell lysates were harvested and evaluated for protein expression by Western blotting. G, M3B cells treated with siAREG or scramble were cultured in the presence or absence of 1 μM repotrectinib for 72 h. Thereafter, cell viability was determined using a CCK‐8 kit. Error bars represent SEM. ***p < 0.0005, ****p < 0.0001. ns, not significant
We next sought to assess the mechanism by which EGFR phosphorylation is augmented in M3B cells. EGFR phosphorylation can be induced by several mechanisms, including the EGFR‐activating mutations, EGFR amplification, and EGFR ligand overexpression. Next‐generation sequencing revealed that M3B did not contain EGFR‐activating mutations, such as exon 19 deletion and L858R mutation, or manifest EGFR amplification. Therefore, we next measured the production of EGFR ligands in the culture supernatant of M3B and KM12SM cells. Interestingly, the production of amphiregulin (AREG) was increased in M3B cells compared with the rate of production in KM12SM cells (Figure 3C). Upregulated expression of AREG in M3B cells was also confirmed at the mRNA level (Figure 3D). There was no significant difference in the production of other EGFR ligands, such as EGF, TGF‐α, betacellulin, or HB‐EGF, between M3B and KM12SM cells (Figure 3C).
To demonstrate the involvement of AREG in EGFR activation–triggered repotrectinib resistance, we evaluated the viability of KM12SM cells exposed to repotrectinib in the presence of AREG. Exogenously added recombinant AREG discernibly increased the viability of KM12SM cells exposed to repotrectinib (Figure 3E). Conversely, knockdown of AREG by specific siRNA successfully abrogated the protein expression of AREG and EGFR phosphorylation (Figure 3F), and thereby discernibly reduced the viability of M3B cells in the presence of repotrectinib (Figure 3G). These results indicated that M3B cells acquire resistance to repotrectinib, at least in part, by AREG‐triggered EGFR activation.
3.4. Combined use of EGFR inhibitors partially sensitized M3B cells to repotrectinib
We next examined the effects of EGFR inhibitors on AREG‐triggered repotrectinib resistance in vitro. Although EGFR tyrosine kinase inhibitors (TKIs) (gefitinib) inhibited the viability of PC‐9 cells with EGFR exon 19 deletion in a dose‐dependent manner, they had no effect on the viability of KM12SM or M3B cells (Figure 4A). However, the combined application of gefitinib at 1 µM partially sensitized M3B cells, not KM12SM cells, to repotrectinib (Figure 4B,C). Western blots further demonstrated that the combined use of repotrectinib and gefitinib was most efficacious in inhibiting the phosphorylation of EGFR and ERK (Figure 4D). The combination of repotrectinib and gefitinib significantly augmented caspase 3/7 activity in M3B cells (Figure 4E), indicating that this combination could induce apoptosis and inhibit the viability of M3B cells in vitro.
FIGURE 4.
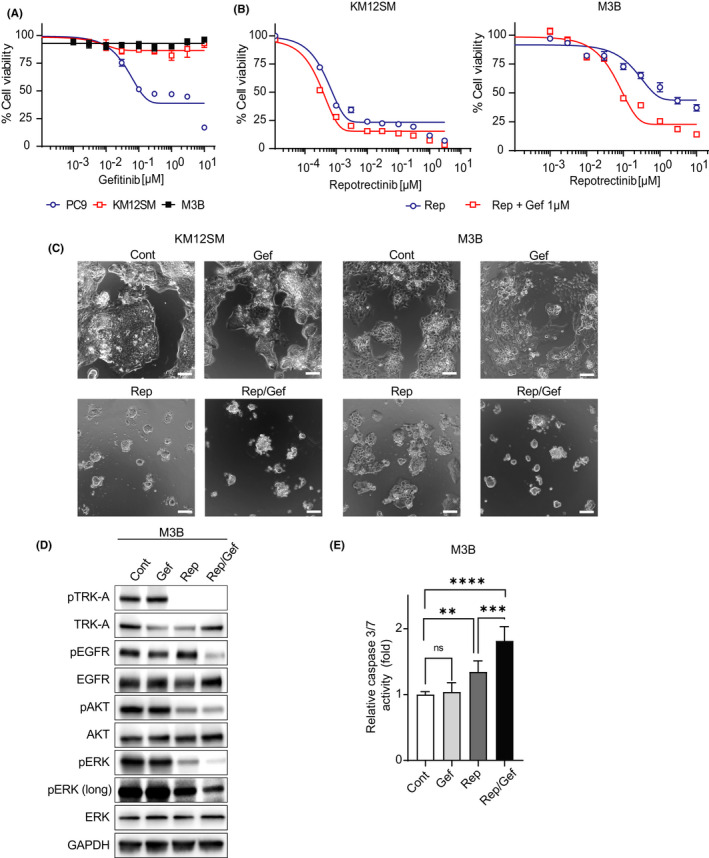
Combined use of EGFR inhibitor partially sensitized M3B cells to repotrectinib. A, Tumor cells were incubated with gefitinib (Gef) for 72 h. Thereafter, cell viability was determined by an MTT assay. Bars represent SD of quadruplicate cultures. B, Tumor cells were incubated with repotrectinib (Rep) with or without 1 μM Gef for 72 h. Thereafter, cell viability was determined by an MTT assay. Bars represent SD of quadruplicate cultures. C, Tumor cells were incubated with 1 μM Rep and/or 1 μM Gef for 72 h, and images were captured. Scale bar represents 100 μm. D, Tumor cells were treated with 1 μM Rep and/or 1 μM Gef for 48 h, and the lysates were probed with the indicated antibodies. E, Tumor cells were treated with 1 μM Rep and/or 1 μM Gef for 24 h, and caspase 3/7 activity was evaluated using Caspase‐Glo™ 3/7 Assay. **p < 0.005, ***p < 0.0005, ****p < 0.0001. Cont, control
3.5. MEK inhibitor combined with EGFR inhibitor sensitized M3B cells to repotrectinib in vitro
As the combined use of gefitinib sensitized M3B cells to repotrectinib only partially, we sought to identify more efficient treatment strategies to circumvent repotrectinib resistance of M3B cells. We focused on the time kinetics of phosphorylated ERK. ERK phosphorylation was reactivated in M3B cells treated with single‐agent repotrectinib (Figure 5A). Furthermore, it was efficiently inhibited by the combined use of repotrectinib and gefitinib, or by a combination of repotrectinib and trametinib, which is a MEK inhibitor. However, a basal level of ERK phosphorylation remained or was reactivated by 48 hours. Under these experimental conditions, the triple combination of repotrectinib, gefitinib, and trametinib most efficiently inhibited ERK phosphorylation. It also discernibly induced apoptosis, as evidenced by caspase 3 expression and caspase 3/7 activity, in M3B cells (Figure 5B,C). In the cell viability assay, single‐agent trametinib inhibited the viability of KM12SM and M3B cells to an equal extent in a dose‐dependent manner. Consistent with the results of the inhibition of phosphorylated ERK, the triple combination of trametinib at 10 nM, which marginally inhibited the viability of M3B cells, gefitinib at 1 µM, and repotrectinib most efficiently sensitized M3B cells in vitro (Figure 5D and Figure S3).
FIGURE 5.
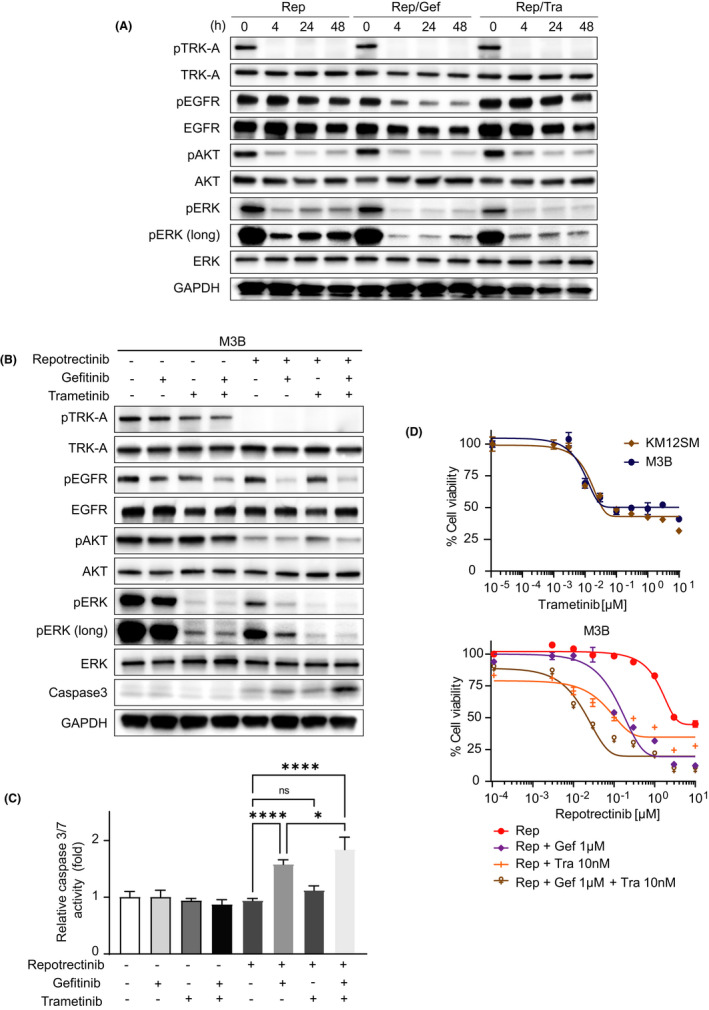
MEK inhibitor combined with EGFR inhibitor sensitized M3B cells to repotrectinib in vitro. A, B, M3B cells were incubated with Gef, Tra, the combination of Gef and Tra, Rep, the combination of Rep and Gef, the combination of Rep and Tra, and the combination of the three drugs. Each concentration using these drugs is as follows: Rep: 1 μM, Gef: 1 μM, Tra: 10 nM. After 48 h, the cell lysates were harvested and evaluated for protein expression by Western blotting. C, M3B cells were treated with each inhibitor used in B for 24 h, and caspase 3/7 activity was evaluated. D, (Above) KM12SM and M3B cells were incubated with trametinib for 72 h. (Below) M3B cells were incubated with Rep, Rep and Gef, Rep and Tra, and the combination of the three drugs for 72 h. Each concentration of the drugs used is as follows: Gef: 1 μM, Tra: 10 nM. Thereafter, cell viability was determined by an MTT assay. Bars represent SD of quadruplicate cultures. *p < 0.05, ****p < 0.0001. ns, not significant
3.6. Triple combination of trametinib, gefitinib, and repotrectinib prolonged the survival of mice in a brain tumor metastasis model with M3B cells
We next assessed the effect of combined treatment in a brain tumor metastasis model. M3B cells were inoculated in the brain of SHO mice. When the total flux in the brain lesions reached 1 × 10⁶ photons/s, we randomized the mice into four to five groups and commenced daily treatment. In the first set of experiments, we administered repotrectinib (15 mg/kg), gefitinib (25 mg/kg), or a combination of the two. In both the control and gefitinib groups, bioluminescence intensity increased rapidly (Figure 6A,B), and there was no statistically significant difference between these two groups (p = 0.117). However, single‐agent repotrectinib treatment discernibly impeded the increase in bioluminescence intensity and prolonged the survival time of the mice (Figure 6C). The combined use of repotrectinib and gefitinib suppressed the increase in bioluminescence intensity and prolonged the survival time compared with the corresponding parameters following single‐agent repotrectinib treatment; however, the difference was only marginal.
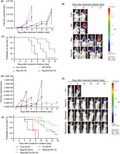
FIGURE 6.
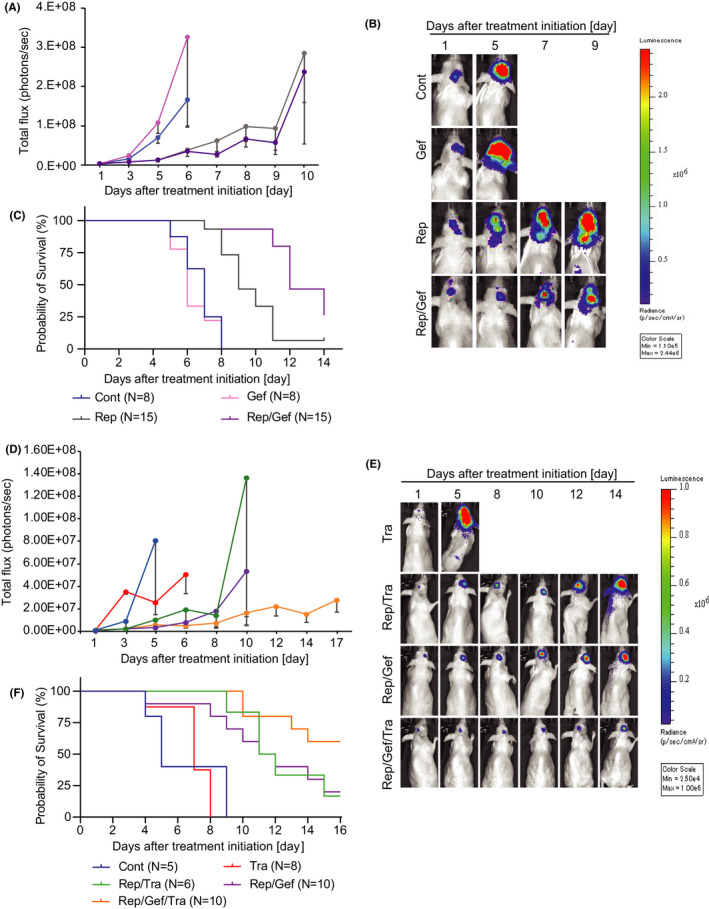
Effects of combination therapy in a brain metastasis model. A, M3B cells were inoculated into the brain of SHO mice (N = 46). The mice were randomized into four groups (control group [Cont], n = 8; gefitinib group [Gef], n = 8; repotrectinib group [Rep], n = 15; combination‐treatment group [Rep/Gef], n = 15) and treated daily with repotrectinib (15 mg/kg) and/or gefitinib (25 mg/kg). Bioluminescence was evaluated in a timely fashion after treatment initiation. Data shown are mean ± SE in the control and gefitinib groups. B, Representative luminescence images in the mice and fluorescence in the brain lesions are shown. C, Kaplan‐Meier survival curve comparing the effects of each inhibitor used in A and B on the survival of each arm using the same color scheme. D, M3B cells were inoculated into the brain of SHO mice (N = 39). The mice were randomized into five groups (Cont, n = 5; trametinib group [Tra], n = 8; Rep and Tra group [Rep/Tra], n = 6; Rep/Gef, n = 10; three‐drug combination–treatment group [Rep/Gef/Tra], n = 10) and treated daily with repotrectinib (15 mg/kg) and/or gefitinib (25 mg/kg) and/or trametinib (0.3 mg/kg). Bioluminescence was evaluated in a timely manner after treatment initiation. Data shown represent mean ± SE for each group. E, Representative luminescence images in the mice and fluorescence in the brain lesions are shown. F, Kaplan‐Meier survival curve comparing the effects of each inhibitor used in D and E on the survival of each arm using the same color scheme
Under these experimental conditions, we evaluated the effect of the triple treatment. In this set of experiments, we administered trametinib (0.3 mg/kg), repotrectinib (15 mg/kg), and trametinib (0.3 mg/kg); repotrectinib (15 mg/kg) and gefitinib (25 mg/kg); or triple treatment. Single‐agent tramentinib treatment did not affect the increase in bioluminescence intensity or mouse survival (Figure 6D). While repotrectinib combined with trametinib, as well as repotrectinib combined with gefitinib, similarly impeded the increase in bioluminescence intensity (p = 0.032) and prolonged mouse survival, the identical effects induced by the triple combination were most remarkable (Figure 6D–F). The loss of body weight was not remarkable even in the treatment groups, compared with the corresponding body weight loss in the control group (Figure S4), indicating the feasibility of this triple combination under our experimental conditions. These results indicated that the triple combination of repotrectinib, gefitinib, and trametinib may prove useful in treating resistance of M3B cells, as shown in a brain tumor metastasis model.
4. DISCUSSION
In the present study, we found that M3B cells with NTRK1‐G595R were resistant to repotrectinib, which was active against TRK‐A, harboring the G595R mutation. The resistance was partially caused by AREG‐triggered EGFR activation. While combined treatment with repotrectinib and EGFR inhibitor gefitinib partially sensitized M3B cells, ERK reactivation induced tolerance. Further combination treatment with MEK inhibitor trametinib, to inhibit ERK reactivation, remarkably sensitized M3B cells in vitro and prolonged mouse survival in a brain metastasis model.
The activation of alternative signaling pathways is one of the major mechanisms for targeted drug resistance. 14 , 15 A recent study reported that resistance to TRK inhibitors could be caused by mitogen‐activated protein kinase (MAPK, same as ERK) pathway activation due to KRAS mutations and MET gene amplification in NTRK‐rearranged colorectal cancer patients. 16 Our study demonstrated that entrectinib‐resistant M3B cells harbored the NTRK1‐G595R mutation and manifested ERK (MAPK) activation, partly mediated by AREG‐triggered EGFR activation. ERK activation is therefore considered to be the primary factor governing resistance, as alternative pathway activation, in M3B cells to repotrectinib, which is active against the NTRK1‐G595R mutation. These findings implied that various factors contributing to resistance could coexist with resistant mutations to new‐generation kinase inhibitors. We previously reported the coexistence of the EGFR‐T790M mutation and overexpression of hepatocyte growth factor, which may activate its receptor MET as an alternative signaling pathway, in EGFR‐TKI–resistant EGFR‐mutated lung cancer, 17 and the ALK‐L1196M mutation and EMT in ALK‐TKI–resistant ALK‐rearranged lung cancer, 11 as intratumor heterogeneity of resistance mechanisms. The findings of the present study demonstrated that heterogeneity of resistance mechanisms could occur, such as with the coexistence of the NTRK1‐G595R mutation and ERK activation in NTRKs‐rearranged tumors treated with TRK‐TKIs.
The MAPK/ERK pathway, comprising the RAS/RAF/MEK/ERK axis, plays a critical role in the survival and proliferation of various tumor cells. We found that ERK activation was caused partly by AREG‐triggered EGFR activation in M3B cells. Interestingly, discernible ERK reactivation occurred even in the presence of repotrectinib and EGFR inhibitor gefitinib within 48 hours. The mechanism by which ERK is reactivated remains unclear currently. There are several possibilities, including the activation of receptor tyrosine kinases other than EGFR, inhibition of negative regulators for the MAPK pathway such as Sprouty (SPRY) proteins and dual‐specificity phosphatases (DUSPs). 18 We aim to characterize the precise mechanism underlying ERK reactivation in future research.
The limitations of the present study are that only M3B cells were analyzed as TRK inhibitor–resistant NTRK1‐rearranged tumor cells. As NTRKs‐rearranged cancer is a rare disease, we were unable to obtain other native tumor cell lines with NTRK1 rearrangement. Similarly, we could not obtain clinical specimens from NTRKs‐rearranged cancer patients whose tumors acquired resistance to TRK inhibitors. Further experiments with other NTRK1‐rearranged tumor cells and clinical specimens are warranted in future to delineate the clinical relevance of our results obtained in the present study.
In conclusion, we demonstrated that resistant mutations, such as NTRK1‐G595R, and alternative pathway activation, such as ERK activation, could simultaneously occur in entrectinib‐resistant tumors and thereby cause resistance to second‐generation inhibitor repotrectinib. These findings underscore the necessity for intensive examinations to accurately characterize the governing resistance mechanism and implementing the appropriate combination treatment to surmount the resistance.
DISCLOSURE
Dr. Yano is an editorial board member of Cancer Science. All the other authors have declared no conflicts of interest.
Supporting information
Fig S1‐S4
ACKNOWLEDGEMENTS
We thank Dr. Ryohei Katayama (Japanese Foundation for Cancer Research) for kindly providing us with the Ba/F3_WT and Ba/F3_G595R cells.
Suzuki C, Nishiyama A, Arai S, et al. Inhibition of EGFR and MEK surmounts entrectinib resistance in a brain metastasis model of NTRK1‐rearranged tumor cells. Cancer Sci. 2022;113:2323–2335. doi: 10.1111/cas.15354
Funding information
This work was supported by JSPS KAKENHI Grant Number JP16H05308 (to S. Yano), the Project for Cancer Research and Therapeutic Evolution (P‐CREATE) from the Japan Agency for Medical Research and Development (AMED) Grant Number 16cm0106513h0001 (to S. Yano), research grants from Chugai Pharma and Takeda Pharma, and Extramural Collaborative Research Grant of Cancer Research Institute, Kanazawa University.
REFERENCES
- 1. Martin‐Zanca D, Hughes SH, Barbacid M. A human oncogene formed by the fusion of truncated tropomyosin and protein tyrosine kinase sequences. Nature. 1986;319(6056):743‐748. [DOI] [PubMed] [Google Scholar]
- 2. Nakagawara A. Trk receptor tyrosine kinases: a bridge between cancer and neural development. Cancer Lett. 2001;169(2):107‐114. [DOI] [PubMed] [Google Scholar]
- 3. Cocco E, Scaltriti M, Drilon A. NTRK fusion‐positive cancers and TRK inhibitor therapy. Nat Rev Clin Oncol. 2018;15(12):731‐747. [DOI] [PMC free article] [PubMed] [Google Scholar]
- 4. Drilon A, Laetsch TW, Kummar S, et al. Efficacy of larotrectinib in TRK fusion‐positive cancers in adults and children. N Engl J Med. 2018;378(8):731‐739. [DOI] [PMC free article] [PubMed] [Google Scholar]
- 5. Doebele RC, Drilon A, Paz‐Ares L, et al. Entrectinib in patients with advanced or metastatic NTRK fusion‐positive solid tumours: integrated analysis of three phase 1–2 trials. Lancet Oncol. 2020;21(2):271‐282. [DOI] [PMC free article] [PubMed] [Google Scholar]
- 6. Russo M, Misale S, Wei GE, et al. Acquired resistance to the TRK inhibitor entrectinib in colorectal cancer. Cancer Discov. 2016;6(1):36‐44. [DOI] [PubMed] [Google Scholar]
- 7. Drilon A, Ou S‐H, Cho BC, et al. Repotrectinib (TPX‐0005) is a next‐generation ROS1/TRK/ALK inhibitor that potently inhibits ROS1/TRK/ALK solvent‐ front mutations. Cancer Discov. 2018;8(10):1227‐1236. [DOI] [PubMed] [Google Scholar]
- 8. Zheng Z, Liebers M, Zhelyazkova B, et al. Anchored multiplex PCR for targeted next‐generation sequencing. Nat Med. 2014;20(12):1479‐1484. [DOI] [PubMed] [Google Scholar]
- 9. Morikawa K, Walker SM, Nakajima M, Pathak S, Jessup JM, Fidler IJ. Influence of organ environment on the growth, selection, and metastasis of human colon carcinoma cells in nude mice. Cancer Res. 1988;48(23):6863‐6871. [PubMed] [Google Scholar]
- 10. Nishiyama A, Yamada T, Kita K, et al. Foretinib overcomes entrectinib resistance associated with the NTRK1 G667C mutation in NTRK1 fusion‐positive tumor cells in a brain metastasis model. Clin Cancer Res. 2018;24(10):2357‐2369. [DOI] [PubMed] [Google Scholar]
- 11. Fukuda K, Takeuchi S, Arai S, et al. Epithelial‐to‐mesenchymal transition is a mechanism of ALK inhibitor resistance in lung cancer independent of ALK mutation status. Cancer Res. 2019;79(7):1658‐1670. [DOI] [PubMed] [Google Scholar]
- 12. Nanjo S, Nakagawa T, Takeuchi S, et al. In vivo imaging models of bone and brain metastases and pleural carcinomatosis with a novel human EML4‐ALK lung cancer cell line. Cancer Sci. 2015;106(3):244‐252. [DOI] [PMC free article] [PubMed] [Google Scholar]
- 13. Takeuchi S, Fukuda K, Arai S, et al. Organ‐specific efficacy of HSP90 inhibitor in multiple‐organ metastasis model of chemorefractory small cell lung cancer. Int J Cancer. 2016;138(5):1281‐1289. [DOI] [PubMed] [Google Scholar]
- 14. Niederst MJ, Engelman JA. Bypass mechanisms of resistance to receptor tyrosine kinase inhibition in lung cancer. Sci Signal. 2013;6(294):re6. [DOI] [PMC free article] [PubMed] [Google Scholar]
- 15. Nazarian R, Shi H, Wang QI, et al. Melanomas acquire resistance to B‐RAF(V600E) inhibition by RTK or N‐RAS upregulation. Nature. 2010;468(7326):973‐977. [DOI] [PMC free article] [PubMed] [Google Scholar]
- 16. Cocco E, Schram AM, Kulick A, et al. Resistance to TRK inhibition mediated by convergent MAPK pathway activation. Nat Med. 2019;25(9):1422‐1427. [DOI] [PMC free article] [PubMed] [Google Scholar]
- 17. Yano S, Yamada T, Takeuchi S, et al. Hepatocyte growth factor expression in EGFR mutant lung cancer with intrinsic and acquired resistance to tyrosine kinase inhibitors in a Japanese cohort. J Thorac Oncol. 2011;6(12):2011‐2017. [DOI] [PubMed] [Google Scholar]
- 18. Lake D, Corrêa SA, Müller J. Negative feedback regulation of the ERK1/2 MAPK pathway. Cell Mol Life Sci. 2016;73(23):4397‐4413. [DOI] [PMC free article] [PubMed] [Google Scholar]
Associated Data
This section collects any data citations, data availability statements, or supplementary materials included in this article.
Supplementary Materials
Fig S1‐S4