

Abstract
The tyrosine kinase inhibitor lenvatinib is used to treat advanced hepatocellular carcinoma (HCC). Ferroptosis is a type of cell death characterized by the iron‐dependent accumulation of lethal lipid reactive oxygen species (ROS). Nuclear factor erythroid‐derived 2‐like 2 (Nrf2) protects HCC cells against ferroptosis. However, the mechanism of lenvatinib‐induced cytotoxicity and the relationships between lenvatinib resistance and Nrf2 are unclear. Thus, we investigated the relationship between lenvatinib and ferroptosis and clarified the involvement of Nrf2 in lenvatinib‐induced cytotoxicity. Cell viability, lipid ROS levels, and protein expression were measured using Hep3B and HuH7 cells treated with lenvatinib or erastin. We examined these variables after silencing fibroblast growth factor receptor‐4 (FGFR4) or Nrf2 and overexpressing‐Nrf2. We immunohistochemically evaluated FGFR4 expression in recurrent lesions after resection and clarified the relationship between FGFR4 expression and lenvatinib efficacy. Lenvatinib suppressed system Xc − (xCT) and glutathione peroxidase 4 (GPX4) expression. Inhibition of the cystine import activity of xCT and GPX4 resulted in the accumulation of lipid ROS. Silencing‐FGFR4 suppressed xCT and GPX4 expression and increased lipid ROS levels. Nrf2‐silenced HCC cells displayed sensitivity to lenvatinib and high lipid ROS levels. In contrast, Nrf2‐overexpressing HCC cells displayed resistance to lenvatinib and low lipid ROS levels. The efficacy of lenvatinib was significantly lower in recurrent HCC lesions with low‐FGFR4 expression than in those with high‐FGFR4 expression. Patients with FGFR4‐positive HCC displayed significantly longer progression‐free survival than those with FGFR4‐negative HCC. Lenvatinib induced ferroptosis by inhibiting FGFR4. Nrf2 is involved in the sensitivity of HCC to lenvatinib.
Keywords: lipid ROS, liver cancer, nuclear factor erythroid‐derived 2‐like 2, oxidative stress, tyrosine kinase inhibitor
Regulation of ferroptosis by fibroblast growth factor receptor 4 (FGFR4) and nuclear factor erythroid‐derived 2‐like 2 (Nrf2) in hepatocellular carcinoma GPX4, glutathione peroxidase 4.
1. INTRODUCTION
Hepatocellular carcinoma (HCC) is a common cancer worldwide. 1 Hepatic resection has been established as a safe and effective treatment for patients with HCC. However, the number of patients who develop recurrence remains high. 2 , 3 With the evolution of science and technology, systemic therapies that improve the prognosis of patients with HCC have been developed. 4
Lenvatinib is an oral multikinase inhibitor that targets vascular endothelial growth factor (VEGF) receptors 1–3, fibroblast growth factor receptors 1–4 (FGFR1–4), platelet‐derived growth factor receptor, rearranged during transfection, and KIT. Lenvatinib is approved for the treatment of radioiodine‐refractory differentiated thyroid cancer, advanced renal cell carcinoma, and HCC. 5 , 6 , 7
Ferroptosis is morphologically, biochemically, and genetically distinct from apoptosis, various forms of necrosis, and autophagy. This process is characterized by the iron‐dependent accumulation of lethal lipid reactive oxygen species (ROS). 8 Previously, the induction of apoptosis was considered the main mechanism of cancer cell death for conventional treatments. However, studies have reported that inducing ferroptosis can significantly improve the efficacy of killing cancer cells, indicating that ferroptosis is another important process for cancer treatment. 9 , 10 Previous studies illustrated that sorafenib, a multikinase inhibitor, induced ferroptosis. 11 However, whether lenvatinib induces cell death via ferroptosis remains unknown.
Nuclear factor erythroid 2‐related factor 2 (Nrf2) and its repressor protein Kelch‐like ECH‐associated protein 1 (Keap1) are key transcription factors for processing intracellular ROS. 12 Keap1 suppresses Nrf2 at low levels via ubiquitination and degradation. However, under oxidative conditions, Nrf2 is phosphorylated, after which it translocates to the nucleus. 13 Consequently, Nrf2 binds to the conserved anti‐oxidant response element at the promoter regions of a battery of anti‐oxidative and cellular defense targets, such as NADPH quinone oxidoreductase 1 (NQO1), hemoxidase‐1, and ferritin heavy polypeptide 1, and then elicits robust anti‐toxification responses. 14 Nrf2 has been described as a crucial stress response mediator in solid tumors. 15 We previously reported that NQO1 activation was related to metastasis and poor prognosis by enabling HCC cells to overcome anoikis during anchorage‐independent culture. 16 Recent studies clearly demonstrated the central role of Nrf2 in protecting HCC cells against ferroptosis via the p62–Keap1–Nrf2 pathway, which upregulates multiple genes involved in iron and ROS metabolism. 11 It is unclear whether cell death induced by lenvatinib is associated with ferroptosis.
In this study, we investigated the relationship between lenvatinib and ferroptosis and clarified the involvement of Nrf2 in lenvatinib‐induced cytotoxicity.
2. MATERIALS AND METHODS
2.1. Cell culture and reagents
The HuH7 and Hep3B HCC cell lines were obtained from the American Type Culture Collection. HuH7 and Hep3B were cultured in DMEM containing 10% FBS, 100 IU/mL penicillin, and 100 μg/mL streptomycin at 37°C in an atmosphere of 10% CO2. A Lipid Peroxidation (MDA) Assay Kit (cat. ab118970, Abcam) was used in this study. Lenvatinib was obtained from Eisai (Tokyo, Japan). The Nrf2 inhibitors (ML385) (cat. SML1833) ferrostatin‐1 and erastin were purchased from Sigma‐Aldrich (cat. SML0583, St. Louis, MO, USA). Liproxstatin and a Caspase‐3/7 Fluorescence Assay Kit was purchased from Cayman‐Chemical (cat. 950455‐15‐9 and cat. 10009135, Ann Arbor, USA). Antibodies against phosphorylated Nrf2 (p‐Nrf2, at Ser40) (cat. ab76026), Nrf2 (cat. ab623252), and NQO1 (cat. ab34173) were purchased from Abcam. FGFR4 (cat. 8562S), system Xc − (xCT) (cat. 12691S), and glutathione peroxidase 4 (GPX4) (cat. 52455S) antibodies were obtained from Cell Signaling Technology. GAPDH antibody (cat. GTX100118) was obtained from Sigma‐Aldrich. Stealth RNAi (Thermo Fisher Scientific; GE Healthcare Dharmacon) was used to silence Nrf2 (cat. 1299001) and FGFR4 (cat. 4390824).
2.2. Generation of nuclear factor erythroid‐derived 2‐like 2 overexpressing cells and nuclear factor erythroid‐derived 2‐like 2‐ or fibroblast growth factor receptor‐4‐suppressed cells
An Nrf2 plasmid (cat. SC116283, NM_006164; Origene) was transfected into HCC cells using a jetPRIME kit (ct. 114, Polyplus Transfection). An empty vector (cat. PS100063, pCMV6‐Entry Vector; Origene) was also transfected into HCC cells as a control. Forty‐eight hours after transfection, HCC cells were selected with 500 μg/mL G418 (cat. A1720, Sigma). The limiting dilution method was used to isolate single‐cell clones from the transfected HCC cells. Selected single cells were placed in each well of the culture plates, and the clonal populations growing from each single cell were isolated. HCC cells were checked for mycoplasma infection before and after transfection, and all were negative.
We used FGFR4‐ or Nrf2‐silenced cells. Transient gene suppression was achieved in Hep3B and HuH7 cells using Stealth RNAi. Cells were prepared in complete growth medium without antibiotics to achieve a density of 50,000 cells/500 µL of medium (30%–50% confluent 24 h after plating). Then, reverse transfection was performed using 10 nM Stealth RNAi with Opti‐MEM I Reduced Serum Medium and Lipofectamine RNAiMAX for 24 h at 37°C in a CO2 incubator.
2.3. Western blotting
Samples were lysed in lysis buffer containing 50 mmol/L Tris HCl (pH 6.8) and 10% SDS, and the protein concentration for each sample was determined using a Bio‐Rad Protein Assay kit. Samples were heated at 95°C for 5 min and subjected to electrophoresis using SuperSep Ace 12% gels (Fujifilm) at 20 mA for 80 min. The Trans‐Blot Turbo Transfer System (Bio‐Rad) was used to transfer proteins onto a PVDF membrane (Bio‐Rad). Primary and secondary antibodies were diluted in iBind solution (Invitrogen). Primary antibodies were anti‐rabbit xCT (dilution 1:1000, Cell Signaling Technology), anti‐rabbit GPX4 (dilution 1:1000, Abcam), anti‐rabbit FGFR4 (dilution 1:1000, Cell Signaling Technology), anti‐rabbit Nrf2 antibody (dilution 1:1000, Abcam), anti‐rabbit p‐Nrf2 (dilution 1:1000, Abcam), anti‐rabbit NQO1 (dilution 1:1000, Abcam), anti‐mouse Lamin B1 (dilution 1:1000, Proteintech, Rosemont, IL, USA), and anti‐rabbit GAPDH (dilution 1:5000, GeneTex, CA, USA). The secondary antibodies were goat anti‐rabbit IgG H&L (1:5000; Abcam) and anti‐mouse IgG H&L (1:5000; Abcam). The membrane was incubated in iBind solution with primary and secondary antibodies. Each blot was incubated with Chemiluminescent HRP Antibody Detection Reagent (Denville Scientific) and imaged using Amersham Imager 600 (GE Healthcare) as previously reported.
2.4. Lipid peroxidation analysis
Lipid ROS analysis was performed using a Lipid Peroxidation (MDA) Assay Kit, which measures the lipid peroxidation marker malondialdehyde (MDA). Cells (2 × 10⁶/well) were seeded into a 10‐cm plate and incubated at 37°C for 24 h in 10% CO2. Cells were homogenized in lysis solution on ice using a homogenizer and centrifuged at 13,000 g for 10 min. The supernatant was collected, mixed with TBA reagent, incubated at 95℃ for 60 min, and subjected to an optical density measurement at 532 nm on a microplate reader (BioTek).
2.5. Caspase‐3/7 Fluorescence Assay
Caspases‐3/7 analysis was performed using a Caspasse‐3/7 Fluorescence Assay Kit. Cells (1 × 10⁴/well) were seeded into a 96‐well plate and incubated at 37°C for 24 h in 10% CO2. After treatment with lenvatinib, at 37°C for 24 h, the plates were centrifuged in a plate centrifuge at 800 g for five minutes. Finally, the cells were incubated with a caspase‐3/7 substrate solution at 37°C for 90 m. Caspase‐3/7 activity was determined based on the fluorescence intensity in cells using a microplate reader (BioTek).
2.6. Immunocytochemical staining
Immunocytochemical staining for FGFR4 and P‐Nrf2 was performed on 4‐μm formalin‐fixed, paraffin‐embedded sections. Sections were first deparaffinized and then blocked with 10% normal goat serum. The tissue sections were incubated with the following anti‐FGFR4 antibody (dilution 1:100, Cell Signaling Technology) and anti‐P‐Nrf2 (dilution 1:100, Abcam) at 4°C overnight. Stained slides were scanned using the NanoZoomer (Hamamatsu Photonics KK). Immunohistochemical data for FGFR4 staining and P‐Nrf2 was evaluated by two experienced researchers (N.I. and S.I.) who were blinded to the clinical status of the patients. The final assessments were achieved by consensus. Cancer cells with membranous staining for FGFR4 were considered positive staining. 17 The proportion of FGFR4‐positive cancer cells was estimated as the percentage of total cancer cells. The median percentage of FGFR4‐positive cells was 10%, and, thus, we used a cutoff of 10% for cancer cells. Cancer cells with nuclear staining for P‐Nrf2. Staining intensities was scored as 0 (negative), 1 (weak), 2 (moderate), or 3 (strong). The proportions of tumor cells positively stained was scored as 0 (0%), 1 (1–25%), 2 (26–50%), 3 (51–75%), or 4 (76–100%). The Q‐score was the sum of the intensity and proportion scores and ranged from 0 to 7. A Q‐score median was 3. A Q‐score ≤2 was considered negative, or reduced expression, and a Q‐score >2 was considered positive or preserved expression. 18 , 19
2.7. Assessment of cell viability
The cells were further treated with lenvatinib, erastin, or ML385 for 12–72 h. Cell viability was evaluated using a CellTiter‐Glo luminescent cell viability assay kit (cat. G7570, Promega), which determined cellular viability using ATP levels.
2.8. Tissue samples
We retrospectively examined 31 patients with recurrent HCC after resection between 2015 and 2019 at the Department of Surgery and Science, Graduate School of Medical Sciences, Kyushu University, Japan. All patients received a standard dose of lenvatinib therapy and continued until the emergence of disease progression or intolerable toxicities. The best objective response and disease progression were determined by computed tomography in accordance with modified Response Evaluation Criteria in Solid Tumors (RECIST). Computed tomography was performed every 1 to 3 months. We investigated the relationship between the expression of FGFR4 in resected specimens and the effect of lenvatinib in recurrent lesions. Informed consent was obtained from each patient, and the study protocol conformed to the ethical guidelines of the 1975 Declaration of Helsinki. This study was approved by the institutional review board of the Center of Clinical and Translational Research of Kyushu University (Number: 2020–745).
2.9. Clinical and laboratory evaluation
The following test values were collected from medical records within 1 month before surgery.
2.10. Statistical analysis
Statistical differences were determined using the Mann–Whitney test. P < 0.05 was considered statistically significant. All analyses were performed using JMP 15.0.0 software (SAS Institute).
3. RESULTS
3.1. Lenvatinib treatment induced cell death by ferroptosis via fibroblast growth factor receptor‐4
We examined the possibility that lenvatinib induces ferroptosis. We first examined the anti‐proliferative activity of lenvatinib against HuH7 and Hep3B cells. Lenvatinib inhibited the proliferation of HuH7 and Hep3B cells with IC50 values of 0.76 and 0.34 µM, respectively (Figure S1A, B).
Activation of the transmembrane transport protein xCT directly exerts its effects on the important anti‐oxidative stress molecules glutathione (GSH) and GPX4. Inhibition of the cystine import activity of xCT resulted in a reduction of GPX4 synthetic materials and the accumulation of lipid ROS. 8 , 20 The expression of xCT and GPX4 at the protein level was measured following lenvatinib treatment. Lenvatinib significantly altered xCT and GPX4 expression (Figure 1A). Ferrostatin‐1 is an aromatic amine that specifically binds with lipid ROS and protects cells against lipid peroxidation. 21 The occurrence and development of ferroptosis by inducers such as erastin resulted in decreased GPX4 activity directly through binding with GPX4 and indirectly through glutathione deprivation. 8 Lipid peroxidation is a key event in ferroptosis. 22 We measured the end‐products of lipid peroxidation, such as MDA. We found that lenvatinib and erastin induced lipid ROS accumulation in HuH7 and Hep3B cells. Moreover, ferrostatin‐1 inhibited the induction of ferroptosis by MDA (Figure 1B). Next, we investigated the viability of cell lines treated with lenvatinib and ferrostatin‐1. Ferrostatin‐1 (10 µM) inhibited cell death induced by lenvatinib and erastin in HuH7 and Hep3B cells (Figure 1B). We investigated the inhibition of lenvatinib cell death by the ferroptosis inhibitor liproxstatin. Liproxstatin (1 µM) inhibited cell death induced by lenvatinib in HuH7 and Hep3B cells (Figure S2A, B). The activation of caspase‐3 and ‐7 is the functional end‐point of the apoptotic cascade. Next, we checked caspase‐3/7 activity in the supernatant of cells treated with lenvatinib. The caspases‐3/7 activity did not change in HuH7 and Hep3B cells treated with lenvatinib (Figure S3A, B).
FIGURE 1.
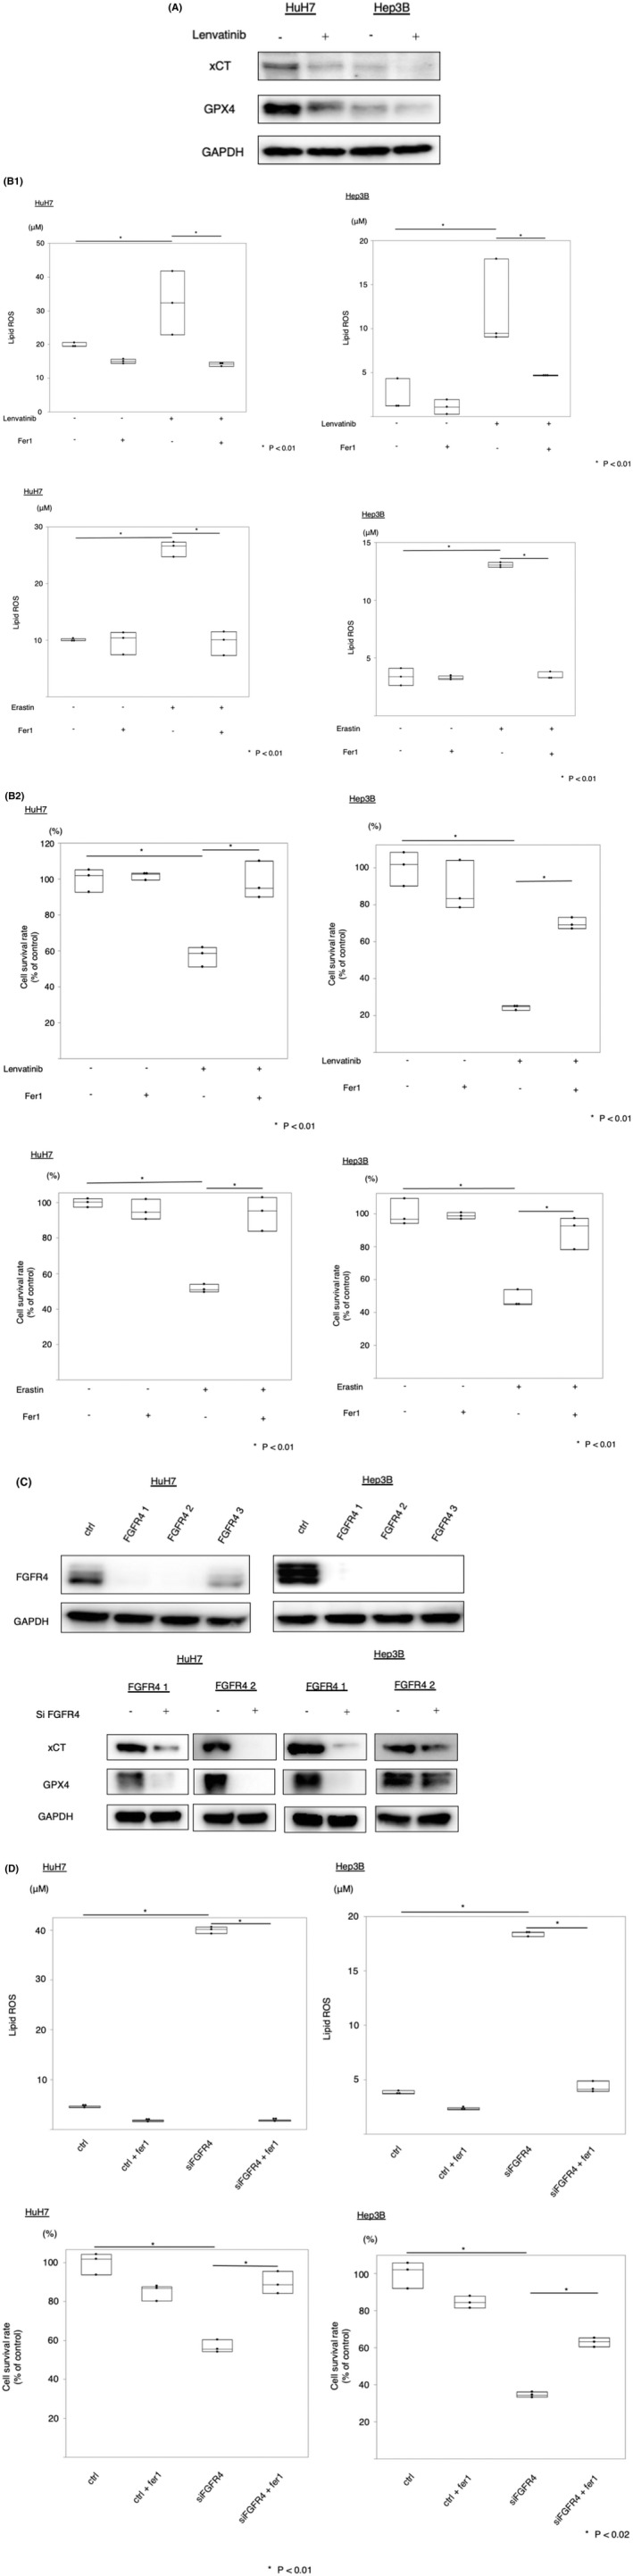
Effects of lenvatinib and erastin on ferroptosis pathways and cell survival lenvatinib (HuH7: 0.8 µM, Hep3B: 0.4 µM) and erastin (10 µM) inhibited the expression of system Xc − (xCT) and glutathione peroxidase 4 (GPX4) (A), increased lipid reactive oxygen species (ROS) accumulation, and suppressed cell survival (B). Si‐fibroblast growth factor receptor 4 (FGFR4) inhibited the expression of xCT and GPX4 (C), increased lipid ROS accumulation, and suppressed cell survival (D). *P < 0.01 versus the control group. Ctrl, control; fer1, ferrostatin‐1
Lenvatinib is a multikinase inhibitor, and thus, we next examined whether FGFR4 inhibition induced ferroptosis via the accumulation of lipid ROS in HuH7 and Hep3B cells. We silenced FGFR4 protein expression using the RNA interference technique. The expression of xCT and GPX4 protein was measured after silencing FGFR4. The protein expression of xCT and GPX4 was suppressed in FGFR4‐silenced cells (Figure 1C). Lipid ROS levels were higher in FGFR4‐silenced cells in PLC as well as HuH7 and Hep3B (Figure S4). Silencing of FGFR4 resulted in decreased viability in HuH7 and Hep3B cells, but the administration of ferrostatin‐1 (10 µM), which prevented the accumulation of lipid ROS, restored cell viability (Figures 1D and S5). Next, we examined the anti‐tumor effect of lenvatinib in the absence of FGFR4 in Hep3B and HuH7. In cells that suppressed FGFR4, the effect of lenvatinib was reduced. In vitro, the effect of lenvatinib depended on FGFR4 (Figure S6A, B). Taken together, FGFR4 silencing suppressed xCT expression, induced lipid ROS accumulation, and caused ferroptosis. Therefore, lenvatinib may induce ferroptosis by suppressing FGFR4.
3.2. Increased susceptibility to lenvatinib after silencing endogenous nuclear factor erythroid‐derived 2‐like 2 in hepatocellular carcinoma cells
To investigate whether silencing of Nrf2 contributes to the sensitivity to lenvatinib‐induced ferroptosis, we silenced Nrf2 protein expression using the RNA interference technique. NQO‐1 is a downstream enzyme in the Nrf2 signaling pathway. Nrf2, p‐Nrf2, and NQO‐1 protein expression was significantly reduced after Nrf2 silencing (Figure 2A). We investigated lipid ROS levels following Nrf2 silencing in HuH7 and Hep3B cells treated with lenvatinib and ferrostatin‐1. Lipid ROS levels were higher in Nrf2‐silenced cells treated with lenvatinib than in lenvatinib‐exposed cells transfected with control siRNA. Ferrostatin‐1 particularly reversed lenvatinib‐induced lipid ROS accumulation following Nrf2 silencing (Figure 2B). We next examined the viability of HuH7 and Hep3B cells following Nrf2 silencing and treatment with lenvatinib and ferrostatin‐1. Ferrostatin‐1 (10 µM) significantly reversed lenvatinib‐induced cell death in Nrf2‐silenced cells (Figure 2B). Nrf2‐silenced HuH7 and Hep3B cells exhibited increased sensitivity to lenvatinib (Figure 2B). We examined the effects of ML385 (an inhibitor of Nrf2) on lenvatinib efficacy in HCC cells. ML385 inhibited the protein expression of Nrf2, p‐Nrf2, and NQO‐1 (Figure 2C). In the CellTiter‐Glo assay, the cells were treated with 6 µM ML385, 0.8 µM lenvatinib, or both for 12, 24, or 48 h. Compared to the effects of treatment with either ML385 or lenvatinib alone, the combined treatment resulted in obviously stronger growth inhibition (Figure 2C). These results indicated that Nrf2 silencing confers sensitivity to lenvatinib‐induced ferroptosis.
FIGURE 2.

Suppression of lenvatinib‐induced ferroptosis by nuclear factor erythroid‐derived 2‐like 2 (Nrf2) in hepatocellular carcinoma (HCC) cells. (A) HCC cells were transfected with siRNA (Nrf2 and control), and Nrf2, phosphorylated Nrf2 (p‐Nrf2), and NADPH quinone oxidoreductase 1 (NQO1) protein levels were assayed via immunoblotting. (B) HCC cells were transfected with siRNA (Nrf2 and control) and treated with lenvatinib (HuH7: 0.8 µM, Hep3B: 0.4 µM). Malondialdehyde (MDA) levels and cell viability were analyzed. The data are representative of at least three independent experiments. *P < 0.01 versus the control group. (C) HCC cells were treated with ML385, and Nrf2, p‐Nrf2, and NQO1 protein levels were assayed via immunoblotting. HCC cells were treated with ML385 and lenvatinib (HuH7: 0.8 µM, Hep3B: 0.4 µM). Cell viability was analyzed using the CellTiter‐Glo assay. Hep3B and HuH7 cells were transfected with empty vector or Nrf2 plasmids, and Nrf2 protein levels were assayed via immunoblotting. The transfected cells were treated with lenvatinib (HuH7: 0.8 µM, Hep3B: 0.4 µM) or ferrostatin‐1 (fer1, 10 µM). MDA levels were analyzed. Cell viability was analyzed using the CellTiter‐Glo assay. (D) HCC cells transfected with Nrf2 overexpression or control plasmids were treated with lenvatinib (HuH7: 0.8 µM, Hep3B: 0.4 µM). Viability was analyzed using the CellTiter‐Glo assay. Len, lenvatinib
3.3. Overexpression of nuclear factor erythroid‐derived 2‐like 2 significantly enhanced resistance to lenvatinib
To examine whether Nrf2 overexpression influences lenvatinib resistance, Nrf2 plasmid‐transfected HuH7 and Hep3B cells were established. Empty vector‐transfected HuH7 and Hep3B cells were also established as controls. Nrf2 protein expression was examined in HuH7 and Hep3B cells via western blotting, which confirmed that Nrf2 plasmid‐transfected HuH7 and Hep3B cells stably expressed Nrf2 (Figure 2D). We investigated lipid ROS levels in Nrf2‐overexpressing HuH7 and Hep3B cells treated with lenvatinib and ferrostatin‐1. Lipid ROS levels were lower in Nrf2‐overexpressing cells treated with lenvatinib than in mock‐transfected cells treated with the drug (Figure 2D). Ferrostatin‐1 (10 µM) significantly reversed lenvatinib‐induced cytotoxicity in Nrf2‐overexpressing cells (Figure 2D). The viability of cells treated with lenvatinib was measured using the CellTiter‐Glo assay. Nrf2‐overexpressing cells treated with lenvatinib displayed greater survival than control cells (Figure 2D).
3.4. Fibroblast growth factor receptor‐4 and nuclear factor erythroid‐derived 2‐like 2 expression are related to lenvatinib therapeutic efficacy in patients
Next, we examined whether FGFR4 protein expression is related to the efficacy of lenvatinib. Patient characteristics are shown in Tables 1 and 2. Table 1 shows clinical data at the time of surgery, and Table 2 shows clinical data at the time of treatment of lenvatinib. As presented in Figure S7A, B, the cancer cells exhibited positive FGFR4 staining. Figure 3A illustrates the relationship between FGFR4 expression and lenvatinib resistance in 31 patients. These 31 patients included 16 patients with FGFR4‐positive lesions and 15 patients with FGFR4‐negative lesions. Among the 16 FGFR4‐positive patients, 11 (68.8%) displayed partial or complete responses to lenvatinib compared to 3 of 15 3 (20.0%) FGFR4‐negative patients (P = 0.0113). The patients with positive FGFR4 expression in cancer cells had significantly longer progression‐free survival than those with negative FGFR4 expression (log‐rank P = 0.0052, Figure 3B). We investigated protein expression of P‐Nrf2 associated with efficiency of lenvatinib. As presented in Figure S8A, B, the cancer cells exhibited positive P‐Nrf2 staining. Figure S8C illustrates the relationship between P‐Nrf2 expression and lenvatinib resistance in 31 patients. These 31 patients included 18 patients with P‐Nrf2‐positive lesions and 13 patients with P‐Nrf2‐negative lesions. Among the 18 P‐Nrf2‐positive patients, 5 (27.8%) displayed partial or complete responses to lenvatinib, versus 9 of 13 (69.2%) P‐Nrf2‐negative patients (P = 0.0205). The patients with positive P‐Nrf2 expression in cancer cells had significantly shorter progression‐free survival than those with negative P‐Nrf2 expression (log‐rank P = 0.0124, Figure S8D).
TABLE 1.
Association between FGFR4 expression and patient clinicopathological factors at the time for hepatectomy
| Variable | FGFR4 positive (n = 16) | FGFR4 negative (n = 15) | P‐value |
|---|---|---|---|
| Age (years) | 70 (69–75) | 68 (63–76) | 0.2306 |
| Sex, male/female | 11/5 | 10/5 | 0.2268 |
| BMI (kg/m2) | 23.7 (22.5–26.0) | 22.1 (20.7–25.7) | 0.3626 |
| HBs‐Ag positive | 5 (31.3%) | 4 (26.7%) | 0.7786 |
| HCV‐Ab positive | 3 (20.0%) | 5 (31.3%) | 0.4723 |
| Albumin (g/dL) | 3.9 (3.6–4.4) | 3.8 (3.3–4.3) | 0.2547 |
| AFP (ng/mL) | 21.0 (5.1–283.3) | 12.9 (3.8–50.9) | 0.2535 |
| DCP (mAU/mL) | 158 (61.8–12991) | 53 (30.0–788.0) | 0.4727 |
| Tumor size (cm) | 4.0 (1.3–7.9) | 2.4 (1.4–5.0) | 0.8050 |
| Solitary/Multiple | 7/9 | 3/12 | 0.0601 |
| Poorly differentiation | 9 (56.3%) | 4 (26.7%) | 0.0921 |
| Microscopic vascular invasion | 6 (37.5%) | 3 (20.0%) | 0.2796 |
| Microscopic intrahepatic metastasis | 8 (50.0%) | 3 (20.0%) | 0.0768 |
| Child‐pugh score A/B/C | 16/0/0 | 15/0/0 | 0.2936 |
| BCLC staging 0/A/B/C/D | 2/13/1/0/0 | 3/11/1/0/0 | 0.8454 |
The data are presented as n (%) or median (interquartile).
Abbreviations: AFP, alpha‐fetoprotein; BCLC: Barcelona Clinic Liver Cancer; BMI, body mass index; DCP, des‐gamma‐carboxyprothrombin; HBs‐Ag, hepatitis B surface antigen; HCV‐Ab, hepatitis C virus antibody.
TABLE 2.
Association between FGFR4 expression and patient clinicopathological factors at the time for lenvatinib treatment
| Variable | FGFR4 positive (n = 16) | FGFR4 negative (n = 15) | P‐value |
|---|---|---|---|
| Age (years) | 72 (70–77) | 69 (65–78) | 0.2160 |
| Sex, male/female | 11/5 | 10/5 | 0.2268 |
| BMI (kg/m2) | 20.9 (18.9–24.3) | 22.3 (21.4–24.2) | 0.2885 |
| HBs‐Ag positive | 5 (31.3%) | 4 (26.7%) | 0.7786 |
| HCV‐Ab positive | 3 (20.0%) | 5 (31.3%) | 0.4723 |
| Albumin (g/dl) | 4.0 (3.7–4.4) | 3.9 (3.4–4.0) | 0.2942 |
| AFP (ng/mL) | 4.0 (2.2–203.6) | 23.4 (3.2–152.0) | 0.2969 |
| DCP (mAU/mL) | 46 (23.0–1745) | 179 (42.0–508.0) | 0.5250 |
| Tumor size (cm) | 2.0 (1.5–3.0) | 2.0 (1.4–3.3) | 0.4904 |
| Solitary/Multiple | 7/9 | 4/11 | 0.3181 |
| Child–Pugh score A/B/C | 16/0/0 | 15/0/0 | 0.2936 |
| BCLC staging 0/A/B/C/D | 0/3/6/7/0 | 0/4/5/5/0 | 0.8042 |
The data are presented as n (%) or median (interquartile).
Abbreviations: AFP, alpha‐fetoprotein; BCLC, Barcelona Clinic Liver Cancer; BMI, body mass index; DCP, des‐gamma‐carboxyprothrombin; HBs‐Ag, hepatitis B surface antigen; HCV‐Ab, hepatitis C virus antibody.
FIGURE 3.
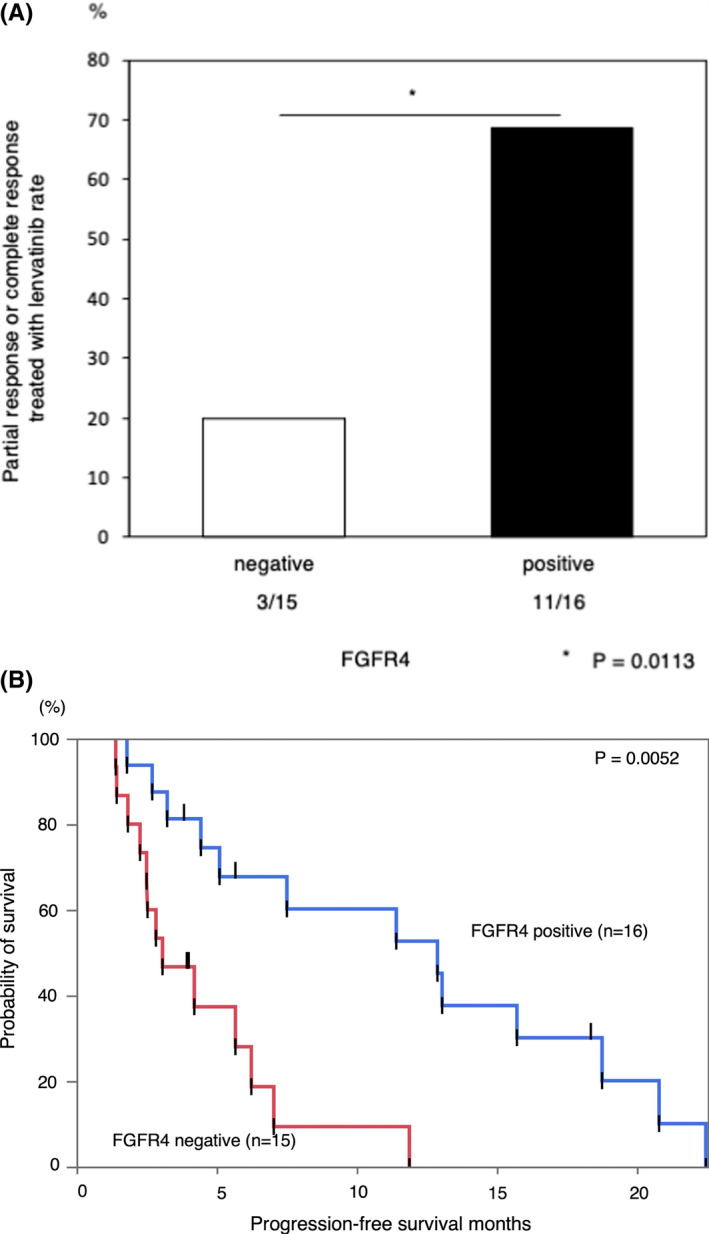
The correlation between the efficacy of lenvatinib and fibroblast growth factor receptor 4 (FGFR4) expression in patients with hepatocellular carcinoma. Correlation between FGFR4 expression and sensitivity to lenvatinib. Progression‐free survival in patients with FGFR4‐positive and FGFR4‐negative lesions
4. DISCUSSION
In the present study, we analyzed the cytotoxicity of lenvatinib in HCC cells. We demonstrated that lenvatinib suppressed xCT expression and induced lipid ROS accumulation through FGFR4 inhibition. The accumulated lipid ROS induced ferroptosis in HCC cells. Additionally, activated Nrf2 suppressed ferroptosis induced by lenvatinib (Figure 4). We demonstrated that the inhibition of activated Nrf2 could sensitize HCC cells to lenvatinib. To the best of our knowledge, this is the first study to demonstrate the interaction between lenvatinib and ferroptosis and its regulation by Nrf2.
FIGURE 4.
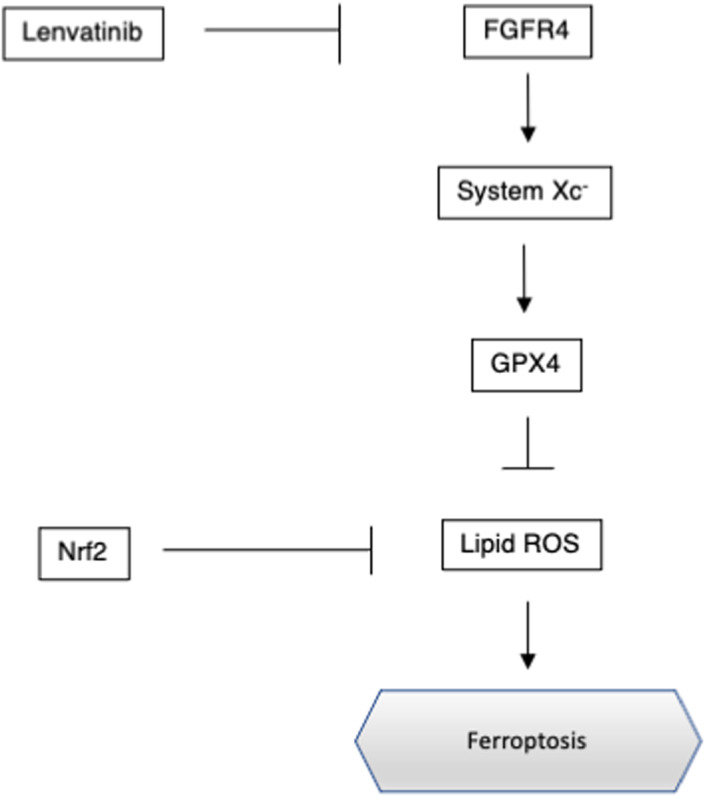
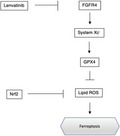
Regulation of ferroptosis by fibroblast growth factor receptor 4 (FGFR4) and nuclear factor erythroid‐derived 2‐like 2 (Nrf2) in hepatocellular carcinoma. GPX4, glutathione peroxidase 4
Ferroptosis is a regulated cell death pathway with unique morphological, biochemical, and genetic hallmarks, and it is associated with xCT and GPX4 signaling. 8 Activation of the transmembrane transport protein xCT directly affects the functions of the anti‐oxidative stress molecule GSH at the level of synthesis. 23 GPX4 uses GSH as a basic co‐factor to catalyze the reduction of hydrogen peroxide and organic peroxides, especially lipid peroxides, to water and the corresponding alcohol. 24 Inactivation of GPX4 leads to the accumulation of lipid peroxides, which further leads to an increase in ROS levels. The accumulation of lipid ROS causes ferroptosis. 25 Erastin inhibits xCT and depletes GSH, finally inactivating GPX4. Therefore, erastin induces ferroptosis. 8 In the present study, lenvatinib inhibited xCT and inactivated GPX4 by inhibiting FGFR4. We also observed lipid ROS accumulation in HCC cells treated with lenvatinib. Lipid ROS accumulation was associated with the inhibition of xCT by lenvatinib.
Our data further demonstrated that FGFR4 regulated xCT, and this regulation was associated with ferroptosis. Yi et al. reported that activating mutations of phosphatidylinositol 3‐kinase (PI3K) conferred ferroptosis resistance in cancer cells and that inhibition of the PI3K–AKT–mechanistic target of rapamycin signaling axis sensitized cancer cells to ferroptosis induction. 26 Some reports have shown that activated FGFR4 directly phosphorylated FGFR substrate 2, which led to the activation of PI3K–AKT signaling. 27 , 28 , 29 It is possible that the inhibition of FGFR4 by lenvatinib suppressed the activation of PI3K–AKT signaling, thereby inducing ferroptosis.
Some recent studies demonstrated that Nrf2 is a master regulator of antioxidant response and has been shown to regulate lipid peroxidation‐related protein and the activity of several ferroptosis. 30 , 31 A number of integral glutathione synthesis‐ and metabolism‐related enzymes are under the control of Nrf2, including both the catalytic and modulatory subunits of glutamate‐cysteine ligase, GSH synthetase, and a subunit of xCT, all of which are indispensable for GSH synthesis. 32 , 33 In this study, lenvatinib inhibited xCT expression and lipid ROS accumulation, leading to ferroptosis. However, the activation of Nrf2 by lipid ROS accumulation suppressed ferroptosis. Therefore, Nrf2 inhibitors, such as ML385, encouraged that lenvatinib‐induced ferroptosis could be efficiently cause.
In this study, we demonstrated that FGFR4 expression in cancer cells is related to the therapeutic efficacy of lenvatinib in patients with HCC. Yamauchi et al. reported that the tumor FGFR4 level was an independent predictor of the response to lenvatinib. 17 The sample size was relatively small in the two studies, and thus, further research is necessary.
Lenvatinib also suppresses vascular endothelial growth factor receptor in vivo, leading to tumor ischemia. 34 Ischemia contributes to ferroptosis‐mediated tissue injury in the intestine, 35 brain, 36 cardiomyocytes, 37 and kidneys. 38 Considering the lack of angiogenesis in vitro, it is possible that lenvatinib more strongly induces ferroptosis in vivo, and therefore, it will be interesting to evaluate the contribution of lenvatinib to ferroptosis in vivo in future studies.
In conclusion, we first revealed that lenvatinib induces ferroptosis by suppressing xCT expression in HCC cell lines. Lenvatinib‐induced ferroptosis was regulated by Nrf2. Therefore, functional characterization of Nrf2 in ferroptosis may offer insights into the treatment of HCC.
AUTHOR CONTRIBUTIONS
Shinji Itoh, Norifumi Iseda: Conception and design. Norifumi Iseda, Shinji Itoh: Development of methodology. Norifumi Iseda, Shinji Itoh, Akinari Morinaga, Takahiro Tomiyama, Katsuya Toshida, Masahiro Shimokawa, Tomonari Shimagaki, Huanlin Wang, Takeshi Kurihara, Takeo Toshima, Yoshihiro Nagao, Noboru Harada: Acquisition of data. Norifumi Iseda, Shinji Itoh: Analysis and interpretation of data. Norifumi Iseda, Shinji Itoh: Writing, review, and/or revision of manuscript. Tomoharu Yoshizumi, Masaki Mori: Study supervision.
CONFLICT OF INTEREST
The authors have no conflicts of interest to declare.
Supporting information
Fig S1‐S8
ACKNOWLEDGMENTS
We thank Ms Saori Tsurumaru, Ms Asuka Nakamura, Ms Yuko Kubota, and Ms Miki Nakashima for their technical support. We thank Joe Barber Jr, PhD, from Edanz Group (https://en‐author‐services.edanz.com/ac) for editing a draft of this manuscript.
Iseda N, Itoh S, Toshida K, et al. Ferroptosis is induced by lenvatinib through fibroblast growth factor receptor‐4 inhibition in hepatocellular carcinoma. Cancer Sci. 2022;113:2272–2287. doi: 10.1111/cas.15378
Funding information
This study was supported by JSPS KAKENHI (Numbers JP‐19K09198 and JP‐16K10576) and by the Takeda Science Foundation. The funding sources had no role in the collection, analysis, or interpretation of the data or in the decision to submit the article for publication.
REFERENCES
- 1. Villanueva A. Hepatocellular carcinoma. N Engl J Med. 2019;380:1450‐1462. [DOI] [PubMed] [Google Scholar]
- 2. Itoh S, Morita K, Ueda S, et al. Long‐term results of hepatic resection combined with intraoperative local ablation therapy for patients with multinodular hepatocellular carcinomas. Ann Surg Oncol. 2009;16:3299‐3307. [DOI] [PubMed] [Google Scholar]
- 3. Itoh S, Shirabe K, Taketomi A, et al. Zero mortality in more than 300 hepatic resections: validity of preoperative volumetric analysis. Surg Today. 2012;42:435‐440. [DOI] [PubMed] [Google Scholar]
- 4. Faivre S, Rimassa L, Finn RS. Molecular therapies for HCC: Looking outside the box. J Hepatol. 2020;72:342‐352. [DOI] [PubMed] [Google Scholar]
- 5. Schlumberger M, Tahara M, Wirth LJ, et al. Lenvatinib versus placebo in radioiodine‐refractory thyroid cancer. N Engl J Med. 2015;372:621‐630. [DOI] [PubMed] [Google Scholar]
- 6. Kudo M, Finn RS, Qin S, et al. Lenvatinib versus sorafenib in first‐line treatment of patients with unresectable hepatocellular carcinoma: a randomised phase 3 non‐inferiority trial. Lancet. 2018;391:1163‐1173. [DOI] [PubMed] [Google Scholar]
- 7. Motzer RJ, Hutson TE, Glen H, et al. Lenvatinib, everolimus, and the combination in patients with metastatic renal cell carcinoma: a randomised, phase 2, open‐label, multicentre trial. Lancet Oncol. 2015;16:1473‐1482. [DOI] [PubMed] [Google Scholar]
- 8. Dixon SJ, Lemberg KM, Lamprecht MR, et al. Ferroptosis: an iron‐dependent form of nonapoptotic cell death. Cell. 2012;149:1060‐1072. [DOI] [PMC free article] [PubMed] [Google Scholar]
- 9. Wu Y, Yu C, Luo M, et al. Ferroptosis in cancer treatment: another way to Rome. Front Oncol. 2020;10: 571127. [DOI] [PMC free article] [PubMed] [Google Scholar]
- 10. Chen X, Kang R, Kroemer G, Tang D. Broadening horizons: the role of ferroptosis in cancer. Nat Rev Clin Oncol. 2021;18:280‐296. [DOI] [PubMed] [Google Scholar]
- 11. Sun X, Ou Z, Chen R, et al. Activation of the p62‐Keap1‐NRF2 pathway protects against ferroptosis in hepatocellular carcinoma cells. Hepatology. 2016;63:173‐184. [DOI] [PMC free article] [PubMed] [Google Scholar]
- 12. Gorrini C, Harris IS, Mak TW. Modulation of oxidative stress as an anticancer strategy. Nat Rev Drug Discov. 2013;12:931‐947. [DOI] [PubMed] [Google Scholar]
- 13. Taguchi K, Motohashi H, Yamamoto M. Molecular mechanisms of the Keap1‐Nrf2 pathway in stress response and cancer evolution. Genes Cells. 2011;16:123‐140. [DOI] [PubMed] [Google Scholar]
- 14. Ge W, Zhao K, Wang X, et al. iASPP is an antioxidative factor and drives cancer growth and drug resistance by competing with Nrf2 for Keap1 binding. Cancer Cell. 2017;32:561‐573. [DOI] [PubMed] [Google Scholar]
- 15. DeNicola GM, Karreth FA, Humpton TJ, et al. Oncogene‐induced Nrf2 transcription promotes ROS detoxification and tumorigenesis. Nature. 2011;475:106‐109. [DOI] [PMC free article] [PubMed] [Google Scholar]
- 16. Shimokawa M, Yoshizumi T, Itoh S, et al. Modulation of Nqo1 activity intercepts anoikis resistance and reduces metastatic potential of hepatocellular carcinoma. Cancer Sci. 2020;111:1228‐1240. [DOI] [PMC free article] [PubMed] [Google Scholar]
- 17. Yamauchi M, Ono A, Ishikawa A, et al. Tumor Fibroblast Growth Factor Receptor 4 Level Predicts the Efficacy of Lenvatinib in Patients With Advanced Hepatocellular Carcinoma. Clin Transl Gastroenterol. 2020;11:e00179. [DOI] [PMC free article] [PubMed] [Google Scholar]
- 18. Chen J, Yu Y, Ji T, et al. Clinical implication of Keap1 and phosphorylated Nrf2 expression in hepatocellular carcinoma. Cancer Med. 2016;5:2678‐2687. [DOI] [PMC free article] [PubMed] [Google Scholar]
- 19. Iseda N, Itoh S, Yoshizumi T, et al. Impact of nuclear factor Erythroid 2‐Related Factor 2 in hepatocellular carcinoma: cancer metabolism and immune status. Hepatol Commun. 2022;6(4):665‐678. [DOI] [PMC free article] [PubMed] [Google Scholar]
- 20. Lachaier E, Louandre C, Godin C, et al. Sorafenib induces ferroptosis in human cancer cell lines originating from different solid tumors. Anticancer Res. 2014;34:6417‐6422. [PubMed] [Google Scholar]
- 21. Cao JY, Dixon SJ. Mechanisms of ferroptosis. Cell Mol Life Sci. 2016;73:2195‐2209. [DOI] [PMC free article] [PubMed] [Google Scholar]
- 22. Dixon SJ, Stockwell BR. The role of iron and reactive oxygen species in cell death. Nat Chem Biol. 2014;10:9‐17. [DOI] [PubMed] [Google Scholar]
- 23. Zhang P, Wang W, Wei Z, Xu LI, Yang X, Du Y. xCT expression modulates cisplatin resistance in Tca8113 tongue carcinoma cells. Oncol Lett. 2016;12:307‐314. [DOI] [PMC free article] [PubMed] [Google Scholar]
- 24. Su Y, Zhao B, Zhou L, et al. Ferroptosis, a novel pharmacological mechanism of anti‐cancer drugs. Cancer Lett. 2020;483:127‐136. [DOI] [PubMed] [Google Scholar]
- 25. Yang WS, SriRamaratnam R, Welsch ME, et al. Regulation of ferroptotic cancer cell death by GPX4. Cell. 2014;156:317‐331. [DOI] [PMC free article] [PubMed] [Google Scholar]
- 26. Yi J, Zhu J, Wu J, Thompson CB, Jiang X. Oncogenic activation of PI3K‐AKT‐mTOR signaling suppresses ferroptosis via SREBP‐mediated lipogenesis. Proc Natl Acad Sci U S A. 2020;117:31189‐31197. [DOI] [PMC free article] [PubMed] [Google Scholar]
- 27. Eswarakumar VP, Lax I, Schlessinger J. Cellular signaling by fibroblast growth factor receptors. Cytokine Growth Factor Rev. 2005;16:139‐149. [DOI] [PubMed] [Google Scholar]
- 28. Levine KM, Ding K, Chen L, Oesterreich S. FGFR4: A promising therapeutic target for breast cancer and other solid tumors. Pharmacol Ther. 2020;214:107590. [DOI] [PMC free article] [PubMed] [Google Scholar]
- 29. Quintanal‐Villalonga Á, Ferrer I, Guruceaga E, et al. FGFR1 and FGFR4 oncogenicity depends on n‐cadherin and their co‐expression may predict FGFR‐targeted therapy efficacy. EBioMedicine. 2020;53:102683. [DOI] [PMC free article] [PubMed] [Google Scholar]
- 30. Dodson M, Castro‐Portuguez R, Zhang DD. NRF2 plays a critical role in mitigating lipid peroxidation and ferroptosis. Redox Biol. 2019;23:101107. [DOI] [PMC free article] [PubMed] [Google Scholar]
- 31. Li Y, Yan H, Xu X, Liu H, Wu C, Zhao L. Erastin/sorafenib induces cisplatin‐resistant non‐small cell lung cancer cell ferroptosis through inhibition of the Nrf2/xCT pathway. Oncol Lett. 2020;19:323‐333. [DOI] [PMC free article] [PubMed] [Google Scholar]
- 32. Yang H, Magilnick N, Lee C, et al. Nrf1 and Nrf2 regulate rat glutamate‐cysteine ligase catalytic subunit transcription indirectly via NF‐kappaB and AP‐1. Mol Cell Biol. 2005;25:5933‐5946. [DOI] [PMC free article] [PubMed] [Google Scholar]
- 33. Habib E, Linher‐Melville K, Lin HX, Singh G. Expression of xCT and activity of system xc(‐) are regulated by NRF2 in human breast cancer cells in response to oxidative stress. Redox Biol. 2015;5:33‐42. [DOI] [PMC free article] [PubMed] [Google Scholar]
- 34. Matsuki M, Hoshi T, Yamamoto Y, et al. Lenvatinib inhibits angiogenesis and tumor fibroblast growth factor signaling pathways in human hepatocellular carcinoma models. Cancer Med. 2018;7:2641‐2653. [DOI] [PMC free article] [PubMed] [Google Scholar]
- 35. Li Y, Feng D, Wang Z, et al. Ischemia‐induced ACSL4 activation contributes to ferroptosis‐mediated tissue injury in intestinal ischemia/reperfusion. Cell Death Differ. 2019;26:2284‐2299. [DOI] [PMC free article] [PubMed] [Google Scholar]
- 36. Wu Y, Song J, Wang Y, Wang X, Culmsee C, Zhu C. The Potential Role of Ferroptosis in Neonatal Brain Injury. Front Neurosci. 2019;13:115. [DOI] [PMC free article] [PubMed] [Google Scholar]
- 37. Fang X, Wang H, Han D, et al. Ferroptosis as a target for protection against cardiomyopathy. Proc Natl Acad Sci U S A. 2019;116:2672‐2680. [DOI] [PMC free article] [PubMed] [Google Scholar]
- 38. Huang LL, Liao XH, Sun H, Jiang X, Liu Q, Zhang L. Augmenter of liver regeneration protects the kidney from ischaemia‐reperfusion injury in ferroptosis. J Cell Mol Med. 2019;23:4153‐4164. [DOI] [PMC free article] [PubMed] [Google Scholar]
Associated Data
This section collects any data citations, data availability statements, or supplementary materials included in this article.
Supplementary Materials
Fig S1‐S8