

Abstract
With ever-growing population comes an increase in waste and wastewater generated. There is ongoing research to not only reduce the waste but also to increase its value commercially. One method is pyrolysis, a process that converts wastes, at temperatures usually above 300 °C in a pyrolysis unit, to carbon-rich biochars among with other useful products. These chars are known to be beneficial as they can be used for water treatment applications; certain studies also reveal improvements in the biochar quality especially on the surface area and pore volume by imparting thermal and chemical activation methods, which eventually improves the uptake of pollutants during the removal of inorganic and organic contaminants in water. Research based on single waste valorisation into biochar applications for water treatment has been extended and applied to the pyrolysis of two or more feedstocks, termed co-pyrolysis, and its implementation for water treatment. The co-pyrolysis research mainly covers activation, applications, predictive calculations, and modelling studies, including isotherm, kinetic, and thermodynamic adsorption analyses. This paper focuses on the copyrolysis biochar production studies for activated adsorbents, adsorption mechanisms, pollutant removal capacities, regeneration, and real water treatment studies to understand the implementation of these co-pyrolyzed chars in water treatment applications. Finally, some prospects to identify the future progress and opportunities in this area of research are also described. This review provides a way to manage solid waste in a sustainable manner, while developing materials that can be utilized for water treatment, providing a double target approach to pollution management.
Keywords: Co-pyrolysis, Biomass, Activation, Water treatment, Adsorption
Introduction
Environmentally sustainable water treatment options are increasingly being researched and implemented these days to combat the projected water scarcity. The global wastewater production is currently 380 billion cubic meters annually across the world, which is about five-fold times the volume of water moving through Niagara fall every year. This volume is projected to rise by 24% in the coming nine years and 51% by 2050 [1]. There are a number of technologies used to treat this water globally—this includes biological (aerobic and anaerobic treatments using microorganisms), chemical (ozonation, electrochemical, photo-electrochemical, Fenton's oxidation), and physical (adsorption, membrane filtration, coagulation/flocculation) methods [2]. Since there are health and environmental concerns about using treated wastewater due to the detrimental effects of the heavy metal, cations, anions (such as phosphate and nitrate), organics (emerging pollutants – pharmaceuticals, pesticides, endocrine disrupting compounds) and pathogens present in the wastewater; there is an increasing focus on removing these harmful substances. This paper will evolve around discussing the treatment method of adsorption, which is known to be a readily accessible technology, simple to execute, inexpensive, non-destructive, with a remarkable ability to remove pollutants [3].
Consequently, the increasing world population poses a threat to the public due to growing municipal solid waste (MSW) generated, consumption of resources, and the continuing increasing demand for water. Around the world, organic waste, including both food and green waste, forms the most significant component in MSW (around 44%). This is followed by paper and cardboard (17%), plastic (12%), glass (5%), metal (4%), wood (2%), rubber and leather (2%), and other wastes generated at about 14%. It is estimated that there is an increase of 15 million tonnes (Mt) of MSW added to the waste market annually [4]. The total worldwide amount of MSW generated is expected to reach 3400 Mt by 2050; about 12% of MSW produced globally in 2016 was composed of plastics [3]. Hence, sustainable management of MSW is critical for future environmental sustainability.
The most traditional and common treatments for MSW involve open dumping, landfilling, and incineration. All of these methods are associated with numerous environmental risks [4]: incineration causes air pollution and ash disposal after burning; landfilling often leads to leaching causing pollution in surface and groundwater sources and emissions in addition the release of landfill gases (methane and carbon dioxide) to the atmosphere, which is also common in open dumping [4]. Experts revealed that up to 20% greenhouse gas emissions are related to solid waste management activities from developing countries alone. Due to the above-mentioned reasons, alternative methods of effective waste usage need to be considered as part of implementing better and more sustainable practices [4].
In addition to controlling the amount waste produced, recycling opportunities for municipal solid waste management (including food, plastic, and other wastes) should also be explored [5]. Although these techniques are being used to manage wastes, there is still a lack of policy recommendations on the circular economy solution approach, namely, closing loops for all waste streams that a country produces [1]. Sweden is an example where all types of waste are converted to value-added products like biogas, electricity, and heat, thereby reducing the landfilled wastes significantly [6]. Usually, thermochemical conversion processing is considered to convert wastes into useful products. These conversion processes include combustion, gasification, pyrolysis, and liquefaction methods [7]. Pyrolysis converts wastes at temperatures usually above 300 °C in a pyrolysis unit to bio-oil, carbon-rich biochar, and combustible gases [8]. It is being studied on different levels, including micro-level experimental studies to understand the degradation kinetics and to develop more realistic pilot and semi-industrial scale studies to further understand the properties of the biochar-derived adsorbents produced [9]. The pyrolysis conditions play a significant role in the degradation behavior, process efficiency, and cost-effectiveness [9]. Chars and the gases are often considered byproducts from pyrolysis, while the bio-oil portion is the main product. Generally, a low temperature with a slow heating rate leads to maximum char production, and high temperature with long residence time is known to maximize gas production [10].
The feasibility of using biochar in water treatment has been reported in literature [11–13], providing a suitable reuse application. One such study, based on using groundnut, coconut shell, and rice husk for dye removal revealed groundnut to be the most economical route as it was more readily available and cheaper [14]; therefore, low-cost adsorbents are being increasingly researched, especially for large-scale level applications. An interesting study on the industrial application of low-cost adsorbents for dye removal revealed that good accessibility and durability of adsorbents among other factors play a key role in the feasibility of the application. Furthermore, the study even concluded that with good regeneration capabilities and large reuse times, the technology could cost much less than distillation for dye wastewater treatment [15].
However, there is limited implementation on drinking water and wastewater applications and associated policies. The reasons for this are speculated to be inadequate systematic studies and the lack of optimization studies of design/operating parameters [16]. Furthermore, due to the lack of support in technological advancements in some countries in Asia and Africa, there needs to be an improvement in related policy frameworks to enhance research and development in the field [16, 17]. Given the ability of pyrolysis to process different wastes together [18], there is a need for related policy reforms that would enable use of these waste-derived materials in sensitive applications such as drinking water treatment, following appropriate safety demonstration under strict testing protocols.
The vast majority of research and development in biochar-based adsorbents consider a single waste fraction that does not interconnect with MSW well. Of the studies that have considered copyrolysis, which is the pyrolysis of two or more feedstocks, they conclude that co-pyrolysed biochar is an economically feasible option [19] compared to other waste treatment options [20]; and that the added benefits from resource recovery and recycling are known to increase the economic feasibility and process attractiveness [21]. Therefore, in this paper, the potential applicability of co-pyrolysis to produce water adsorbents will be reviewed and assessed. This process represents the real-life scenario of MSW and its applicability—therefore, decreasing the quantity of various waste types at once and reducing pollution significantly.
This paper provides an update on earlier reviews [22, 23] by firstly giving coverage to the most recent works from 2019 onwards and secondly implementing a methodological process focusing on steps and techniques of the production of co-pyrolyzed chars and subsequent water treatment rather than focusing primarily on the feedstocks and/or pollutants. This includes a more comprehensive by report of both experimental and modelling research related to water treatment using co-pyrolysis char, inclusion of activation methods for upgrading co-pyrolyzed chars, information on thermodynamic analysis, regeneration data, and reports for real water studies. This review, therefore, provides a timely and comprehensive reflection on recent work in adsorbents produced from co-pyrolyzed wastes and their application.
Among the research articles published so far, this chapter will mainly consider papers published in the past five years (from 2017). The first set of search words are ‘co-pyrolysis’ and ‘biochar’ and ‘biomass’ and the second set of words are ‘co-pyrolysis’ and ‘biomass’ and ‘adsorbent’—these were entered into the Google Scholar and SCOPUS search engines; while the former input search words provided 4300 search results, the latter only gave 2020 results. Figure 1 shows the SCOPUS search in both areas published through the years 2014 to 2021. The papers for both searches fell below the 35 articles/year limit over the years showing that the research is still rising, especially for water treatment applications. The following sections only cover the papers that passed additional sieving and scrutiny based on their alignment with the topic (and search words).
Fig. 1.
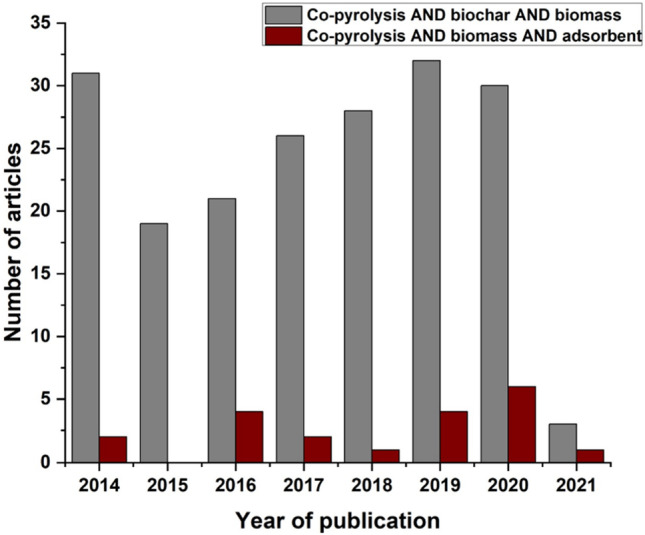
SCOPUS results for co-pyrolysis papers in literature
Section 2 will discuss the production of chars that have the potential for water treatment. The succeeding sections will include papers already published on using co-pyrolyzed chars for water treatment involving the treatment of both organic and inorganic pollutants.
The objectives of this paper are (i) to summarize the co-pyrolysis operating conditions and requirements to produce quality char that can be potentially used for water treatment, (ii) to understand various activation techniques for upgrading co-pyrolyzed chars to improve their water pollutant adsorption characteristics, (iii) to discuss water treatment of both organic and inorganic pollutants using co-pyrolyzed char in detail, including experimental parameters (pH, temperature, dose, time), modelling studies (isotherm modelling and kinetic modelling), temperature and thermodynamic analysis, removal mechanisms, regeneration, and real water studies, and (iv) discuss future prospects of water treatment using co-pyrolyzed chars. Figure 2 shows the steps to be followed for converting wastes to co-pyrolyzed chars to activated chars/carbon, which are then used for water treatment and further desorption and regeneration studies to help reuse the adsorbents and recover valuable adsorbed species.
Fig. 2.

Schematic diagram of wastes to adsorbents for water treatment
Co-pyrolysis and potential chars for water treatment
Co-pyrolysis of more than one waste is generally considered useful for a number of reasons apart from reducing the quantity of waste and reducing associated pollution. When compared to single wastes, co-pyrolysis is known to increase the carbon conversion efficiency and the yield of volatiles [24]. Additionally, it is known to have stronger products that individual feedstocks after pyrolysis with better the biochar yield with enhanced properties [22]. The products from this process are also known to be advantageous for water treatment application; a review paper suggests better removal rates for pollutants when using co-pyrolyzed char instead of single waste chars. This can be attributed to the positive synergistic effect observed when co-pyrolyzing wastes, which is highly dependent on the kind of feedstocks used, the pyrolysis operating conditions, and the blending ratio [25].
There are numerous papers published on co-pyrolysis with biomass describing the quality of the char along with operating conditions and feedstock composition. The studies focus on thermogravimetric analysis (TGA) reactors, the tube furnace, fixed bed reactors, agitated bed pyrolysis reactors, the pyrolysis furnace design and in some cases, semi-industrial scale pyrolysis units. One study co-pyrolyzing coal and walnut shells revealed the experimental results for char yield to be higher than the calculated values showing excellent potential for application [26]. Another specific study focused on co-pyrolysis of sewage sludge (SS) with bamboo sawdust, exhausted tea, and rice husk, all giving chars with good yields greater than 50% and a surface area greater than 14 m2/g in all cases showing promising potential for activation and further use as an adsorbent [27]. There is research on understanding the effect of mineral components in sludge on the pyrolysis process. One such study, based on TG-FTIR-GC/MS analysis, revealed that the presence of mineral components catalyzed the thermal cracking of the organic components present in the sludge and accelerated the thermal degradation to the value-added products. Specifically, the yield, surface area, and pore structure was known to improve with the inherent minerals present in the sludge samples due to the improvements in metal catalyzed thermochemical reactions during pyrolysis [28]. Furthermore, another study concluded that the increase in pyrolysis temperature is known to increase surface area and stabilize the toxic metals present hence reducing the likelihood of leaching [29]. Hence, the produced char is considered low risk for the environment due to less bioavailability and decreased leaching capacity [30]. This also proves the importance of operating parameters in developing varying quality chars, which includes factors such as temperature, heating rate, operating reactor type, blending ratio, and feedstock types [31]. However, this also highlights that leaching tests or metal-content guidelines are important for the use of the co-pyrolysed biochars in water treatment applications.
There are studies that focus on the interaction, mechanism, and synergy of co-pyrolysis while adding different types of feedstocks. One study on using cellulose and polyethylene was found to lead to CH formation leading to an improvement in fuel products; further studies on molecular dynamic simulation and density functional theory enhanced the production of fuels of high quality [32]. One study used a multi-technology approach to understand the synergistic effects of co-pyrolysis of seaweed and rice husk and concluded that deoxidization effects changed the products distribution [33]. Reaction force field simulation studies have also enabled a better understanding of the interactions in co-pyrolysis to be achieved; a study revealed synergistic effects between rice husk and oily sludge (due to the presence of hydroxyl and hydrogen radicals) with reduced activation energy, even contributing to a difference in product distribution [34]. More specifically, Section 4.3 will discuss the studies investigating the mechanisms of water treatment using co-pyrolyzed chars. Table 1 focuses on 12 co-pyrolysis studies along with varying process conditions, which can be beneficially utilized, upgraded, and applied for water treatment applications.
Table 1.
Selected co-pyrolysis articles from 2021 focusing on char production
| Feedstock | Reactor | Operating condition | Findings/char characteristics | References |
|---|---|---|---|---|
| Cellulose (C), lignin (L), sawdust (S) | TGA-FTIR |
BR: 1:1 T: 500 °C |
Lignin enhanced the formation of biochar Yield: S:C-17.5% S: L-41.0% C: L-33.8% |
[35] |
| Enteromorpha prolifera-corn straw | TGA |
BR: 7:3, 1:1, 3:7 of corn straw T: 5 °C–600 °C HR: 10 °C/min |
BET (m2/g): 1.79, 1.41, 0.86 Yield: 35.44, 38.17, 41.76 |
[36] |
| Wood sawdust (RWS)-SS (SS) | Agitated bed pyrolysis reactor |
BR: (25:75, 50:50, and 75:25 by weight) T: 450, 500, and 550 °C GFR: 5 L/min of N2 |
Improved yield of biochar products with the SS biochar and increasing its carbon content and reducing ash and inorganic elements. RWS biochar surface more porous but SS biochar has larger specific surface Highest yield – RWS 25: SS75—~ 44.5 at 450 °C |
[37] |
| SS and LDPE | TGA | BR: 1:1 and 1:2 | SS and LDPE lead to lower formation of char due to synergic interaction between them | [38] |
| Biomass and bentonite (BBC) with Zn, Fe, and Mn | TGA |
BR: 10:1 (CS: bentonite) HR: 10 °C/min |
BBC; ZnBBC; FeBBC; MnBBC Yield (%): 39.65; 56.10; 46.93; 49.66 BET(m2/g): 70.81; 24.24; 9.24; 37.11 |
[39] |
| Low-rank coal (LRC) with lignin (LIG) | Tube furnace |
T: 550 – 700 °C BR: 0 -100 wt.% |
Highest char yield decreasing from 0 to 100% if coal The char yield of LRC decreased from 80.82 wt.% to 71.51 wt.% from 550 °C to 700 °C, while LIG decreased from 50.55 wt.% to 40.62 wt.%. Mixing both also showed similar behavior |
[40] |
| Pine bark and wheat straw with Tetra Pak waste (TPW) | TGA | HR: 10 C/min T: 25 °C to 700 °C GFR: 40 mL/min of air |
Total yield: decreased from 36 wt.% to ~ 18 wt.% for PB-TPW; decreased from 26 wt.% to ~ 18 wt.% from 0 to 100 mass% of TPW Carbon and hydrogen distribution in char yield highest: ~ 60 mass% and ~ 20% at 0:100 (TPW: PB); ~ 40 mass% and ~ 10 mass% at 0:100 (TPW:WS) |
[41] |
| Eucalyptus wood (EW) and LDPE | Semi industrial pyrolysis unit |
T: 300 to 550 °C, RT: 90–150 min BR: 33% and 25% of LDPE |
Yield %—Highest at 300 °C for 90 min at ~ 35 and ~ 37% for 1:2 and 1:3 feedstock ratio (LDPE: EW) Energy density (1.25) and high heat value (31 MJ/Kg) at 300 °C The highest concentrations of fixed carbon (39%), fuel ratio (0.81) along with the lowest O/C and H/C ratios (0.07 and 0.13) above 450 °C |
[42] |
| Eucalyptus biomass and waste expanded polystyrene (WPS) | Semi industrial pyrolysis unit |
T: 300—550 °C RT: 90–50 min BR: (33% and 25%) WPS (w/w) |
33% WPS content at 300 °C → Energy density (1.12–1.30), heating value (28.03–32.5 MJ/kg 25% WPS content at 550 C → Fixed carbon (4.5–34.19%), fuel ratio (0.05–0.64) The chars produced at 300, 350 °C were observed to have O/C and H/C ratios like that of sub-bituminous and bituminous coal |
[43] |
| Biomass and single-use plastics | TGA |
TGA: T: 300, 400, 500, and 600 °C BR: 2:1 (EW: PS) 2:1 (w/w), EW: LDPE 2:1 (w/w) GFR: 30 mL/min of N2 HR: 10 °C/min |
Adding PS exhibited highest synergistic and inhibitory effects. After the complete degradation of plastics, char had higher values of surface area (15–64%), and cation exchange capacity (5–19%) | [44] |
| Corn cob (CC) and PE | TGA |
BR: 3:1 HR: 10, 20, and 30 °C/min |
AE for CC pyrolysis was estimated to be 240 ± 51.25 kJ/mol Co-pyrolysis required 10% less AE than pyrolysis of CC alone and 50% decrease in bio-char yield for the blend as CC |
[45] |
| SSB (SS blend) with bamboo sawdust (BS), exhausted tea (ET), (KW), rice husk (RH), (WS) | Single step pyrolysis |
T: 350–750 °C BR: 4:1 (S/various OF MSW) HR:10 °C min/1 GFR: 100 ml/min of N2 |
Yield; (%) specific surface area (m2/g) SSB-BS—59.68 ± 0.85; 20.36 SSB-ET—56.45 ± 1.07; 22.16 SSB-KW—57.37 ± 1.33; 12.11 SSB-PVC—57.20 ± 0.22; 2.20 SSB-RH—58.38 ± 0.77; 16.07 SSB-WS—56.51 ± 0.59; 14.71 |
[27] |
| Plastic processing sludge (PPS) and KH2PO4 | Tube furnace with a quartz reactor |
BR: KH2PO4 of 0, 5, 10 and 20 wt.% (KBC-0, 5, 10 and 20) T: 25 – 400 ◦C HR: 10 ◦C/min, final RT: 60 min GFR: 0.5 L/min flow of N2 |
Yield; Surface area (cm2 cm −3) PPS: n/a; 1365 KBC-0: 61.13; 1464 KBC-5: 64.26; 1417 KBC-10: 64.77; 1248 KBC-20: 66.02; 1067 |
[46] |
HR, heating rate; BR, blending ratio; GFR, gas flow rate; T, temperature; TGA, thermogravimetric analysis; RT, residence time
Activation of co-pyrolyzed chars
The production of activated char/carbon involves two main steps: carbonization and activation. The carbonization process removes the volatile content of raw materials when they undergo co-pyrolysis. However, the product, after carbonization, only provides carbons with a high fixed carbon and considerable porosity [47]. Therefore, to improve some of the properties like active sites and functionality, the surface area, and pore volume, activation is carried out. In this process, new pores are created or existing pores are expanded, in addition to changing some other chemical characteristics [48]. These changes make activation a desirable step when the end-use is for water treatment applications.
There are mainly two types of activation methods to prepare activated chars- physical and chemical [49]. Physical methods include oxidizing atmospheric gases such as steam, carbon dioxide, or nitrogen, and in some cases air with temperature ranging from 800 to 1100 °C [49] and chemical activation (wet oxidation) commonly used for biomass activation involves the usage of chemicals in the presence of high temperature. This section will discuss studies that activated co-pyrolyzed chars using these methods.
As mentioned in Section 2, the mineral contents in char samples are known to be stable upon pyrolysis at higher temperature. Specifically, there are recorded effects on activated carbon properties based on the mineral content present in the feedstocks [50]. A study on coconut shell-based activated carbons concluded that the increase in mineral concentration leads to more site occupation of the pore surfaces, which eventually reduces adsorption capacity of the activated carbon [51]. However, another study using brown coals with high mineral content showed good adsorption capacities for pollutants like methylene blue and inorganic pollutants and other gas contaminants [52]. Furthermore, a similar study revealed increased mesoporous properties and reduced surface area in the presence of higher silicon, iron, and calcium using coal-derived activated carbon [53]. One study investigating municipal sewage sludge samples concluded that the risk levels of minerals content are lower after activation with KOH. Sludge samples are known to have varying contents of minerals and therefore such studies are sparse due to the material complexity and variability [54]. Nevertheless, the effect of mineral content on co-pyrolyzed chars has not been extensively reported in literature.
Physical activation
Generally, physical activation is known to increase the surface and porosity and remove the volatile organic compounds present [55]. Literature on the physical activation of co-pyrolyzed char is much less compared to chemical activation. A study was conducted on activated chars produced from co-pyrolyzed rice husk and polyethylene in equal proportions. Out of the four physical activating conditions in CO2, the best textural properties were revealed by the char activated at 800 °C for 4 h exhibiting a surface area of 325 m2/g and pore volume of 0.18 cm3/g [56]. Another study focused on activating ligneous and herbaceous biomass chars physically with CO2 in different reactor types. Results showed an 80% increase in surface area after activation in a mechanically fluidized reactor (MFR) [57]. A similar study on simulated MSW in a CO2 environment showed promising results (SA > 300 m2/g) at 600 °C and 900 °C [12]. A study on steam activation of char of lignin and ferrous salts showed a relatively low mass-loss rate as the iron oxidized to magnetite in the presence of steam [58].
Chemical activation
Chemical activation can be accomplished by using alkali, acid, or some neutral activating agents. Chemical activation is known to increase the porosity, functionality, and activated carbon content carried out by the added dehydration agents that enable pyrolytic decomposition, preventing bitumen formation and further thermal degradation [49]. Acid treatment is known to introduce carboxyl groups to the surface. On the other hand, alkaline treatment is known to increase the hydroxyl groups at the surface and to decrease polarization due to the formation of a positive surface charge [55]. Oxidant oxidation is also considered a type of chemical treatment wherein oxygen containing groups is added introducing carboxyl groups onto the surface upon activation in addition to increasing the surface area and porosity [55]. The following sections will discuss studies related to these activation techniques.
Acid activation
Several activating chemicals have been tested, but acid activating chemicals mainly include phosphoric and sulfuric acid [49]. A study using sulfuric acid as an activating agent activated co-pyrolyzed chars of sucrose and red mud producing magnetic activated char attaining a maximum surface area of 428 m2/g and a pore volume of 0.412 cm3/g at 700 °C [59]. Alternatively, using hydrochloric acid for activating peanut shell and vinasse mixtures, the surface area surpassed 1200 m2/g and with a pore diameter of 21 Å [60]. A rather unique study focused on using acidic iron salt activating agent (ferric nitrate) after co-pyrolysis of wood and polyvinyl chloride (PVC), demonstrating a moderate surface area of 81.51 m2/g and a pore volume of 18.73 cm3/g [61].
Alkaline activation
Some alkali chemicals used for activation are KOH, NaOH, CaCl2, and K2CO3 [48]. This set of activating agents is possibly the most widely used for activating co-pyrolyzed chars. The first study to be discussed involves a two-step co-pyrolysis treatment of rubber waste and larch sawdust with KOH activation as the second step. The results showed a surface area of 300 m2/g was achieved, which was considered of high quality as per the American Water Works Association B600 standard. Additionally, it was also concluded that, the co-pyrolyzed char had a higher surface area compared to the individual ones due to the formation of higher pores after pyrolysis which enables more efficient activation results [62].
A two-fold surface area increase was observed when a sample of sludge and coconut shell co-pyrolyzed char was activated with KOH [63]. There was also a considerable increase in the yield compared to the non-activated chars. Further studies on optimization using the same feedstocks according to a response surface methodology indicated the best yield (47.5%) with 680.3 m2/g surface area produced under the conditions listed in Table 2 [64]. Another interesting study with lignin, rice husk, and PVC showed a surface area increase of more than 10 times upon activation with KOH [65].
Table 2.
Optimized activation condition for co-pyrolysis of coconut shell and sludge [64]
| Blending ratio | 1:1 |
| Carbonization temperature | 500 °C |
| Carbonization time | 45 min |
| Activating agent (KOH) concentration | 2.5 mol/L |
| Impregnation ratio (KOH solution: sample) | 1.5:1 |
| Activation time | 60 min |
| Activation temperature | 800 °C |
In another experiment, co-pyrolyzed cotton stalk and sludge char were activated with KOH under 5 different reaction conditions [66]; the optimal result for a loading rate of 150 g (30% sludge) was demonstrated by the use of 50% KOH solution, at a radiation time of 24 min at 280 W. Another study performed KOH activation on co-pyrolyzed corn stalk and polyethylene chars, producing a maximum surface area of 581.8 m2/g upon activation [67]. Applying KOH in the co-pyrolysis of cyanobacteria and plastics produced a high quality carbon demonstrating a high surface area of 1461 m2/g [68].
Potassium carbonate is another common activating agent. One study conducted on co-pyrolyzed municipal sludge and hazelnut shell chars (850 °C) with K2CO3 under nitrogen atmosphere provided activated chars with a surface area of 1990 m2/g and a pore volume of 0.589 cm3/g [69]. One more fascinating study on co-pyrolyzed cyanobacteria and plastics showed a surface area of 2135 m2/g upon activation with K2CO3 [70]. A study on the activation of SS and cotton stalks concluded that there was more than a double increase in the surface area when activated with 10 wt% potassium carbonate [71].
Neutral activation
Some research studies also use neutral activating agents such as ZnCl2. This section will cover two such studies. The first study investigated the activation of co-pyrolyzed chars of municipal sewage sludge and hazelnut shells with ZnCl2 giving a surface area of 598.7 m2/g. This study also revealed that the ecological risk of heavy metals is very low in chars produced at 500 °C [72]. Another study utilized mixed date stones/pits and olive stones for char production; the surface area increased to 936.5 m2/g and the pore volume to 0.593 cm3/g after activation with ZnCl2 [73].
Oxidation activation
Some researchers include chemicals like phosphoric acid, nitric acid, and potassium hydroxide as oxidizing agents. These agents are known to produce oxygen containing functional groups such as –OH, –COOH, -C = O, and -C-O onto the surface of carbon-containing adsorbents. However, this section will include other strong oxidizing agents like hydrogen peroxide and potassium permanganate not mentioned previously in this paper [74]. One of the major oxidizing agents is hydrogen peroxide, which is known to produce free radicals by catalytic conversion. A recent review paper summarizes its use and proposed a mechanism for pyrolyzed biomass samples [75]. One study revealed a surface area of 273.9 m2/g when rice stalks were activated with hydrogen peroxide with microwave radiation [76]. Another study added persulfate in addition to hydrogen peroxide as the most frequently used oxidizing agent. However, this agent (like hydrogen peroxide) needs to be activated to generate reactive oxidative species (ROS) which mainly aids in the removal of organic substances [77]. In a special case, dewatered sludge samples with high content of iron-present as Fe3O4 were revealed to have an advantage with persulfate activation leading to increase in oxygen radicals and porous properties which enabled removal of an azo dye [78]. Potassium permanganate is usually used along with other chemicals such as iron (Fe II) or potassium hydroxide producing chars with good properties [79–81]. Furthermore, there are also some other less studied methods of oxidation like electrochemical, graphite, and plasma treatments [74]. Biochars that are oxidized are known to be excellent for the removal of organic pollutants, the remediation of soil and airborne particulate matters among other applications [82]. Unfortunately, it is uncommon in literature to find co-pyrolysis studies that conduct oxidation activation; therefore, researchers can explore this technique to improve the quality of chars in the coming years.
Comparison studies
Some studies compare two types of activation methods to examine the difference in the quality of activated chars produced. These provide greater insight into the real potential of an activation method. The subsequent studies use KOH as one of these activating agents. The first study conducted activation by KOH and ZnCl2 on chars from co-pyrolyzed waste truck tires and spent tea leaves at 800 °C. The best results were found by zinc chloride activation at a blend ratio of 1:3 (waste truck tires: spent tea leaves), giving a surface area of 527.2 m2/g and a pore volume of 0.123 cm3/g. It was found that zinc chloride activation produced more carbons with low oxygen content compared to KOH activated chars. However, the quality of both was comparable to those of commercial products [83]. Likewise, thermal activation was compared to KOH activation [84] and H3PO4 activation [85]. The former study showed a surface area increase of 60% when chemically activated at the same activation temperature, while the latter study showed only a surface area increase of 73 m2/g when chemically activated. However, the activation was conducted at different temperatures.
The majority of these activated chars possess good properties, which are considered of great benefit for water treatment. Generally, chemical activation can be regarded as more thoroughly researched and implemented in literature. The next section will discuss in detail studies using co-pyrolyzed chars for water treatment.
Adsorption studies using co-pyrolyzed chars
In recent years, biochars derived from co-pyrolyzed biomass wastes have been studied and applied to remove both organic and inorganic pollutants from water [13]. One such study revealed a methylene blue removal capacity of 490 mg/g using co-pyrolyzed cyanobacteria and polyethylene wastes (20 mg adsorbent; 298 K; 500 mg/L of methylene blue solution) [70]. Another study achieved 99.5 mg lead/g removal using co-pyrolyzed corn stalk and polyethylene (0.1 g adsorbent; 298.15 K; 50 mg/L; pH 4.5) [67].
Parameters effecting pollutant adsorption in water
There are several parameters affecting the adsorption process in water. The majority of these factors are described in a recent review paper on adsorption of pollutants [86] including the effects caused due to the operating unit, co-existing ions and other substances, adsorbent particle size, height (in fixed bed systems), feeding flow rate and liquid superficial velocity, feed concentration (in a continuous adsorption system), pH of the solution, adsorption temperature, adsorbent dosage, and contact time. The effect of the latter four parameters on adsorption using co-pyrolyzed chars is discussed in sections from 4.1.1. through 4.1.4, as it is widely reported in literature for co-pyrolysis studies.
The other effects related to adsorption using co-pyrolyzed chars, although less reported, are deemed important. In general, when it comes to the influence of the operating unit, fixed bed adsorption or batch adsorption may be preferred based on the solution concentration and other factors [86]. Furthermore, there are some studies discussing the effect of co-existing pollutants in the adsorption of target pollutants [86]. A study using rice husk with Mg/Al-calcined layered double hydroxides showed a slight reduction (9%) in the phosphate removal in the presence of another ion HCO3−. The reduction is considered less due to the lower partial negative charges on oxygen atoms on HCO3− compared to phosphate ions [87]. More in-depth studies need to be carried out to understand the effect of this factor. As for the particle size and height, it is especially important for fixed-bed column adsorption systems as it helps understand the pressure conditions and related handling enabling good adsorption rates. As a conclusion, increasing the height of the bed is known to improve adsorption as the number of active sites and contact time are increased reducing dispersion [86]. In terms of the feed flow rate, it was noted that the flow rate influences the contact time, residence time, and velocity, which all effects the adsorption rate of pollutants. Similarly, increasing the feed concentration has also been observed to be an essential factor enhancing the adsorption capacities in continuous systems, due to the impact on the mass transfer from the larger concentration gradient between the adsorbent and the solution [86].
Effect of pH
Many studies focus on the effect of pH on pollutant removal efficiencies. For example, a study [59] using activated co-pyrolyzed chars of sucrose and red mud chars for chromium removal found a maximum removal capacity, qe ≈ 7 mg/g, at a pH of 2.10. Further reductions in removal rates with pH increase were observed [59]. However, another study [88] focused on utilizing co-pyrolyzed chars of nano-zerovalent iron (nZVI) and SS wastes for the removal of chromium revealed that the lower initial pH is useful for protonation of the biochar surface, hence, promoting chromium removal. At higher pH, chromium (VI) is converted to chromium (III), which is known to be challenging to remove by adsorption [88]. This hypothesis is supported by two other studies. The first one studied co-pyrolyzed char for the removal of arsenic, achieving a maximum adsorption capacity of 4.23 mg/g and removal efficiency of 84.57%, which was obtained at an initial pH of 2 [89]. The second study, using halloysite and coconut shell co-pyrolyzed char, showed optimal lead adsorption at pH 5 [90]. Furthermore, a further study revealed good adsorption results for cadmium at a higher pH using a thiourea modified poplar biochar [91]. Acidic and neutral pH levels were preferred for phenol removal by coal tar pitch and vinasse co-pyrolyzed char, owing to the lower dissociation of phenol at the specified conditions and hence, easier removal. Interestingly, another study revealed negative adsorption of phosphate at pH 2, speculating that phosphate was released from the biochar (SS and walnut). Therefore, adsorption studies focused on pH values greater than 4. Iron-bearing mineral with rice straw biochar composites best-removed chromate (34%) and selenate (37%) between pH 4 and 7 [92]. A similar result was observed in the removal of cadmium by co-pyrolyzed SS and tea waste: the efficiency spiked from 44 to 94% when the pH was increased from 3 to 6 [93].
Another study [92] concluded that it is optimal to conduct pollutant removal from water at higher pH values (greater than 6.0) to avoid precipitation due to protonation at lower pH, which is known to reduce the chances of metal ions binding (the adsorbent used was camellia oleifera shells (COS) with ammonium polyphosphate) [92]. A similar observation was made for the adsorption of basic blue 21 dye by co-pyrolyzed chars of Saccharina japonica and goethite optimized at pH 8 [94]. At low pH, there is competition between the hydrogen ions and the metal/cationic dye ions for the negatively charged adsorbent sites.
Effect of temperature
Temperature is known to play a significant role in the uptake of the pollutant, the transformation of surface complexation structures, and also the stability of precipitates if formed [95]. The effect of temperature is widely studied in literature. The first investigation focusing on the influence of temperature was studied for the removal of chromium and arsenic using nZVI and SS. The former study demonstrated an increase in the removal capacities from 11.54 to 12.34 mg/g when the temperature increased from 288 to 318 K [88]. On the other hand, the second study reported an increase in adsorption capacity from 4.42 to 4.88 mg/g of arsenic when the temperatures rose from 298 to 318 K [89]. Another study focused on understanding the effect of increasing the temperature from 573.15 to 873.15 K for the removal of cadmium utilizing a thiourea modified poplar biochar; the results concluded a steady increase in the removal capacity reached 36.53% at 873.15 K [91]. Similarly, a mercury removal study revealed that with an increase in temperature, there is a steady increase in mercury removal efficiency, reaching a maximum of 99% at 32 ºC [96]. The adsorbent used was a co-pyrolyzed bamboo and bromine flame retardant char. Furthermore, another study focusing on rice straw and SS co-pyrolyzed char for the removal of chromium obtained an increase in the metal ion removal capacities with an increase in temperature reaching a maximum adsorption capacity close to 50 mg/g [97].
Effect of dose
The dosage of adsorbent is known to play a vital role in the removal of pollutants as the adsorption process depends on the available active sites [93]. One study focused on the dose of co-pyrolyzed char (nZVI and SS) for the removal of chromium and arsenic. For the former, the best removal amount, 13.12 mg/g, was demonstrated when the initial adsorbent dosage was 60 mg/L, and on the other hand, the removal efficiency of the former reduced from 88.92 to 58.00% when the initial dosage increased from 3 to 60 mg/L [56, 57]. A similar study using thiourea modified poplar biochar concluded that the removal capacity increased significantly, with a maximum removal rate of 98.15% when the adsorbent dosage was at 4 g/L [91]. A very close result was obtained with 94% removal of cadmium with 4 g/L biochar (corn stalk and polyethylene) dose [93]. Finally, a study found the highest removal rate (9.23 mg/g) of chromium at an initial pollutant concentration of 50 mg/L using 5 g/L adsorbent [85].
Effect of contact time
Usually, contact time studies precede and facilitate kinetic adsorption modelling (Section 3.3.2). A study explained the adsorption removal of chromium by co-pyrolyzed rice straw and SS in two stages- the first, being rapid removal from 0 to 6 h, and the second phase increase being more gradual and slow from 6 to 24 h reaching equilibrium at 24 h and a maximum adsorption capacity of 48.5 mg/g [97]. The two stage rate process occurs in many adsorption systems: the first initial rapid stage is due to adsorption by film diffusion across the boundary layer at the adsorbent surface sites and adsorption into the macro- and large mesopores close to the adsorbent external surface, followed by a slower second stage due to surface and/or pore diffusion into the smaller meso- and micropores in the internal structure of the adsorbent particle [64, 65].
Other studies also follow this trend showing an initial rapid increase in the adsorption capacities with increase in time below 4 h. The adsorption rate then slows down and finally plateaus between 6 and 8 h to a constant saturation capacity value. A maximum lead removal of 97.35 ± 2.73% was obtained using sludge and corncobs (SCB) co-pyrolyzed char at 8 h [98]. Another study on the adsorption of phenol by coal tar pitch and vinasse co-pyrolyzed char equilibrated after 200 min with an adsorption capacity of 36 mg/g [99]. However, another study revealed the adsorption of chromium using co-pyrolyzed sucrose and red waste mud occurred much quicker, within 40 min, and then reached equilibrium after 120 min due to the reduction in the number of available active sites [59].
The following two studies focused on the potential of nZVI and SS co-pyrolyzed char for the removal for chromium and arsenic based on reaction time. Similar to the previous study, the initial removal was rapid (below 2 h), and then the uptake rate decreased progressively as time increased due to the lack of binding sites. Equilibrium was reached with 12.23 mg/g adsorption capacity at 24 h. Consequently, the removal tendencies of arsenic also followed the same pattern, with a maximum adsorption capacity of 4.43 mg/g achieved at 24 h [89].
Mathematical calculations and modelling
Generally, the calculation and modeling components of water treatment data analysis commonly include isotherms, kinetics, and thermodynamics.
Isotherm modelling
Isotherm studies are widely used to understand the connection between the adsorbed contaminant and the remainder of the pollutant in water under thermodynamic conditions [100]. The graphs produced along with the curves help to determine the classification of the adsorption systems. Some of the standard models include Freundlich, Langmuir, Redlich-Peterson, SIPS, Toth (Table 3). The following section will discuss different studies utilizing some of these models to understand the adsorption capabilities of co-pyrolyzed chars [100].
Table 3.
Descriptions of isotherm models
| Isotherm model | Description |
|---|---|
| Langmuir [101] | Considers adsorption as a continuous bombardment of molecules onto a surface with their corresponding desorption or evaporation from the surface with no aggregation at the surface |
| Freundlich [102] | Not limited to monolayer formation and can be applied to formation of multilayers. Adsorption heat does not need to be uniformly distributed on the heterogeneous surface of the isotherm |
| Redlich–Peterson [103] | Can be applied to heterogenous and homogenous systems as it features both Freundlich and Langmuir models |
| SIPS or Langmuir–Freundlich (LF) [104] | Combines Langmuir and Freundlich isotherm models to predict the heterogeneity of the system- it localizes the adsorption without adsorbate–adsorbate interaction |
| Toth [105] | Is a modified version of Langmuir model described for heterogenous system considering both low and high concentration of adsorbate (assuming most sites having lower energy) |
| Temkin [106] | Considers the interaction between the adsorbent and the adsorbate by ignoring the extremely large and low concentration values- it assumes that adsorption heat of all molecules in the layer declines linearly rather than logarithmically |
| Dubinin-Radushkevich (DR) [107] | Associates the mechanism of adsorption to the distribution of Gaussian energy onto the heterogeneous surfaces |
A study that used activated co-pyrolyzed chars of sucrose and red mud for chromium removal focused on both Freundlich and Langmuir isotherm models; the former model produced a higher correlation of the adsorption data with R2 = 0.998 than the latter with R2 = 0.928 [59]. A similar study focused on these models, and the lead adsorption data using co-pyrolyzed rape straw and orthophosphate showed a higher correlation with the Freundlich model (R2 = 0.909) [100]. Another interesting study focused on these models using adsorption data of co-pyrolyzed char of dewatered alum sludge and molasses for arsenic removal in different environments, namely, dry air, nitrogen, and carbon dioxide. Again, the Freundlich isotherm model showed excellent correlation (R2 > 0.96) in all studied conditions [108]; similar fit results were concluded using co-pyrolyzed chars with different ratios of rape straw and phosphate rock [109]. This proves that most co-pyrolysis studies provide a better fit to the Freundlich model owing to model’s assumption of heterogenous active sites, which would likely be true in an adsorption system with multiple feedstocks.
Furthermore, a study focusing on removal of methylene blue and congo red using sludge and coconut shell focused on Langmuir and Freundlich isotherms models at three different temperatures (293.15 K, 303.15 K, and 313.15 K). The Langmuir model demonstrated better correlation (R2 > 0.97 for all conditions) with the adsorption data [63]. On the other hand, another study focused on the removal of cadmium by co-pyrolyzed SS and tea waste at 298.15 K, 308.15 K, and 318.15 K showing best fit using Freundlich isotherm model in the first two temperatures and the Langmuir model at 318.15 K [63]. Furthermore, according to a study concentrating on using co-pyrolyzed chars of COS and ammonium polyphosphate (produced at varying ratios) for lead removal concluded Langmuir model as the best fit for all conditions [110]. The results of these studies show that adsorption mainly occurred in a monolayer. The reason could be that one of the feedstock dominates the adsorption system or that both feedstocks behave in the same way.
There are some studies that focused on the SIPS (Langmuir–Freundlich) model as well. One such study was conducted at temperatures 283.15 K, 298.15 K, and 313.15 K. The R2 value was highest and greater than 0.99 for SIPS in all cases [93]. In another study, involving the application of the Langmuir, Freundlich, and Sips isotherm analyses, the best-fit R2 was greater than 0.988 in all chosen temperatures (288.15, 298.15, and 308.15 K) based on the SIPS model [111]. These results show that the SIPS model, which is a hybrid of both Langmuir and Freundlich isotherm models, predicts the heterogeneity of the system very well.
From the previous discussion regarding isotherm types, it is evident that most studies focus on Langmuir and Freundlich models for isotherm modelling. Based on the adsorption data, either one of these models are almost always confirmed as best-fit, without any testing of alternative isotherm models. The Langmuir model usually indicates that the sorption has occurred on a monolayer and has an equal affinity to all active sites on the sorbent surface, on the other hand, a better fit to the Freundlich model implies a heterogeneous sorption system with various active sites [112].
Further information on isotherm models and its application are detailed in Section 3.4.1. Table 4 provides details on 15 studies that focus on isotherm models for removal of some inorganic and organic pollutants.
Table 4.
Isotherm studies of water treatment using co-pyrolyzed chars
| Feedstock | Pollutant | Experiment conditions | Best isotherm model | R2/ SSE | Parameter values | Reference |
|---|---|---|---|---|---|---|
| Inorganic pollutant removal studies | ||||||
| SS and walnut shell |
Ammonium Phosphate |
Initial pollutant concentration: 50 mg/L Adsorbent amount: 0.1 g Time: 36 h |
Freundlich SIPS |
0.99 0.981 |
KF = 0.15605 (mg1−1/n⋅L1/n⋅g−1) n = 1.4605 KF = 0.0078 (L1/n/mg1/n) n = 2.3179 |
[113] |
| nZVIand SS | Arsenic |
Initial pollutant concentration: 3–60 mg/L Adsorbent amount: 4 g/L Initial pH: 2–12 |
Freundlich | 0.9950 |
KF = 1.653 (mg g−1 mg1/n L−1/n) n = 1.919 |
[89] |
| Molasses and dewatered alum sludge | Arsenic |
Initial pollutant concentration: 10, 50, 80, 100, 300, 500, 800 and 1000 mg/L Adsorbent amount: 1 Time: 8 h |
Freundlich | 0.97 |
KF = 1.08 1/n = 0.48 |
[108] |
|
Poplar bark and thiourea Poplar saw dust (MB) and thiourea |
Cadmium |
Initial pollutant concentrations: 5,10, 30, 100, 250, and 500 mg/L Adsorbent amount: 1 g Temperature: 25 ºC |
Langmuir Langmuir |
0.91 0.99 |
KL = 0.026 (L/mg) Qm = 19.99 (mg/g) KL = 0.652 (L/mg) Qm = 0.385 (mg/g) |
[91] |
| Cantaloupes straw and polypropylene | Cadmium |
Adsorbent amount: 0.02 g Initial pollutant concentration volume: 10 – 400 mg/L Temperature- 25 °C |
Langmuir | 0.993 |
KL = 0.25(L/mg) Qm = 108.91 (mg/g) |
[114] |
|
SS and hazelnut (magnetized with nanosized γ-Fe2O3) |
Copper |
Adsorbent amount: 1.25 g/L Initial pollutant concentration: 20 mg/L Temperature- 25 °C |
Langmuir | 0.995 |
KL = 0.375(L/mg) Qm = 83.33 (mg/g) |
[115] |
| SS and hazelnut shell | Copper |
Initial concentrations: 20, 40, 50, 60, 75, 80, and 100 mg/L Temperature- 25 ◦C |
Langmuir | 0.999963 |
KL = 0.62 (L/mg) Qm = 43.54 (mg/g) |
[116] |
| nZVI and SS | Chromium |
Initial pollutant concentrations: 20–60 mg/L Adsorbent amount: 4 g/L pH: 2.0 to 6.0 |
Langmuir | 0.9931 |
KL = 3.953 (L/mg) Qm = 13.27 (mg/g) |
[88] |
| Sucrose with waste red mud | Chromium |
Initial pollutant concentrations: 1 to 150 mg/L Adsorbent amount: 0.04 g Temperature: 25 ◦C |
Freundlich | 0.998 |
KF = (3.148 mg g−1 mg1/n L−1/n) n = 1.383 L/mg |
[59] |
| Rape straw and orthophosphate | Lead |
Initial pollutant concentrations: 0.05–6 mmol/L Adsorbent amount- 20 mg Temperature- 25 °C pH = 5.0 ± 0.1 |
Langmuir | 0.975 |
KL = 9.986 (L/mmol) Qm = 1559.3 (mmol/kg) |
[117] |
| Sludge and corncobs (SCB) | Lead |
Amount of adsorbent: 0.1 g Initial pollutant concentrations: 10, 20, 40, 60, 80, and 100 mg/L Temperature: 25 ºC |
Freundlich SCB (300 °C) SCB (500 °C) SCB (700 °C) |
R2 > 0.96 to 0.99 |
KF = 2.2610 (L/mg) 1/n = 0.5288 KF = 2.5540 (L/mg) 1/n = 0.5534 KF = 2.5112 (L/mg) 1/n = 0.5818 |
[98] |
| Rape straw and phosphate rock | Lead |
Adsorbent amount: 0.1 g Initial pollutant concentration:0 − 5 mmol/L Temperature: 25 °C pH: 5.0 ± 0.1 |
Freundlich RS: PR (5:1) RS: PR (2:1) RS: PR (1:1) |
0.946 0.943 0.965 |
KF = 144.5 (mmol/kg) n = 0.340 KF = 152.6 (mmol/kg) n = 0.258 KF = 93.96 (mmol/kg) n = 0.312 |
[109] |
| Halloysite and coconut shell | Lead |
Adsorbent amount: 100 mg Initial pollutant volume: 500 mg/L Temperature- 25 °C |
Langmuir | 0.9827 |
KL = 0.018 ± 0.019 (L/mg) Qm = 833.33 ± 16.71 (mg/g) |
[90] |
| Organic pollutant removal studies | ||||||
|
Hematite-biochar composite (FOC) Pyrite-biochar composite (FSC) |
Norfloxacin |
Adsorbent amount: 0.1 g Initial pollutant concentrations: 2 mg/L to 30 mg/L Temperature: 15 °C, 25 °C, 35 °C pH: 7.0 ± 0.05 |
Freundlich FOC (288.15) FOC (298.15) FOC (308.15) FSC (288.15) FSC (298.15) FSC (308.15) |
0.988 0.9307 0.9879 0.9872 0.9913 0.9874 |
KF = 1.8162 (mg(1−n) Ln/g−1) 1/n = 0.2300 KF = 2.1188 (mg(1−n) Ln/g−1) 1/n = 0.1846 KF = 2.4035 (mg(1−n) Ln/g−1) 1/n = 0.1796 KF = 2.9836 (mg(1−n) Ln/g−1) 1/n = 0.2410 KF = 2.9992 (mg(1−n) Ln/g−1) 1/n = 0.2591 KF = , 3.3243(mg(1−n) Ln/g−1) 1/n = 0.2163 |
[111] |
| SS and bamboo waste | Ciprofloxacin |
Adsorbent amount: 0.25 g Initial pollutant concentrations: 2 mg/L to 30 mg/L Temperature: 30 ºC Time: 24 h pH: 6.0 |
Freundlich | 0.98 |
KF = 2.55 n = 0.51 |
[118] |
| Mixed date pits and olive stones | Dibenzothiophene |
Adsorbent amount: 0.1 g Initial pollutant concentrations: 25 − 200 mg/L Temperature: 30 °C |
Freundlich | 0.9812 |
KF = 1.29 (mg/g) n = 1.2 |
[73] |
| Coal tar pitch and vinasse | Phenol |
Adsorbent amount: 0.025 g Initial pollutant concentrations: 10, 20, 30, 50, and 70 mg/L Temperatures: 15 °C, 25 °C, 35 °C |
Langmuir 288.15 K 298.15 K 308.15 K |
0.997 0.9978 0.9952 |
KL = 0.12 (L/mg) Qm = 42.7 (mg/g) KL = 0.14 (L/mg) Qm = 47.6 (mg/g) KL = 0.16 (L/mg) Qm = 57.5 (mg/g) |
[99] |
|
Corn straw and sawdust Two co-pyrolyzed chars (1:1) at 300º C (BC300A) and 800 ºC (BC800A) |
Atrazine |
Adsorbent amount: 10 mg Initial pollutant concentration: 15–55 mg/L Temperature- 25 °C |
Freundlich |
0.997 0.996 |
KF = 0.0200 ± 0.00565 (mg/ kg)/(mg/L)1/n 1/n = 1.90 ± 0.0746 KF = 0.00300 ± 0.00167 (mg/ kg)/(mg/L)1/n 1/n = 2.55 ± 0.129 |
[119] |
| Saccharina japonica and goethite | Basic blue 41 |
Adsorbent amount: 10 mg Initial pollutant concentration: 2000 mg/L Temperature: 30 °C |
Langmuir | 0.983 |
KL = 0.048 (L/mg) Qm = 803.6 (mg/g) |
[94] |
Kinetic modeling
Kinetic modelling is also essential in designing adsorption systems for water treatment and for batch systems; kinetic curves are usually reproduced as plots of adsorption capacity versus time or contaminant concentration [119]. However, the curve can also be generated in the form of dimensionless contaminant concentration ratio, Ct/C0, in the column outlet and the bed volumes treated in time, t, for fixed-bed studies. This paper will focus on batch adsorption studies following some models, namely, the pseudo-first-order, pseudo-second-order, Avrami, and Elovich, among others (Table 5). The following section will include kinetic batch adsorption studies using co-pyrolyzed char for water treatment, including inorganic and organic contaminants. Table 5 gives an overview summary of when different kinetic or mass transfer models are applicable. The type of mechanism for an adsorption process depends on the nature of the adsorbate relative to the type of surface sites available on the adsorbent. Based on the discussion relating to the application of different types of isotherms, then different adsorption mechanisms may be taking place on the same heterogeneous adsorbent. The chemical/ion exchange sorption processes follow one or more of the following kinetic models: pseudo-first, pseudo-second, Avrami, and Elovich models. For diffusion controlled mechanism processes, these may follow one of the following: Weber-Morris, intraparticle diffusion, Boyd, or Bangham models. Similarly, multi-mechanistic diffusion models have been developed such as the chemisorption-diffusion model, external boundary layer-surface diffusion model, external boundary layer-pore diffusion model, and external boundary layer + pore diffusion + surface diffusion model.
Table 5.
Descriptions of kinetic models
| Kinetic model | Description |
|---|---|
| Pseudo-first order [120] | Adsorption is the difference equilibrium adsorption and the adsorbed capacity at time multiplied by the rate constant of the adsorption. The rate of adsorption is proportional to this driving force linearly |
| Pseudo-second order [121] | Adsorption is the difference between the equilibrium adsorption capacity and the adsorbed capacity multiplied by the rate constant. However, in this model, the rate of adsorption is proportional to the square of the driving force indicating each adsorbate occupies two adsorption sites |
| Elovich [122] | This model looks into this from a chemisorption kinetics perspective by describing the reduction in rate of adsorption due to increase in surface coverage with time |
| Avrami [123] | This model is adapted from Avrami’s kinetic decomposition model which is used to evaluate the reaction rate as the fraction of adsorption at time, and the rate constant. It also considers multiple adsorption sites |
| Weber and Morris [124] | The equation for the Weber and Morris intraparticle diffusion model is based on some assumptions. Firstly, it assumes that the resistance to mass transfer is only significant at the beginning of the diffusion. Secondly, the concentration governs the radial diffusion process, only constant diffusion occurs in the process |
| Diffusion-chemisorption [125] | The diffusion-chemisorption model can be used to describe the sorption of adsorbate onto the heterogeneous surface. The model correlates the rate of change of concentration in solid phase to the rate of mass of transfer of pollutant in fluid phase to the biosorption side |
| Bangham [126] | It is a logarithmic model used to evaluate the ability of pore diffusion in the adsorption process |
| Boyd [127] | This model studies if adsorption is taking place by film diffusion or intra-particle diffusion as it assumes that the boundary of the adsorbent has a significant impact on the diffusion of the solute |
A study [63] considered the removal of cadmium by utilizing co-pyrolyzed char of SS and tea waste. The kinetic adsorption studies only focused on modeling using the pseudo-second-order model. The results revealed that there was a very good correlation to the adsorption data with an R2 value of 0.9. Usually, this model describes a chemisorption process concerning valency forces and ion exchange [63]. The removal of cadmium was also concluded to have taken place using such a mechanism describing the external liquid film diffusion, surface adsorption, and intra-particle diffusion processes accurately.
The following section will discuss studies centered on analyzing data using multiple kinetic adsorption models like pseudo-first order and pseudo-second order models and diffusion mechanistic studies such as the Boyd model and intraparticle diffusion models. The first study focused on three models: pseudo-first-order, pseudo-second-order, and intraparticle diffusion models. The results concluded that the pseudo-second-order model is the most suitable model (R2 = 0.99), concluding its suitability for removing chromium using rice straw and SS co-pyrolyzed char [97]. On the other hand, the second study used these three models in addition to the Boyd model to understand the kinetics of phosphate removal using co-pyrolyzed rice husk functionalized with Mg/Al-calcined layered double hydroxides. The results showed that based on R2 values, the best models were in the order: pseudo-second order > Boyd > intraparticle diffusion > pseudo-first-order [87]. Hence, it was concluded that the data follows a chemisorption mechanism with possibly multiple layer adsorptions on heterogeneous binding sites. Additionally, the diffusion model results suggest that the initial rate-determining step was the boundary layer film diffusion.
However, in literature, the majority of the studies only focus on comparing pseudo-first and pseudo-second-order models. According to a study of lead adsorption by co-pyrolyzed polyethylene and corn stalk, the rate favored the pseudo-second-order model (R2 ≥ 0.9395) over the pseudo-first-order model (R2 ≤ 0.7725) [67]. A similar study used co-pyrolyzed rice wastes and polyethylene for the kinetic adsorption of chromium, and in accordance with the previous research, the preferred model was the pseudo-second order model (R2 ≥ 0.903) [85]. Studies on congo red and methylene blue removal using sludge and coconut shell char [63] and the removal of lead using COS with ammonium polyphosphate co-pyrolyzed char also support this trend by revealing that the kinetic adsorption data correlated more to the pseudo-second-order model [110]. The discussion above concludes that most reaction follows the pseudo-second order reaction proving the involvement of different adsorption sites on a solid substrate randomly colliding with each other during a rate-limiting mechanistic step [128]
Further information on kinetic models and their application will be detailed in Section 3.4.2. Table 6 shows the essential details regarding kinetic adsorption modelling for pollutant removal using co-pyrolyzed chars.
Table 6.
Kinetic studies of water treatment using co-pyrolyzed chars
| Feedstock | Pollutant | Experiment conditions | Best kinetic model | R2/ SSE | Parameter values | Reference |
|---|---|---|---|---|---|---|
| Inorganic pollutant removal studies | ||||||
| SS and walnut shell | Ammonium Phosphate |
Adsorbent amount 0.1 mg 50 mg/L- pollutant concentration Time interval: 1 to 50 h |
Intraparticle diffusion Pseudo-second order |
0.970 0.945 |
K3 = 0.299 C = 0.418 K2 = 0.022 qe = 50.36 |
[113] |
| Nano-zero-valent iron and SS | Arsenic |
Initial pollutant concentration: 20 mg/L Adsorbent amount: 4 g/L Contact time: 24 h Initial pH: 2 |
Liquid film diffusion | 0.9491 |
qe = 3.507 mg/g AF = 0.7078, kf = 0.2298 h−1 |
[89] |
| Molasses and dewatered alum sludge | Arsenic |
Initial pollutant concentration: 300 mg/L, volume: 20 mL Adsorbent amount: 0.3 g Time: 8 h |
Pseudo-second order | 0.97 |
qe = 13.93 mg/g k2 = 0.4 × 10⁻³ g/mg min |
[108] |
|
Poplar bark (SB) and thiourea Poplar saw dust (MB) and thiourea |
Cadmium |
Initial pollutant concentrations:100 mg/L, volume: 20 mL Time interval: 5, 10, 30, 60, 120, 240, 360, 720, and 1440 min Adsorbent amount: 0.08 g (1), 0.10 g (2) pH: 7 |
Pseudo-second order |
0.92 0.99 |
k2 = 0.0184 g/mg/min qe= 12.19 mg/g k2= 0.385 g/mg/min qe = 0.652 mg/g |
[91] |
| Cantaloupes straw and polypropylene | Cadmium |
Adsorbent amount: 0.02 g Initial pollutant concentration: 150 mg/L Temperature- 25 ºC Time intervals: 0, 0.1, 0.25, 0.5, 1, 2, 4, 7, 12, 18, and 24 h |
Pseudo-second order | 0.984 |
qe = 0.0268 mg/g K2 = 0.0303 g/mg min |
[114] |
| SS and hazelnut shell | Copper |
Initial concentrations: 55 mg/L Time interval: 0 min, 10 min, 30 min, 1 h, 2 h, 5 h, 10 h and 24 h Temperature- 25 °C |
Pseudo-second order | 0.9994 |
k2= 43.75 mg/g h qe = 0.652 mg/g |
[116] |
|
SS and hazelnut (magnetized with nanosized γ-Fe2O3) |
Copper |
Adsorbent amount: 1.25 g/L Initial pollutant concentration: 100 mg/L Contact time: 0, 30, 60, 120, 300, 600, 1440 min |
Pseudo-second order | 0.999 |
k2= 0.04 mg/g h qe = 71.43 mg/g |
[115] |
| Nano-zero-valent iron and SS | Chromium |
Initial pollutant concentration: 50 mg/L Adsorbent amount: 4 g/L Contact time: 24 h Initial pH: 2 |
Pseudo-second order | 0.9994 |
qe= 0.2383 mg/g k2 = 11.49 g/mg h |
[88] |
| Sucrose with waste red mud | Chromium |
Initial pollutant concentrations: 10 and 25 mg/L Adsorbent amount: 2 g/L, volume: 20 mL Temperature: 25 °C pH: 2.10 ± 0.05, ionic Shaking speed: 200 rpm Interval time: 5–180 min |
Pseudo-second order |
R2 = 0.990 R2 = 0.996 |
Initial: 10 mg/L qcal = 3.045 mg/g kF = 0.007 mg/(g min1/2) Initial: 25 mg/L qcal = 7.244 mg/g kF = 0.004 mg/(g min1/2) |
[59] |
| Sludge and corncobs (SCB) | Lead |
Amount of adsorbent: 0.1 g Initial pollutant concentrations: 100 mg/L, volume: 25 mL Temperature: 25 ºC Time intervals: 0.5, 1, 2, 4, 8 h |
Pseudo-second order SCB (300 °C) SCB (500 °C) SCB (700 °C) |
R2 > 0.99 |
qe = 24.8611 mg/g K2 = 0.0322 g/mg min qe = 29.1886 mg/g K2 = 0.0322 g/mg min qe = 27.9759 mg/g K2 = 0.0551 g/mg min |
[98] |
| Halloysite and coconut shell | Lead |
Adsorbent amount: 100 mg Initial pollutant concentration: 100 mL Temperature- 25 ºC Time intervals: 1 min, 3, 5, 10, 30, 60, 100, 200, 300, 400, 500, 600, 720, 1080, 1440 min |
Pseudo-second order | 0.999 |
qe = 684.937 ± 2.633 mg/g K2 = 0.00011 ± 0.00002 g/gm min |
[90] |
| Organic pollutant removal studies | ||||||
| SS and bamboo waste | Ciprofloxacin |
Adsorbent amount: 0.25 g Initial pollutant concentrations: 10 mg/L, volume: 100 mL Temperature: 30 ºC Interval times: 0 h, 1 h, 2 h, 5 h, 8 h, 12 h, 24 h |
Pseudo-second order | 0.99 |
Qcal = 4.24 mg/g k2 = 0.63 g/mg h |
[118] |
| Mixed date pits and olive stones | Dibenzothiophene |
Adsorbent amount: 0.3 g Initial pollutant concentrations: 200 mg/L, volume: 25 mL Time intervals: 10–90 min Temperature: 50 °C |
Pseudo-second order | 0.9998 |
qe = 16.10 mg/ g k2 = 0.035 mg/g min |
[73] |
|
Hematite-biochar composite (FOC) Pyrite-biochar composite (FSC) |
Norfloxacin |
Adsorbent amount:0.1 g Initial pollutant concentrations: 2 mg/L to 30 mg/L Time interval: 0 to 250 min pH: 7.0 ± 0.05 |
Pseudo-second order |
0.9990 0.9995 |
Qcal = 1.661 mg/g k2 = 0.1099 g/mg min Qcal = 1.973 mg/g k2 = 0.2251 g/mg min |
[93] |
| Coal tar pitch and vinasse | Phenol |
Adsorbent amount: 0.025 g Initial pollutant concentrations: 50 mg/L Temperatures: 25 ºC |
Pseudo-second order | 0.9996 |
qe= 39.4 mg/g k2 = 0.0009 g/mg min |
[59] |
|
Corn straw and sawdust Two co-pyrolyzed chars (1:1) at 300 ºC (BC300A) and 800 ºC (BC800A) |
Atrazine |
Adsorbent amount: 20 mg Initial pollutant concentration: 25 mg/L Temperature: 25 ºC |
Pseudo-first order |
0.987 0.961 |
qe,cal = 6.76 ± 0.0763 mg/g k1 = 1.07 ± 0.0628 h−1 qe,cal = 5.23 ± 0.0855 mg/g k1 = 2.43 ± 0.2407 h−1 |
[119] |
Temperature and thermodynamic analysis
As previously mentioned, temperature plays a key role in the adsorption process. In order to conduct the temperature and thermodynamic analysis, the isotherm parameters found at different temperatures after modelling are used to calculate the Gibbs free energy after calculating the thermodynamic equilibrium constant. Finally, the Van’t Hoff plot is constructed to understand and evaluate the changes in entropy and enthalpy [100]. Table 7 shows nine studies, which focused on the thermodynamic analysis for the adsorption of pollutants from water using co-pyrolyzed chars (some activated, some non-activated). The table contains ΔGº, ΔH º, and ΔSº values all calculated from the above-mentioned method.
Table 7.
Thermodynamic studies of water treatment using co-pyrolyzed chars
| Feedstock char | Pollutant | Temperature (K) | ΔGº (kJ/mol) | ΔH º (kJ/mol) | ΔSº kJ/ (mol.K) | Remarks | Reference |
|---|---|---|---|---|---|---|---|
| Sucrose and red mud | Chromium |
298 308 318 |
-3.258 -6.545 -9.779 |
89.02 | 0.297 | Spontaneous, chemical sorption, increase in system irregularity | [59] |
| SS and tea waste | Cadmium |
298 308 318 |
-0.9479 -1.2971 -1.8200 |
32.3036 | 122.6315 | Spontaneous, physical sorption, increase in system irregularity | [93] |
| SS and rice straw | Chromium |
283 298 313 |
-0.9 -1.6 -2.7 |
15.8 | 58.9 | Spontaneous, physical sorption, increase in system irregularity | [97] |
| SS and walnut shell |
Ammonium Phosphate |
298 303 308 313 318 298 303 308 313 318 |
6.35 6.89 7.35 8.11, 8.62 − 1.47 − 2.35 − 3.15 − 4.11 − 3.43 |
− 27.93 36.39 |
-0.115 0.128 |
Non-spontaneous, physical sorption, decrease in system regularity Spontaneous, physical sorption, increase in system irregularity |
[113] |
|
Hematite-biochar composite Pyrite-biochar composite |
Norfloxacin |
288.15 298.15 308.15 288.15 298.15 308.15 |
− 12.9345 − 15.7507 − 17.2404 − 20.5437 − 20.3434 − 19.7422 |
49.2746 − 31.9914 |
0.2168 − 0.0396 |
Spontaneous, physical sorption, increase in system irregularity spontaneous, physical sorption, decrease in system regularity |
[111] |
| Nano-zero-valent iron and SS | Chromium |
288 298 303 313 318 |
-5.947 -6.529 -7.156 -8.308 -11.43 |
41.93 | 163.8 | Spontaneous, chemical sorption, increase in system irregularity | [88] |
| Coal tar pitch and vinasse | Phenol |
288.15 (10 ppm) 298.15 308.15 288.15 (20 ppm) 298.15 308.15 288.15 (30 ppm) 298.15 308.15 288.15 (50 ppm) 298.15 308.15 288.15 (70 ppm) 298.15 308.15 |
-9.2 -9.5 -9.8 -11.3 -11.7 -12.1 -8.9 -9.2 -9.6 -8.3 -8.6 -8.9 -8.0 -8.3 -8.6 |
2.6 6.7 2.8 3.0 3.2 |
31.9 39.3 31.0 29.0 27.9 |
Spontaneous, physical sorption, increase in system irregularity | [111] |
| Nano-zero-valent iron and SS | Arsenic |
298 303 308 313 318 |
-5047.4 -6304.4 -6922.0 -8302.6 -9754.6 |
63.03 | 228.2 | Spontaneous, chemical sorption, increase in system irregularity | [89] |
| SS and coconut shell |
Methylene blue Congo red |
One-stage 283.15 298.15 313.15 Two-stage 283.15 298.15 313.15 |
-16.95 ± 0.15 -20.39 ± 0.22 -23.12 ± 0.14 -19.77 ± 0.15 -23.65 ± 0.15 -27.31 ± 0.13 |
40.02 ± 2.39 | 201.10 ± 8.02 | Spontaneous, chemical sorption, increase in system irregularity | [63] |
The values give information regarding the adsorption system. Negative ∆G values indicate that the adsorption process is spontaneous; furthermore, it is also proposed that a ∆H value less than 80 kJ/mol represents a physical adsorption system [59]. Alternatively, a higher ∆H value generally between 80 and 400 kJ/mol implies a chemical adsorption system [59]. The results of this study can be seen in Table 7, using red mud and sucrose for chromium removal. The higher the negative value, the more spontaneous is the reaction (observed with an increase in temperature). A similar trend was also observed in a study by Fan et al. (2018) utilizing SS and tea leaf chars for the removal of cadmium from water as shown in Table 7. The ∆H values between 80 and 400 kJ/mol suggest an endothermic process with chemical adsorption taking place [59]. Finally, a positive ∆S value indicates increased randomness and disorder at the adsorbate-adsorbent interface. The results of the study revealed a ∆H value lesser than 80 kJ/mol and a positive ∆S value indicating physical adsorption [59]. The remarks of the other studies in Table 7 are based on this study.
Adsorption mechanisms
Some studies regarding pollutant adsorption mechanisms of co-pyrolyzed chars will be discussed in this section. A study used Fourier-transform infrared spectroscopy (FTIR), X-ray powder diffraction (XRD), scanning electron microscopy with energy-dispersive X-ray analysis (SEM–EDX), and zeta potential results analyses to confirm adsorption mechanisms, including electrostatic attraction, complexation, and precipitation involved in the removal of chromium by co-pyrolyzed sucrose and waste red mud. FTIR results revealed that -OH, C = O, and C-O bands had completely disappeared potentially due to the surface complexation with the chromium ions [59]. Additionally, XRD revealed that there was a presence of Cr2FeO4 and Cr2O3 peaks displaying the redox reaction between iron in the adsorbent and chromium ions (which then precipitated to the adsorbent surface). Furthermore, SEM–EDX analysis also supported the potential mechanism that drove the adsorption process.
The next study concluded ion exchange to be the removal mechanism for chromium by co-pyrolyzed rice waste and polyethylene [59]. Upon ion analysis of the wastewater after adsorption, an increase in the cation concentration (K = 24.7 ppm) and a decrease in the chromium concentration (72.7 ppm) from wastewater was observed; this study proved that most of the chromium is removed by ion exchange with potassium. Therefore, the pore characteristics also must have played a key role in pollutant removal.
Furthermore, another study focused on understanding the mechanism of removal of lead using chars produced from co-pyrolyzing skins, pith, and leaves with polyethylene. The characterization studies, applying FTIR, XRD, SEM, zeta potential analysis, concluded that the adsorption mechanisms were taking place in the form of Pb–O or hydroxyl binding in addition to ion exchange. Since the biochar was activated by KOH, the adsorption resulted in the precipitation of K2Pb2O3 via complexation. The activation also brought some hydroxyl groups leading to the formation of Pb3(CO3)2(OH)2 and additionally, the carbonate from the char bonded with lead to form PbCO3. These results were in accordance with the experiments results obtained at the end of the study as well [67].
A similar study mainly focused on FTIR, XRD, and SEM–EDX to understand the mechanism for the removal of chromium by nZVI and SS co-pyrolyzed char [88]. The mechanism mainly involved the majority of the Cr (VI) being directly removed by the magnetic biochar, some getting reduced to Cr (III) and then removed by adsorption. The electrons were supplied by Fe2+, Fe0 and the organics in the produced char. Further modelling also revealed that the rate-controlling steps for chromium removal were liquid-film/intra-particle diffusions and liquid-film diffusion/chemical reaction processes. A follow-up study was conducted using the same co-pyrolyzed char to remove arsenic. Similar to the previous research, the potential mechanism was aligned to a liquid film diffusion model based on chemical reaction as arsenic was immobilized on the co-pyrolyzed char by speciation of As-O-Fe. The removal rate of arsenic based on all formerly mentioned analytical tools proved that the mechanism involved active participation of iron-containing substances and organics in the char in the removal process [89].
A further study [93] analyzed the removal of cadmium using SS and tea waste co-pyrolyzed char by FTIR analysis. The peaks that reduced or disappeared after adsorption concluded that the following functional groups: –OH, –C = C or C = O, –CO, –CH aided in the binding of cadmium to the co-pyrolyzed char through ion exchange, surface complexation, and cation-p interaction.
Table 8 presents and reviews the key features of four other co-pyrolysis adsorption mechanism studies using molecular analytical tools (Figs. 3, 4, 5, and 6). As seen in the previous studies, analytical tools such as FTIR, XRD, SEM, in addition to XPS (X-ray photoelectron spectroscopy) usually represent what is taking place during adsorption. Understanding the mechanism will help design further experiments and application of these adsorbents.
Table 8.
Proposed adsorption mechanisms of water treatment using co-pyrolyzed chars
| Feedstock | Suggested mechanism | Analytical tool | Analysis result | Reference |
|---|---|---|---|---|
| Rice husk with Mg/Al-calcined layered double hydroxides | The FTIR and XRD results showed a strong P-O bond which reveals a strong indication between the char and phosphate by ligand exchange in the form of monodentate and bidentate inner-sphere surface complexes |
XRD FTIR |
See Fig. 3 |
[87] Copyright, 2019, Elsevier |
| COS and polyphosphate |
The modified char showed multiple functional groups in the co-pyrolyzed char including –NH/-OH, C + C/C = O, P = O, P–N–C, and P–O–C, and these spectra also reveal that the bands associated with -N–H/-O–H, –C = O, -O-C = O, and -O–P–O groups of the char shifted and the areas below it decreased The increased functional groups sped up the adsorption process and high adsorption capacities |
FTIR | See Fig. 4 |
[110] Copyright, 2020, Elsevier |
| Pyrite-biochar composites (FSC) than hematite-biochar composites (FOC) |
The FTIR spectrum analysis showed that both the chars had a slight shift after adsorption of norfloxacin specifically at 3426, 1588, 1099, 807, and 465 cm−1, corresponding to -OH, C = C, C-O, C-H, and Si–O) — the reduction in C = C, C-O, C–C peaks indicates the π–π connections between norfloxacin and the chars The XRD analysis after adsorption revealed that the difference in peaks was only small, concluding good stability |
FTIR XRD |
See Fig. 5 |
[111] Copyright, 2019, Elsevier |
| Bamboo and bromine flame retardant |
The XPS spectra of the co-pyrolyzed char before and after the removal of mercury by the co-pyrolyzed char — results revealed a strong peak at 102.3 ± 0.2 eV, signifying Hgº for the fresh char. However, a new peak representing Hg2+ was found instead for the used char Additionally, another peak representing C–Br decreased after adsorption, signifying that Br- converted to Hg0 after adsorption |
XPS | See Fig. 6 |
[96] Copyright, 2021, Elsevier |
Fig. 3.

Before and after adsorption (A) XRD spectra. (B) FTIR spectra
Fig. 4.

FTIR spectra of fresh and used co-pyrolyzed char
Fig. 5.

Before and after adsorption (A) XRD spectra (B) FTIR spectra
Fig. 6.

XPS spectra of fresh and used co-pyrolyzed char
Regeneration studies
Concerning the study of reusability of the chars, regeneration experiments focus on repeated cycles of adsorption and desorption to achieve greater economic use from the char and environmental sustainability. Several chemicals including nitric acid, sulfuric acid, hydrochloric acid, chelating agents like EDTA, and distilled water are usually considered [129]. Literature studies using some of these eluents and a few others are discussed.
A study on chromium adsorption by red mud and sucrose co-pyrolyzed chars assessed the use reusability of the magnetic biochar [59]. During desorption, a range of reagents was used for elution experiments using NaOH, Na2CO3, HNO3, demonstrating desorption performances of 44.6%, 20.0%, and 3.9%, respectively. It was also found that the adsorbed chromium was stable on the char in both acidic and neutral conditions. All three adsorption and desorption rounds showed no change in the adsorption capacity, although, at the end of the fourth cycle, a 9% reduction in removal efficiency was detected [59].
Another study conducted five cycles of adsorption and desorption using co-pyrolyzed rice straw and SS char using NaOH elution [97]; unlike the previous study, there was a reduction in the removal efficiencies at each cycle. The first cycle removed 90.8% of chromium. The subsequent four cycles removed 79.1%, 70.8%, 66.2%, and 61.3%, individually. The steady decrease in the removal percentages was attributed to a reduction in the adsorbent and pore structures in addition to irreversible saturation of adsorption sites. However, the removal rate, 61.3%, remained a fixed constant in the following cycles, proving a good reusability feature of the char [97]. Another study using rice husk (RH)-derived co-pyrolyzed biochar with Mg/Al-calcined layered double hydroxide chars for the removal of phosphate conducted 5 cycles of adsorption and desorption using NaOH as an eluent. They demonstrated similar results to the previous study [85]. There was a steady decrease in the removal percentages remaining just above 80% even after 5 cycles, speculated to be due to the replacement of small anions like OH or CO32− for phosphate ions. Similar promising results were shown by halloysite and coconut shell co-pyrolyzed char even after four cycles of lead adsorption–desorption with removal rates greater than 95% [90]
One study considered the removal of norfloxacin using hematite-biochar composites (FOC) and pyrite-biochar composites (FSC) by conducting five cycles of adsorption and desorption using methanol as the eluent [72]. The results demonstrated a constant decrease in the pollutant removal plateauing at 75% for FOC and 83% for FSC after several cycles. The recovery of adsorbents was found to be 90% after each of the cycles. This work concluded the good regeneration and recycling capabilities of the adsorbents [111]. Furthermore, a study on the regeneration of co-pyrolyzed COS and ammonium polyphosphate showed reduced removal rates with an increasing number of cycles with sodium acetate elution and a removal capacity of 74.2 mg/g stabilized after four cycles [110].
The activated char produced from olive stones and mixed date pits was used to remove dibenzothiophene by five consecutive cycles of adsorption and desorption using n-hexane as the eluent. The first cycle removed 90.01%, which reduced to 85.02% during the final cycle, therefore showing good elimination of DBT due to the presence of active sites even at the end of the fifth cycle [73]. Some other studies show relatively lower removal efficiencies (between 40 and 60%) after 4 cycles of copper adsorption–desorption by co-pyrolyzed chars [89, 118].
Figure 7 shows the approximate removal efficiencies (first and final cycles) of some of the studies discussed above. Regeneration studies are essential to know the reusability of the adsorbent, making it more sustainable.
Fig. 7.

Regeneration studies of water treatment using co-pyrolyzed chars
Real water studies
It is imperative to conduct detailed studies on how co-pyrolyzed chars perform on real water samples and not just synthetic waters. To date, only two studies focused on such work while utilizing co-pyrolyzed chars for water treatment. The first study focused on the removal of chromium using co-pyrolyzed red mud and sucrose considering the same initial concentration as the isotherm analysis providing the best conditions, which were 2 g/L of adsorbent, 2.10 ± 0.05 of initial pH, contact time of 120 min, and a shaking speed of 200 rpm at 25 °C. The results aligned with the synthetic chromium solution demonstrating 20.41 mg/g adsorption capacity. This proved that the char applies to real water samples without any adverse effect [59]. On the other hand, a study using pyrolyzed chars of wood and plastic wastes for aquaculture wastewater treatment found the phosphate and turbidity removal were highest with removal percentages of 86.36% and 78.25% respectively (for the non-activated biochar) [130]. In general, this study also concluded no significant difference in removal rates of pollutants between activated and non-activated char samples.
Challenges and future prospects
Research activities related to water treatment using co-pyrolyzed chars have some challenges. As a whole, research conducted on co-pyrolysis focuses more on fuel production rather than chars; therefore, more studies are needed to focus on the production of adsorbents that can be used for water treatment. Furthermore, more research needs to be focused on the co-pyrolysis of biomass with other wastes like plastics as a representation of municipal wastes together. Optimizing the ratios and understanding the effect of mixing on pyrolysis and its product distributions is essential for successful application. This sustainable approach will reduce the time and energy consumed compared to the individual pyrolysis [22]. It would also be interesting to compare the quality of chars and adsorption capacities of co-pyrolyzed waste and mixed single biochars produced under the same conditions [22]. There is scope for testing different variables when it comes to co-pyrolysis, including the particle size, heating rate, and nitrogen gas flow rate.
Furthermore, adsorption capacities of the adsorbents described in Section 2.1 can be significantly improved by activation to be more applicable for water treatment [12]. There is a need to explore and compare more activation techniques to find the most suitable method. This will also vary depending on the biochar feedstock type and the water pollutant removal application.
Regarding water treatment, understanding the bonding mechanisms of the pollutants in addition to understanding the condition of the adsorbents before and after treatment is crucial for further application — very few current studies focus on this. Similarly, recent review papers on utilizing treated wastes for water treatment suggest more research on the desorption and regeneration of the used adsorbents [22, 131, 132]. The recovery of precious pollutants like heavy metals is also recommended following a sustainable and cyclic economic pathway [88]. Most importantly, for effective adsorbent testing, wastewater effluents [3] comprising the more typical multicomponent mixture of pollutants need to be tested [88] rather than simulated water containing a single pollutant. Furthermore, emphasis should be given to solving the problems on removing emergent contaminants that are harmful even at low concentrations [131].
In recent times, especially in the era of COVID-19, plastics and microplastics are receiving a lot of attention as pollutants. There are several studies discussing the use of biochar for the removal of microplastics. One such study focused on pyrolyzed and steam activated pine bark and spruce bark samples showing good removal of large microplastic particles [133]. Another study showed excellent polystyrene microplastic removal capabilities when using magnetic sawdust biochars facilitated by electrostatic and chemical bonding interactions [134]. However, more research on using co-pyrolyzed char for the same application needs to be conducted.
An adsorbent that is versatile and can remove both organic and inorganic pollutants will also be advantageous [132]. This is potentially achievable since certain co-pyrolyzed biomass adsorbents are known to adsorb both classes of compounds (Section 2.2). Designing a reactor for these modern adsorption applications [132] for large-scale/pilot scale studies needs to be performed using the actual industrial conditions [131], for example, contaminant mix and the actual pollutant concentrations, which are mostly not the same as the individual isotherm qmax due to competition from contaminants. Finally, there is a need to address the lack of techno-economic analysis data required for employing and implementing the use of these adsorbents in water treatment. Hence, there is an urgent need to address this in research, using application of process simulation studies to investigate the effect of varying parameters.
Conclusion
The review summarizes recent co-pyrolysis studies of biomass with other feedstock such as lignocellulosic wastes, plastics, and some other biomass. It is a comprehensive review of experimental studies focusing a whole section on the activation of co-pyrolyzed chars for producing better quality activated chars/activated carbons for water treatment (reporting the surface area and pore volume when provided and the adsorption capacities). Very attractive studies have been reported — one study on co-pyrolyzed cyanobacteria and plastics demonstrated a surface area of 2135 m2/g upon alkali activation with K2CO3. Furthermore, the effects of various parameters including pH, temperature, contact time, and char dosage have been analyzed. Section 2.2.3 discussed research conducted using isotherm models, kinetic models, and thermodynamic analysis. These studies provide significant, although sometimes limited, insights on mechanisms and rates regarding how co-pyrolyzed chars can be used as adsorbents for water treatment purification. Furthermore, the need for further research into adsorption mechanisms, regeneration or reusability, and real water studies to understand the actual applicability of co-pyrolyzed chars has been described. Most studies discussed in this paper favored the Freundlich model for isotherm equilibrium modelling and the pseudo second-order model for the kinetic modelling; a wider range of models are required to enhance the accuracy of the design parameters used for the treatment system design. Additionally, the thermodynamic analysis showed that most adsorption reactions are spontaneous, and the analytical analysis using FTIR, XPS, SEM, and XRD provides good evidence for the adsorption mechanisms. The few studies on reusability studies show that the chars can be used for at least 4 to 5 regeneration cycles and that regeneration typically plateaus.
Acknowledgements
The authors would also like to express thanks to Qatar National Library for access to articles.
Author contribution
Shifa Zuhara: Conceptualization, collection of literature, formal analysis, writing- original draft. Hamish Mackey: Formal analysis, review, and editing. Tareq Al-Ansari: Formal analysis, review, and editing. Gordon McKay: Supervision, reviewing, and editing.
Funding
Open Access funding provided by the Qatar National Library. The authors would like to thank Qatar National Research Fund for supporting this research under the National Priorities Research Program Award Number NPRP12S-0325–190443. Any opinions, findings and conclusions, or recommendations expressed in this material are those of the authors and do not necessarily reflect the views of Hamad Bin Khalifa University or Qatar Foundation.
Declarations
Conflict of interest
The authors declare no competing interests.
Footnotes
Publisher's note
Springer Nature remains neutral with regard to jurisdictional claims in published maps and institutional affiliations.
References
- 1.Qadir M, Drechsel P, Jiménez Cisneros B, et al. Global and regional potential of wastewater as a water, nutrient and energy source. Nat Res Forum. 2020;44:40–51. doi: 10.1111/1477-8947.12187. [DOI] [Google Scholar]
- 2.Rashid R, Shafiq I, Akhter P, et al. A state-of-the-art review on wastewater treatment techniques: the effectiveness of adsorption method. Environ Sci Pollut Res. 2021;28:9050–9066. doi: 10.1007/s11356-021-12395-x. [DOI] [PubMed] [Google Scholar]
- 3.Crini G, Lichtfouse E, Wilson LD, Morin-Crini N. Conventional and non-conventional adsorbents for wastewater treatment. Environ Chem Lett. 2019;17:195–213. doi: 10.1007/s10311-018-0786-8. [DOI] [Google Scholar]
- 4.Sharma KD, Jain S. Municipal solid waste generation, composition, and management: the global scenario. Social Respon J. 2020;16:917–948. doi: 10.1108/SRJ-06-2019-0210. [DOI] [Google Scholar]
- 5.Elawad E, Agied M, Althani M, Abusin S (2018) Towards sustainable food system in Qatar: household food waste and consumption behavior. J Food Nutr Res 6:200–204. 10.12691/jfnr-6-4-1
- 6.Clarke SF, Nawaz W, Skelhorn C, Amato A (2017) Towards a more sustainable waste management in Qatar: retrofitting mindsets and changing behaviours. QScience Connect 2017. 10.5339/connect.2017.qgbc.4
- 7.Shahbaz M, AlNouss A, Ghiat I, et al. A comprehensive review of biomass based thermochemical conversion technologies integrated with CO2 capture and utilisation within BECCS networks. Resour Conserv Recycl. 2021;173:105734 . doi: 10.1016/j.resconrec.2021.105734. [DOI] [Google Scholar]
- 8.Elkhalifa S, Al-Ansari T, Mackey HR, McKay G. Food waste to biochars through pyrolysis: a review. Resour Conserv Recycl. 2019;144:310–320. doi: 10.1016/j.resconrec.2019.01.024. [DOI] [Google Scholar]
- 9.Al-Salem SM, Antelava A, Constantinou A, et al. A review on thermal and catalytic pyrolysis of plastic solid waste (PSW) J Environ Manage. 2017;197:177–198. doi: 10.1016/j.jenvman.2017.03.084. [DOI] [PubMed] [Google Scholar]
- 10.Anuar Sharuddin SD, Abnisa F, Wan Daud WMA, Aroua MK. A review on pyrolysis of plastic wastes. Energy Convers Manage. 2016;115:308–326. doi: 10.1016/j.enconman.2016.02.037. [DOI] [Google Scholar]
- 11.Ambaye TG, Vaccari M, van Hullebusch ED, et al. Mechanisms and adsorption capacities of biochar for the removal of organic and inorganic pollutants from industrial wastewater. Int J Environ Sci Technol. 2021;18:3273–3294. doi: 10.1007/s13762-020-03060-w. [DOI] [Google Scholar]
- 12.Gopu C, Gao L, Volpe M, et al. Valorizing municipal solid waste: waste to energy and activated carbons for water treatment via pyrolysis. J Anal Appl Pyrol. 2018;133:48–58. doi: 10.1016/j.jaap.2018.05.002. [DOI] [Google Scholar]
- 13.Reza MS, Yun CS, Afroze S, et al. Preparation of activated carbon from biomass and its’ applications in water and gas purification, a review. Arab J Basic Appl Sci. 2020;27:208–238. doi: 10.1080/25765299.2020.1766799. [DOI] [Google Scholar]
- 14.Praveen S, Gokulan R, Pushpa TB, Jegan J. Techno-economic feasibility of biochar as biosorbent for basic dye sequestration. J Indian Chem Soc. 2021;98:100107 . doi: 10.1016/j.jics.2021.100107. [DOI] [Google Scholar]
- 15.Li W, Mu B, Yang Y. Feasibility of industrial-scale treatment of dye wastewater via bio-adsorption technology. Biores Technol. 2019;277:157–170. doi: 10.1016/j.biortech.2019.01.002. [DOI] [PubMed] [Google Scholar]
- 16.Gwenzi W, Chaukura N, Noubactep C, Mukome FND. Biochar-based water treatment systems as a potential low-cost and sustainable technology for clean water provision. J Environ Manage. 2017;197:732–749. doi: 10.1016/j.jenvman.2017.03.087. [DOI] [PubMed] [Google Scholar]
- 17.Gwenzi W, Chaukura N, Mukome FND, et al. Biochar production and applications in sub-Saharan Africa: opportunities, constraints, risks and uncertainties. J Environ Manage. 2015;150:250–261. doi: 10.1016/j.jenvman.2014.11.027. [DOI] [PubMed] [Google Scholar]
- 18.Mariyam S, Shahbaz M, Al-Ansari T, et al. A critical review on co-gasification and co-pyrolysis for gas production. Renew Sustain Energy Rev. 2022;161:112349 . doi: 10.1016/j.rser.2022.112349. [DOI] [Google Scholar]
- 19.Palansooriya KN, Yang Y, Tsang YF, et al. Occurrence of contaminants in drinking water sources and the potential of biochar for water quality improvement: a review. Crit Rev Environ Sci Technol. 2020;50:549–611. doi: 10.1080/10643389.2019.1629803. [DOI] [Google Scholar]
- 20.Teoh SK, Li LY. Feasibility of alternative sewage sludge treatment methods from a lifecycle assessment (LCA) perspective. J Clean Prod. 2020;247:119495 . doi: 10.1016/j.jclepro.2019.119495. [DOI] [Google Scholar]
- 21.Yang H, Ye S, Zeng Z et al (2020) Utilization of biochar for resource recovery from water: A review. Chem Eng J 397. 10.1016/j.cej.2020.125502
- 22.Ahmed MJ, Hameed BH. Insight into the co-pyrolysis of different blended feedstocks to biochar for the adsorption of organic and inorganic pollutants: a review. J Clean Prod. 2020;265:121762 . doi: 10.1016/j.jclepro.2020.121762. [DOI] [Google Scholar]
- 23.Wong S, Ngadi N, Inuwa IM, Hassan O. Recent advances in applications of activated carbon from biowaste for wastewater treatment: a short review. J Clean Prod. 2018;175:361–375. doi: 10.1016/j.jclepro.2017.12.059. [DOI] [Google Scholar]
- 24.Burra KG, Gupta AK. Kinetics of synergistic effects in co-pyrolysis of biomass with plastic wastes. Appl Energy. 2018;220:408–418. doi: 10.1016/j.apenergy.2018.03.117. [DOI] [Google Scholar]
- 25.Li Y, Yu H, Liu L, Yu H. Application of co-pyrolysis biochar for the adsorption and immobilization of heavy metals in contaminated environmental substrates. J Hazard Mater. 2021;420:126655 . doi: 10.1016/j.jhazmat.2021.126655. [DOI] [PubMed] [Google Scholar]
- 26.He W, Yin G, Zhao Y, et al. Interactions between free radicals during co-pyrolysis of lignite and biomass. Fuel. 2021;302:121098 . doi: 10.1016/j.fuel.2021.121098. [DOI] [Google Scholar]
- 27.Wang X, Chang VWC, Li Z, et al. Co-pyrolysis of sewage sludge and organic fractions of municipal solid waste: synergistic effects on biochar properties and the environmental risk of heavy metals. J Hazard Mater. 2021;412:125200 . doi: 10.1016/j.jhazmat.2021.125200. [DOI] [PubMed] [Google Scholar]
- 28.Tang S, Zheng C, Zhang Z. Effect of inherent minerals on sewage sludge pyrolysis: Product characteristics, kinetics and thermodynamics. Waste Manage. 2018;80:175–185. doi: 10.1016/j.wasman.2018.09.012. [DOI] [PubMed] [Google Scholar]
- 29.de Souza Souza C, Bomfim MR, de Conceição de Almeida M, et al. Induced changes of pyrolysis temperature on the physicochemical traits of sewage sludge and on the potential ecological risks. Sci Rep. 2021;11:1–13. doi: 10.1038/s41598-020-79658-4. [DOI] [PMC free article] [PubMed] [Google Scholar]
- 30.Zhang X, Zhao B, Liu H, et al. Effects of pyrolysis temperature on biochar’s characteristics and speciation and environmental risks of heavy metals in sewage sludge biochars. Environ Technol Innov. 2022;26:102288 . doi: 10.1016/j.eti.2022.102288. [DOI] [Google Scholar]
- 31.Quan C, Gao N (2016) Copyrolysis of biomass and coal: a review of effects of copyrolysis parameters, product properties, and synergistic mechanisms. Biomed Res Int 2016. 10.1155/2016/6197867 [DOI] [PMC free article] [PubMed]
- 32.Wang Y, Li Y, Zhang C, et al. A study on co-pyrolysis mechanisms of biomass and polyethylene via ReaxFF molecular dynamic simulation and density functional theory. Process Saf Environ Prot. 2021;150:22–35. doi: 10.1016/j.psep.2021.04.002. [DOI] [Google Scholar]
- 33.Xu S, Hu Y, Wang S, et al. Investigation on the co-pyrolysis mechanism of seaweed and rice husk with multi-method comprehensive study. Renewable Energy. 2019;132:266–277. doi: 10.1016/j.renene.2018.08.002. [DOI] [Google Scholar]
- 34.Wen Y, Xie Y, Jiang C, et al. Products distribution and interaction mechanism during co-pyrolysis of rice husk and oily sludge by experiments and reaction force field simulation. Biores Technol. 2021;329:124822 . doi: 10.1016/j.biortech.2021.124822. [DOI] [PubMed] [Google Scholar]
- 35.Li C, Sun Y, Dong D, et al. Co-pyrolysis of cellulose/lignin and sawdust: Influence of secondary condensation of the volatiles on characteristics of biochar. Energy. 2021;226:120442 . doi: 10.1016/j.energy.2021.120442. [DOI] [Google Scholar]
- 36.Suo F, You X, Yin S, et al. Preparation and characterization of biochar derived from co-pyrolysis of Enteromorpha prolifera and corn straw and its potential as a soil amendment. Sci Total Environ. 2021;798:149167 . doi: 10.1016/j.scitotenv.2021.149167. [DOI] [PubMed] [Google Scholar]
- 37.Ali L, Palamanit A, Techato K, et al. Valorization of rubberwood sawdust and sewage sludge by pyrolysis and co-pyrolysis using agitated bed reactor for producing biofuel or value-added products. Environ Sci Pollut Res. 2021 doi: 10.1007/s11356-021-15283-6. [DOI] [PubMed] [Google Scholar]
- 38.Zaker A, Chen Z, Zaheer-Uddin M, Guo J. Co-pyrolysis of sewage sludge and low-density polyethylene – a thermogravimetric study of thermo-kinetics and thermodynamic parameters. J Environ Chem Eng. 2021;9:104554 . doi: 10.1016/j.jece.2020.104554. [DOI] [Google Scholar]
- 39.Yu J, Wu Z, An X, et al. Trace metal elements mediated co-pyrolysis of biomass and bentonite for the synthesis of biochar with high stability. Sci Total Environ. 2021;774:145611 . doi: 10.1016/j.scitotenv.2021.145611. [DOI] [PubMed] [Google Scholar]
- 40.Fan Y, Yang B, Zhang B, et al. Synergistic effects from fast co-pyrolysis of lignin with low-rank coal: on-line analysis of products distribution and fractal analysis on co-pyrolysis char. J Energy Inst. 2021;97:152–160. doi: 10.1016/j.joei.2021.04.009. [DOI] [Google Scholar]
- 41.Jerzak W, Bieniek A, Magdziarz A. Multifaceted analysis of products from the intermediate co-pyrolysis of biomass with Tetra Pak waste. Int J Hydrogen Energy. 2021 doi: 10.1016/j.ijhydene.2021.06.202. [DOI] [Google Scholar]
- 42.Samal B, Vanapalli KR, Dubey BK, et al. Char from the co-pyrolysis of Eucalyptus wood and low-density polyethylene for use as high-quality fuel: influence of process parameters. Sci Total Environ. 2021;794:148723 . doi: 10.1016/j.scitotenv.2021.148723. [DOI] [PubMed] [Google Scholar]
- 43.Samal B, Vanapalli KR, Dubey BK, et al. Influence of process parameters on thermal characteristics of char from co-pyrolysis of eucalyptus biomass and polystyrene: Its prospects as a solid fuel. Energy. 2021;232:121050 . doi: 10.1016/j.energy.2021.121050. [DOI] [Google Scholar]
- 44.Vanapalli KR, Bhattacharya J, Samal B, et al. Inhibitory and synergistic effects on thermal behaviour and char characteristics during the co-pyrolysis of biomass and single-use plastics. Energy. 2021;235:121369 . doi: 10.1016/j.energy.2021.121369. [DOI] [Google Scholar]
- 45.Singh S, Patil T, Tekade SP, et al. Studies on individual pyrolysis and co-pyrolysis of corn cob and polyethylene: thermal degradation behavior, possible synergism, kinetics, and thermodynamic analysis. Sci Total Environ. 2021;783:147004 . doi: 10.1016/j.scitotenv.2021.147004. [DOI] [PubMed] [Google Scholar]
- 46.Gu W, Guo J, Bai J et al (2021) Co-pyrolysis of monobasic potassium phosphate and plastic processing sludge: characteristics and environmental risks of potentially toxic elements. Ecotoxicol Environ Saf 208. 10.1016/j.ecoenv.2020.111434 [DOI] [PubMed]
- 47.Saleem J, Bin Shahid U, Hijab M, et al. Production and applications of activated carbons as adsorbents from olive stones. Biomass Conversion and Biorefinery. 2019;9:775–802. doi: 10.1007/s13399-019-00473-7. [DOI] [Google Scholar]
- 48.Gao Y, Yue Q, Gao B, Li A. Insight into activated carbon from different kinds of chemical activating agents: a review. Sci Total Environ. 2020;746:141094 . doi: 10.1016/j.scitotenv.2020.141094. [DOI] [PubMed] [Google Scholar]
- 49.Heidarinejad Z, Dehghani MH, Heidari M, et al. Methods for preparation and activation of activated carbon: a review. Environ Chem Lett. 2020;18:393–415. doi: 10.1007/s10311-019-00955-0. [DOI] [Google Scholar]
- 50.Pallarés J, González-Cencerrado A, Arauzo I. Production and characterization of activated carbon from barley straw by physical activation with carbon dioxide and steam. Biomass Bioenerg. 2018;115:64–73. doi: 10.1016/j.biombioe.2018.04.015. [DOI] [Google Scholar]
- 51.Afrane G, Achaw OW. Effect of the concentration of inherent mineral elements on the adsorption capacity of coconut shell-based activated carbons. Biores Technol. 2008;99:6678–6682. doi: 10.1016/j.biortech.2007.11.071. [DOI] [PubMed] [Google Scholar]
- 52.Nowicki P. The effect of mineral matter on the physicochemical and sorption properties of brown coal-based activated carbons. Adsorption. 2016;22:561–569. doi: 10.1007/s10450-015-9729-x. [DOI] [Google Scholar]
- 53.Wang Y, Yang H, Jin L, et al. Effect of mineral in coal on preparation of activated carbon for methane decomposition to hydrogen. Fuel. 2019;258:116138 . doi: 10.1016/j.fuel.2019.116138. [DOI] [Google Scholar]
- 54.Hadi P, Xu M, Ning C, et al. A critical review on preparation, characterization and utilization of sludge-derived activated carbons for wastewater treatment. Chem Eng J. 2015;260:895–906. doi: 10.1016/j.cej.2014.08.088. [DOI] [Google Scholar]
- 55.Huang W, Lee D (2021) Modification on biochars for applications : a research update. Biores Technol 319. 10.1016/j.biortech.2020.124100 [DOI] [PubMed]
- 56.Dias D, Bernardo M, Lapa N, et al. Activated carbons from the Co-pyrolysis of rice wastes for Cr(III) removal. Chem Eng Trans. 2018;65:601–606. doi: 10.3303/CET1865101. [DOI] [Google Scholar]
- 57.Fiore S, Berruti F, Briens C. Investigation of innovative and conventional pyrolysis of ligneous and herbaceous biomasses for biochar production. Biomass Bioenerg. 2018;119:381–391. doi: 10.1016/j.biombioe.2018.10.010. [DOI] [Google Scholar]
- 58.Han T, Yang W, Jönsson PG (2019) Bio-fuels and agnetic activated carbon production via co- pyrolysis of lignin and ferrous salts and steam activation of produced bio-char. In: International Conference on Applied Energy. pp 1–5
- 59.Kazak O. Fabrication of in situ magnetic activated carbon by co-pyrolysis of sucrose with waste red mud for removal of Cr(VI) from waters. Environ Technol Innov. 2021;24:101856 . doi: 10.1016/j.eti.2021.101856. [DOI] [Google Scholar]
- 60.Arslanoğlu E, Eren MŞA, Arslanoğlu H, Çiftçi H. Fabrication, characterization, and adsorption applications of low-cost hybride activated carbons from peanut shell-vinasse mixtures by one-step pyrolysis. Biomass Convers Biorefin. 2021 doi: 10.1007/s13399-021-01400-5. [DOI] [Google Scholar]
- 61.Xu Y, Luo G, He S, et al. Efficient removal of elemental mercury by magnetic chlorinated biochars derived from co-pyrolysis of Fe(NO3)3-laden wood and polyvinyl chloride waste. Fuel. 2019;239:982–990. doi: 10.1016/j.fuel.2018.11.102. [DOI] [Google Scholar]
- 62.Geng J, Li LF, Wang WL, et al (2017) Fabrication of activated carbon using two-step co-pyrolysis of used rubber and larch sawdust. BioResources 12:8641–8652. 10.15376/biores.12.4.8641-8652
- 63.Yang B, Liu Y, Liang Q, et al. Evaluation of activated carbon synthesized by one-stage and two-stage co-pyrolysis from sludge and coconut shell. Ecotoxicol Environ Saf. 2019;170:722–731. doi: 10.1016/j.ecoenv.2018.11.130. [DOI] [PubMed] [Google Scholar]
- 64.Liang Q, Liu Y, Chen M, et al. Optimized preparation of activated carbon from coconut shell and municipal sludge. Mater Chem Phys. 2020;241:122327. doi: 10.1016/j.matchemphys.2019.122327. [DOI] [Google Scholar]
- 65.Zhang N, Shen Y. One-step pyrolysis of lignin and polyvinyl chloride for synthesis of porous carbon and its application for toluene sorption. Biores Technol. 2019;284:325–332. doi: 10.1016/j.biortech.2019.03.149. [DOI] [PubMed] [Google Scholar]
- 66.Hui D, Zhengjia L, Zhiwen J. Process optimization of char prepared from co-pyrolysis of cotton stalk and sludge and analysis on its structure and adsorption capacity. Trans Chin Soc Agric Eng. 2016;34:248–254. [Google Scholar]
- 67.Fan S, Sun Y, Yang T, et al. Biochar derived from corn stalk and polyethylene co-pyrolysis: characterization and Pb(ii) removal potential. RSC Adv. 2020;10:6362–6376. doi: 10.1039/c9ra09487c. [DOI] [PMC free article] [PubMed] [Google Scholar]
- 68.Cao W, Wang B, Xia Y, et al (2019) Preparation of highly-active oxygen reduction reaction catalyst by direct co-pyrolysis of biomass with KOH. Int J Electrochem Sci 14:250–261. 10.20964/2019.01.33
- 69.Zhao B, Xu X, Zeng F, et al. The hierarchical porous structure bio-char assessments produced by co-pyrolysis of municipal sewage sludge and hazelnut shell and Cu(II) adsorption kinetics. Environ Sci Pollut Res. 2018;25:19423–19435. doi: 10.1007/s11356-018-2079-y. [DOI] [PubMed] [Google Scholar]
- 70.Li L, Wang J, Jia C, et al. Co-pyrolysis of cyanobacteria and plastics to synthesize porous carbon and its application in methylene blue adsorption. J Water Process Eng. 2021;39:101753 . doi: 10.1016/j.jwpe.2020.101753. [DOI] [Google Scholar]
- 71.Wang Z, Tian Q, Guo J, et al. Co-pyrolysis of sewage sludge/cotton stalks with K2CO3 for biochar production: improved biochar porosity and reduced heavy metal leaching. Waste Manage. 2021;135:199–207. doi: 10.1016/j.wasman.2021.08.042. [DOI] [PubMed] [Google Scholar]
- 72.Zhao B, Xu X, Xu S, et al. Surface characteristics and potential ecological risk evaluation of heavy metals in the bio-char produced by co-pyrolysis from municipal sewage sludge and hazelnut shell with zinc chloride. Biores Technol. 2017;243:375–383. doi: 10.1016/j.biortech.2017.06.032. [DOI] [PubMed] [Google Scholar]
- 73.Fadhil AB, Kareem BA. Co-pyrolysis of mixed date pits and olive stones: Identification of bio-oil and the production of activated carbon from bio-char. J Anal Appl Pyrol. 2021;158:105249 . doi: 10.1016/j.jaap.2021.105249. [DOI] [Google Scholar]
- 74.Yang X, Wan Y, Zheng Y, et al. Surface functional groups of carbon-based adsorbents and their roles in the removal of heavy metals from aqueous solutions: a critical review. Chem Eng J. 2019;366:608–621. doi: 10.1016/j.cej.2019.02.119. [DOI] [PMC free article] [PubMed] [Google Scholar]
- 75.Wang J, Cai J, Wang S, et al. Biochar-based activation of peroxide: multivariate-controlled performance, modulatory surface reactive sites and tunable oxidative species. Chem Eng J. 2022;428:131233 . doi: 10.1016/j.cej.2021.131233. [DOI] [Google Scholar]
- 76.Li Y, Liu Y, Yang W, et al. Adsorption of elemental mercury in flue gas using biomass porous carbons modified by microwave/hydrogen peroxide. Fuel. 2021;291:120152 . doi: 10.1016/j.fuel.2021.120152. [DOI] [Google Scholar]
- 77.Pan X, Gu Z, Chen W, Li Q. Preparation of biochar and biochar composites and their application in a Fenton-like process for wastewater decontamination: a review. Sci Total Environ. 2021;754:142104 . doi: 10.1016/j.scitotenv.2020.142104. [DOI] [PubMed] [Google Scholar]
- 78.Wang J, Liao Z, Ifthikar J, et al. One-step preparation and application of magnetic sludge-derived biochar on acid orange 7 removal via both adsorption and persulfate based oxidation. RSC Adv. 2017;7:18696–18706. doi: 10.1039/c7ra01425b. [DOI] [Google Scholar]
- 79.Li L, Ai J, Zhang W, et al. Relationship between the physicochemical properties of sludge-based carbons and the adsorption capacity of dissolved organic matter in advanced wastewater treatment: effects of chemical conditioning. Chemosphere. 2020;243:125333 . doi: 10.1016/j.chemosphere.2019.125333. [DOI] [PubMed] [Google Scholar]
- 80.Lee YG, Shin J, Kwak J et al (2021) Enhanced adsorption capacities of fungicides using peanut shell biochar via successive chemical modification with kmno4 and koh. Separations 8. 10.3390/separations8040052
- 81.Zheng Y, Wang J, Li D et al (2021) Insight into the KOH/KMnO4 activation mechanism of oxygen-enriched hierarchical porous biochar derived from biomass waste by in-situ pyrolysis for methylene blue enhanced adsorption. J Anal Appl Pyrol 158. 10.1016/j.jaap.2021.105269
- 82.Sajjadi B, Chen WY, Egiebor NO. A comprehensive review on physical activation of biochar for energy and environmental applications. Rev Chem Eng. 2019;35:735–776. doi: 10.1515/revce-2017-0113. [DOI] [Google Scholar]
- 83.Guclu C, Alper K, Erdem M, et al. Activated carbons from co-carbonization of waste truck tires and spent tea leaves. Sustainable Chemistry and Pharmacy. 2021;21:100410 . doi: 10.1016/j.scp.2021.100410. [DOI] [Google Scholar]
- 84.Genuino DAD, de Luna MDG, Capareda SC. Improving the surface properties of municipal solid waste-derived pyrolysis biochar by chemical and thermal activation: Optimization of process parameters and environmental application. Waste Manage. 2018;72:255–264. doi: 10.1016/j.wasman.2017.11.038. [DOI] [PubMed] [Google Scholar]
- 85.Dias D, Bernardo M, Matos I et al (2020) Activation of co-pyrolysis chars from rice wastes to improve the removal of Cr3+ from simulated and real industrial wastewaters. J Clean Prod 267. 10.1016/j.jclepro.2020.121993
- 86.Barquilha CER, Braga MCB. Adsorption of organic and inorganic pollutants onto biochars: challenges, operating conditions, and mechanisms. Bioresour Technol Rep. 2021;15:100728. doi: 10.1016/j.biteb.2021.100728. [DOI] [Google Scholar]
- 87.Lee SY, Choi JW, Song KG, et al. Adsorption and mechanistic study for phosphate removal by rice husk-derived biochar functionalized with Mg/Al-calcined layered double hydroxides via co-pyrolysis. Compos B Eng. 2019;176:107209. doi: 10.1016/j.compositesb.2019.107209. [DOI] [Google Scholar]
- 88.Liu L, Liu X, Wang D, et al. Removal and reduction of Cr(VI) in simulated wastewater using magnetic biochar prepared by co-pyrolysis of nano-zero-valent iron and sewage sludge. J Clean Prod. 2020;257:120562. doi: 10.1016/j.jclepro.2020.120562. [DOI] [Google Scholar]
- 89.Liu L, Zhao J, Liu X, et al. Reduction and removal of As(V) in aqueous solution by biochar derived from nano zero-valent-iron (nZVI) and sewage sludge. Chemosphere. 2021;277:130273. doi: 10.1016/j.chemosphere.2021.130273. [DOI] [PubMed] [Google Scholar]
- 90.Wang S, Xiao D, Zheng X, et al. Halloysite and coconut shell biochar magnetic composites for the sorption of Pb(II) in wastewater: synthesis, characterization and mechanism investigation. J Environ Chem Eng. 2021;9:106865. doi: 10.1016/j.jece.2021.106865. [DOI] [Google Scholar]
- 91.Zhu Y, Liang H, Yu R et al (2020) Removal of aquatic cadmium ions using thiourea modified poplar biochar. Water (Switzerland) 12. 10.3390/W12041117
- 92.Oh SY, Seo YD, Rajagopal R, Ryu KS. Removal of chromate and selenate in natural water using iron-bearing mineral-biochar composites. Environ Earth Sci. 2021;80:1–9. doi: 10.1007/s12665-021-09538-1. [DOI] [Google Scholar]
- 93.Fan S, Li H, Wang Y, et al. Cadmium removal from aqueous solution by biochar obtained by co-pyrolysis of sewage sludge with tea waste. Res Chem Intermed. 2018;44:135–154. doi: 10.1007/s11164-017-3094-1. [DOI] [Google Scholar]
- 94.Sewu DD, Woo SH, Lee DS. Biochar from the co-pyrolysis of Saccharina japonica and goethite as an adsorbent for basic blue 41 removal from aqueous solution. Sci Total Environ. 2021;797:149160 . doi: 10.1016/j.scitotenv.2021.149160. [DOI] [PubMed] [Google Scholar]
- 95.Adeyemo AA, Adeoye IO, Bello OS. Adsorption of dyes using different types of clay: a review. Appl Water Sci. 2017;7:543–568. doi: 10.1007/s13201-015-0322-y. [DOI] [Google Scholar]
- 96.Sun L, Chen T, Ba C, et al. Preparation of sorbents derived from bamboo and bromine flame retardant for elemental mercury removal. J Hazard Mater. 2021;410:124583 . doi: 10.1016/j.jhazmat.2020.124583. [DOI] [PubMed] [Google Scholar]
- 97.Fan L, Wan W, Wang X et al (2019) Adsorption removal of Cr(VI) with activated carbon prepared by co-pyrolysis of rice straw and sewage sludge with ZnCl2 activation. Water Air Soil Pollut 230. 10.1007/s11270-019-4305-8
- 98.Hong Y, Xu Z, Feng C, et al. The preparation of biochar particles from sludge and corncobs and its Pb2+ adsorption properties. Bull Environ Contam Toxicol. 2019;103:848–853. doi: 10.1007/s00128-019-02736-5. [DOI] [PubMed] [Google Scholar]
- 99.Gao M, Wang X, Xia C, et al. Phenol removal via activated carbon from co-pyrolysis of waste coal tar pitch and vinasse. Korean J Chem Eng. 2021;38:64–71. doi: 10.1007/s11814-020-0676-1. [DOI] [Google Scholar]
- 100.Dotto GL, McKay G. Current scenario and challenges in adsorption for water treatment. J Environ Chem Eng. 2020;8:103988 . doi: 10.1016/j.jece.2020.103988. [DOI] [Google Scholar]
- 101.Langmuir I. A new adsorption isotherm. Langmuir. 1918;I(40):1361–1403. [Google Scholar]
- 102.Freundlich H. Colloid and capillary chemistry. London: Methuen; 1926. pp. 6–8. [Google Scholar]
- 103.Redlich OJDL, Peterson DL. A useful adsorption isotherm. J Phys Chem. 1959;63:1024–1024. doi: 10.1021/j150576a611. [DOI] [Google Scholar]
- 104.Sips R. On the structure of a catalyst surface. J Chem Phys. 1948;16:490–495. doi: 10.1063/1.1746922. [DOI] [Google Scholar]
- 105.Toth J. Groundwater discharge: a common generator of diverse geologic and morphologic phenomena. Int Assoc Sci Hydrol Bull. 1971;16:7–24. doi: 10.1080/02626667109493029. [DOI] [Google Scholar]
- 106.Temkin MI. Kinetics of heterogeneous catalysis. J Phys Chem (USSR) 1940;14:1153–1158. [Google Scholar]
- 107.Dubinin MM. Surface and nanomolecular catalysis. Zhur Phys Chem. 1960;34:959. [Google Scholar]
- 108.Kang S, Choi JH, Park JG, Baek K (2019) Pellet adsorbent derived from molasses and dewatered alum sludge for arsenic removal. J CO2 Util 33:31–36. 10.1016/j.jcou.2019.05.002
- 109.Gao R, Wang Q, Liu Y, et al. Co-pyrolysis biochar derived from rape straw and phosphate rock: carbon retention, aromaticity, and Pb removal capacity. Energy Fuels. 2019;33:413–419. doi: 10.1021/acs.energyfuels.8b03753. [DOI] [Google Scholar]
- 110.Fan Y, Wang H, Deng L, et al. Enhanced adsorption of Pb(II) by nitrogen and phosphorus co-doped biochar derived from Camellia oleifera shells. Environ Res. 2020;191:110030 . doi: 10.1016/j.envres.2020.110030. [DOI] [PubMed] [Google Scholar]
- 111.Yang X, Zhang X, Wang Z, et al. Mechanistic insights into removal of norfloxacin from water using different natural iron ore – biochar composites: more rich free radicals derived from natural pyrite-biochar composites than hematite-biochar composites. Appl Catal B. 2019;255:117752 . doi: 10.1016/j.apcatb.2019.117752. [DOI] [Google Scholar]
- 112.Rasmey A-H, Aboseidah A, Youssef A (2018) Phenotypic and molecular characterization of a novel isolate of Pseudomonas aeruginosa applicable for biosorption of Pb2+ from waste water: application of biosorption isotherm models. Egyptian J Microbiol. 10.21608/ejm.2018.2998.1050
- 113.Yin Q, Liu M, Ren H. Biochar produced from the co-pyrolysis of sewage sludge and walnut shell for ammonium and phosphate adsorption from water. J Environ Manage. 2019;249:109410 . doi: 10.1016/j.jenvman.2019.109410. [DOI] [PubMed] [Google Scholar]
- 114.Li C, Huang Q, Zhang H et al (2021) Characterization of biochars produced by co-pyrolysis of hami melon (Cantaloupes) straw mixed with polypropylene and their adsorption properties of cadmium. Int J Environ Res Public Health 18. 10.3390/ijerph182111413 [DOI] [PMC free article] [PubMed]
- 115.Zhao B, Zhang R, Xu XY (2021) Magnetic bio-char derived from sewage sludge and its adsorption ability for Cu(II) in aqueous system. Dongbei Daxue Xuebao/J Northeast Univ 42:1012–1018. 10.12068/j.issn.1005-3026.2021.07.015
- 116.Chen X, Zhang R, Zhao B, et al. Preparation of porous biochars by the co-pyrolysis of municipal sewage sludge and hazelnut shells and the mechanism of the nano-zinc oxide composite and Cu(II) adsorption kinetics. Sustainability (Switzerland) 2020;12:1–19. doi: 10.3390/su12208668. [DOI] [Google Scholar]
- 117.Gao R, Fu Q, Hu H, et al. Highly-effective removal of Pb by co-pyrolysis biochar derived from rape straw and orthophosphate. J Hazard Mater. 2019;371:191–197. doi: 10.1016/j.jhazmat.2019.02.079. [DOI] [PubMed] [Google Scholar]
- 118.Li J, Yu G, Pan L, et al. Ciprofloxacin adsorption by biochar derived from co-pyrolysis of sewage sludge and bamboo waste. Environ Sci Pollut Res. 2020;27:22806–22817. doi: 10.1007/s11356-020-08333-y. [DOI] [PubMed] [Google Scholar]
- 119.Gao Y, Jiang Z, Li J, et al. A comparison of the characteristics and atrazine adsorption capacity of co-pyrolysed and mixed biochars generated from corn straw and sawdust. Environ Res. 2019;172:561–568. doi: 10.1016/j.envres.2019.03.010. [DOI] [PubMed] [Google Scholar]
- 120.Lagergren S. Zur theorie der sogenannten adsorption gelo¨ster stoffe. Kungliga Svenska Vetenskapsakademiens. 1898;24:1–39. [Google Scholar]
- 121.Ho YS, McKay G. Pseudo-second order model for sorption processes. Process Biochem. 1999;34:451–465. doi: 10.1016/S0032-9592(98)00112-5. [DOI] [Google Scholar]
- 122.Chien SH, Clayton WR. Application of Elovich equation to the kinetics of phosphate release and sorption in soils. Soil Sci Soc Am J. 1980;44:265–268. doi: 10.2136/sssaj1980.03615995004400020013x. [DOI] [Google Scholar]
- 123.Lopes EC, dos Anjos FS, Vieira EF, Cestari AR. An alternative Avrami equation to evaluate kinetic parameters of the interaction of Hg (II) with thin chitosan membranes. J Colloid Interface Sci. 2003;263:542–547. doi: 10.1016/S0021-9797(03)00326-6. [DOI] [PubMed] [Google Scholar]
- 124.Weber WJ, Jr, Morris JC. Kinetics of adsorption on carbon from solution. J Sanit Eng Div. 1963;89:31–59. doi: 10.1061/JSEDAI.0000430. [DOI] [Google Scholar]
- 125.Hameed BH, El-Khaiary MI. Equilibrium, kinetics and mechanism of malachite green adsorption on activated carbon prepared from bamboo by K2CO3 activation and subsequent gasification with CO2. J Hazard Mater. 2008;157:344–351. doi: 10.1016/j.jhazmat.2007.12.105. [DOI] [PubMed] [Google Scholar]
- 126.Aharoni C, Ungarish M. Kinetics of activated chemisorption Part 2. — Theoretical models. J Chem Soc Faraday Trans. 1977;73:456–464. doi: 10.1039/f19777300456. [DOI] [Google Scholar]
- 127.Boyd GE, Schubert J, Adamson AW. The exchange adsorption of ions from aqueous solutions by organic zeolites. Ion-exchange Equilibria. J Am Chem Soc. 1947;69:2818–2829. doi: 10.1021/ja01203a064. [DOI] [PubMed] [Google Scholar]
- 128.Hubbe MA, Azizian S, Douven S (2019) Implications of apparent pseudo-second-order adsorption kinetics onto cellulosic materials: a review. BioResources 14:7582–7626. 10.15376/biores.14.3.7582-7626
- 129.Bilal M, Ihsanullah I, Ul Hassan Shah M, Younas M. Enhanced removal of cadmium from water using bio-sorbents synthesized from branches and leaves of Capparis decidua and Ziziphus mauritiana. Environ Technol Innov. 2021;24:101922 . doi: 10.1016/j.eti.2021.101922. [DOI] [Google Scholar]
- 130.Omoniyi T, Salami HA (2018) Yield, Characterization and Potential Application of Activated Carbon Produced from Co – pyrolysis of Wood and Plastic Wastes as Adsorbent for Aquaculture Wastewater Treatment. The Proceedings 12th CIGR Section VI International Symposium 22 –25 October, 2018 Yield,
- 131.Zhang H, Pap S, Taggart MA, et al. A review of the potential utilisation of plastic waste as adsorbent for removal of hazardous priority contaminants from aqueous environments. Environ Pollut. 2020;258:113698 . doi: 10.1016/j.envpol.2019.113698. [DOI] [PubMed] [Google Scholar]
- 132.Wołowiec M, Komorowska-kaufman M, Pruss A, et al. Removal of heavy metals and metalloids from water using drinking water treatment Wołowiec, M., Komorowska-Kaufman, M., Pruss, A., Rzepa, G., & Bajda, T. (2019) Minerals. 2019;9:1–17. doi: 10.3390/min9080487. [DOI] [Google Scholar]
- 133.Siipola V, Pflugmacher S, Romar H et al (2020) Low-cost biochar adsorbents for water purification including microplastics removal. Appl Sci (Switzerland) 10. 10.3390/app10030788
- 134.Wang J, Sun C, Huang QX, et al. Adsorption and thermal degradation of microplastics from aqueous solutions by Mg/Zn modified magnetic biochars. J Hazard Mater. 2021;419:126486 . doi: 10.1016/j.jhazmat.2021.126486. [DOI] [PubMed] [Google Scholar]