

Abstract
Background
Acute COVID-19 infection has been shown to have significant effects on the cardiovascular system. Post-acute sequelae of SARS-CoV-2 (PASC) are being identified in patients; however, the cardiovascular effects are yet to be well-defined. The Post-COVID Cardiology Clinic at Washington University evaluates and treats patients with ongoing cardiovascular PASC.
Objectives
This investigation aims to describe the phenotypes of cardiovascular symptoms of PASC in patients presenting to the Post-COVID Cardiology Clinic, including their demographics, symptoms, and the clinical phenotypes observed.
Methods
This was a retrospective analysis of symptoms, clinical findings, and test results from the first 100 consecutive adult patients who presented to the Post-COVID Cardiology Clinic at Washington University in St. Louis, between September 2020 to May 2021 with cardiovascular symptoms following COVID-19 infection.
Results
The population (n = 100) had a mean age of 46.3 years and was 81% female. Most patients had mild acute illness, with only 23% of patients requiring hospitalization during acute COVID-19 infection. The most commonly reported PASC symptoms were chest pain (66%), palpitations (59%), and dyspnea on exertion (56%). Of those presenting with these symptoms, 74/98 patients (75.5%) were found to have a significant blood pressure elevation, considerable sinus tachycardia burden, reduced global longitudinal strain, increased indexed left-ventricular end-diastolic volume (LVEDVi) by echocardiogram, and/or cMRI findings consistent with possible active or healing myocarditis.
Conclusions
Our findings highlight clinical phenotypes of the cardiovascular manifestations of PASC. Further studies are needed to evaluate the pathophysiology, treatment options and long-term outcomes for these patients.
Keywords: Post-acute sequelae of SARS-CoV-2, COVID-19, Sinus tachycardia, Cardiac magnetic resonance imaging
Abbreviations: PASC, Post-Acute Sequalae of SARS-CoV-2-Infection; COVID-19, Coronavirus disease-2019; TTE, Transthoracic Echocardiogram; cMRI, Cardiac Magnetic Resonance Imaging; ECG, Electrocardiogram; NT-proBNP, N-terminal-pro Hormone Brain Natriuretic Peptide
1. Background
Coronavirus disease-2019 (COVID-19), a viral illness caused by the severe acute respiratory syndrome-coronavirus-2 (SARS-CoV-2), was declared a global pandemic by the World Health Organization in March 2020 [1]. Since then, there have been over 500 million cases of COVID-19 infection with over 6 million reported deaths [2]. Long-term sequalae of COVID-19 infection are now being identified in patients who remain symptomatic beyond the acute phase. These manifestations have been termed Post-Acute Sequalae of SARS-CoV-2-Infection (PASC) by the National Institute of Health [3]. Several case reports and studies have emerged describing post-acute COVID symptoms weeks following initial infection with significant symptoms seen in young and otherwise healthy individuals that had a mild acute COVID-19 course [4,5]. These symptoms can affect most systems, with the most common being fatigue, cough, shortness of breath, chest pain, palpitations, difficulty concentrating, arthralgia, low-grade fever, and headache. While some studies have described cardiovascular symptoms of PASC including palpitations and chest pain, a comprehensive and standardized evaluation of these patients is still lacking [[6], [7], [8], [9]].
The Post-COVID Cardiology Clinic at Washington University School of Medicine was established in September 2020 to evaluate and treat patients with ongoing or new cardiovascular symptoms following acute COVID-19 infection. Here, we present a retrospective analysis of patients with cardiovascular PASC including their demographics, symptoms, and the clinical phenotypes observed.
2. Methods
The study is a retrospective analysis of one hundred consecutive adult patients presenting to the Post-COVID Cardiology Clinic at Washington University in St. Louis, Missouri, between September 2020 to May 2021 with cardiovascular symptoms following COVID-19 infection. A total of 110 patients were screened, and 10 patients who did not have ongoing cardiovascular symptoms at the time of presentation to the clinic were excluded (Supplemental Fig. 1). This study was approved by the institutional review board at Washington University School of Medicine in St. Louis, Missouri (IRB #202102053).
Data were collected from the hospital's electronic medical record system. Baseline co-morbidities and vital signs were gathered via chart review of visits prior to COVID-19 infection when available. Post COVID-19 infection status was denoted by a prior positive SARS-CoV-2 nasopharyngeal PCR laboratory result or noting that the patient was presumed COVID-19 positive from constellation of symptoms and exposure history due to the lack of widely available testing in the early stages of the pandemic.
Demographics, past medical history, medications, COVID-19 test results, duration of symptoms from COVID-19 diagnosis to presentation to the Post-COVID Cardiology Clinic, PASC cardiovascular symptoms, vital signs, ECG findings, inflammatory and cardiac biomarker results, Holter monitor results, transthoracic echocardiography (TTE) results, treatments and follow-up data were collected for each patient. Holter monitors were assessed for average heart rate and tachycardia burden. With regards to TTE results, left ventricular ejection fraction (LVEF), left ventricular volume, and global longitudinal strain (GLS) were assessed, with normal values based on American Society of Echocardiography guidelines as follows: LVEF (biplane/modified Simpson's rule) normal 53–73%; left ventricular end diastolic volume indexed to body surface area (LVEDVi, biplane/modified Simpson's rule) normal for males 34-74 mL/m2, for females 29-61 mL/m2; GLS normal >18% (absolute value) [10].
All statistical analyses were conducted at a significance level of 0.05 using JMP 16.1. Demographics, past medical history, COVID-19 test results, duration from COVID-19 diagnosis to presentation to the Post-COVID Cardiology Clinic, PASC cardiovascular symptoms, vital signs, EKG findings, inflammatory and cardiac biomarker results, Holter monitor results, TTE results, treatments, and follow-up data were all analyzed using descriptive statistics.
To estimate a minimum duration of cardiovascular PASC symptoms, time in days from COVID-19 diagnosis to initial cardiology office visit was used. A non-parametric Kruskal-Wallis test was used to compare durations of the different symptoms, from onset to initial office visit. Vital signs, including blood pressure, were compared between cardiology office visits using non-parametric Wilcoxon tests for paired data. Blood pressure, heart rate, and weight at the initial cardiology office visit were also compared to baseline values prior to COVID-19 using a non-parametric Wilcoxon test for paired data. To determine a baseline blood pressure, heart rate, and weight, two values from office visits within the past five years for non-emergent complaints prior to COVID-19 infection were averaged. If only one value prior to COVID-19 during a non-emergent visit was available, this blood pressure was used as the baseline.
Holter monitoring (Preventice, Boston Scientific, Minneapolis, MN) was used to determine sinus tachycardia burden. Tachycardia episodes were captured on the monitors and defined as a heart rate (HR) >100 beats per minute (bpm) for at least 30 s. Sinus tachycardia burden was defined as the percentage of time where the HR was >100 bpm with no change in p wave morphology divided by the duration of the monitoring period. Similar to prior studies, we defined a sinus tachycardia burden of greater than or equal to 10% as significant [11]. Inappropriate sinus tachycardia (IST) was defined according to Heart Rhythm Society guidelines, with patients considered to have IST if their resting HR on EKG or initial vital signs was >100 bpm and average HR on Holter monitor was >90 bpm [12].
3. Results
One hundred consecutive patients were included in the cohort. The mean age was 46.3 years (SD 14.7), 81% were female, 86% white, 13% African American and 1% Asian. One third of the cohort were healthcare workers at the time of acute COVID-19 infection. Demographics, baseline co-morbidities and cardiovascular medications prior to COVID-19 are shown in Table 1 .
Table 1.
Demographics.
| Demographics n = 100 | |
|---|---|
| Sex | Female: 81 |
| Male: 19 | |
| Race | African American: 13 |
| Asian: 1 | |
| White: 86 | |
| Age | 46.3 years (SD 14.7) |
| Healthcare worker | 33 |
| Past Medical History | |
| Hypertension | 38 |
| Diabetes (Type 1 or 2) | 12 |
| Coronary Artery Disease | 2 |
| Heart Failure (Systolic, Diastolic, or Combined) | 4 |
| Psychiatric Conditions (including anxiety and depression) | 17 |
| Thyroid Disorders | 20 |
| Pulmonary Disorders | 18 |
| Chronic Pain | 10 |
| History of Arrhythmia | 10 |
| Cardiovascular Medications | |
| Aspirin | 14 |
| Statin | 18 |
| Antiplatelet agent and/or anticoagulant⁎ | 4 |
| Beta-Blocker | 17 |
| Calcium Channel Blocker | 9 |
| Thiazide | 11 |
| Loop Diuretic | 13 |
| ACE-Inhibitor | 11 |
| Angiotensin-Receptor Blocker | 11 |
| Angiotensin Receptor-Neprilysin Inhibitor | 2 |
| Alpha-1 Receptor Blocker | 2 |
| Alpha-2 Receptor Agonist | 2 |
| Nitrate | 1 |
| Phosphodiesterase-5 Inhibitor | 1 |
| COVID-19 Testing | |
| Positive Test | 81 |
| Presumed Positive | 19 |
| COVID-19 Hospitalization Rate | |
| Hospitalized | 23 |
| Intensive Care Unit | 5 |
| COVID-19 Vaccination Status | |
| Vaccinated prior to COVID-19 infection | 2 |
| Vaccinated prior to clinical evaluation | 71 |
Coronavirus disease-2019 (COVID-19).
Does not include aspirin.
Positive COVID-19 nasopharyngeal PCR test results were available for 81% of the cohort, and 19% patients were presumed positive based on constellation of symptoms since testing was not readily available at the time. Only 23% of patients were hospitalized during acute COVID-19 infection. At the time of infection, 97 patients were not vaccinated against COVID-19, 2 patients were vaccinated (receiving at least one dose of vaccine within the prior 6 months), and 1 patient had unknown vaccination status. At the time of evaluation in the clinic, 71 patients were vaccinated, 25 patients were not vaccinated, and 4 patients had unknown vaccination status (Table 1).
From initial COVID-19 diagnosis to presentation at the Post-COVID Cardiology Clinic, the median time was ninety-nine days (Fig. 1 ). There was no significant difference in duration of symptoms from COVID-19 diagnosis to office visit based on specific symptoms reported (Kruskal-Wallis test, p = 0.90) (Table 2 ).
Fig. 1.

Time from initial COVID-19 infection to presentation with PASC.
Fig. 1 is a histogram illustrating the distribution of time in days from COVID-19 diagnosis to initial cardiology office visit. Patients had a significant lag between COVID diagnosis and initial office visit, during which PASC cardiovascular symptoms were still ongoing. Ninety-nine days is the median duration.
Table 2.
PASC symptom duration.
| Symptom | Median duration⁎ (days) [IQR] |
|---|---|
| Chest Pain | 110.5 [64–163.3] |
| Palpitations | 100 [64–160] |
| Dyspnea on Exertion | 96 [57.3–163] |
| Pre-Syncope | 116 [63.5–167] |
| Fatigue | 105 [67.8–146.5] |
| Shortness of Breath | 120 [98–174.5] |
| Lower Extremity Edema | 96 [50–170] |
Post-Acute Sequalae of SARS-CoV-2-Infection (PASC).
Duration from COVID-19 diagnosis to Cardiology Office Visit.
On presentation to the Post-COVID Cardiology Clinic, patients reported a range of cardiovascular symptoms. Although most patients reported multiple symptoms, the most common symptom reported was chest pain (66%), followed by palpitations (59%) and dyspnea (56%) (Fig. 2 ).
Fig. 2.

PASC cardiovascular symptoms.
Fig. 2 represents the distribution of cardiovascular PASC symptoms among the cohort of 100 consecutive patients presenting to the clinic. A majority of patients reported chest pain and/or palpitations. The percentage at the end of each bar represents the percentage of patients experiencing each of these symptoms.
At the initial visit, a complete set of vital signs were obtained (Table 3 ). Ninety-four patients (94%) had two blood pressure values available prior to COVID-19 infection to calculate a baseline blood pressure. Compared to baseline, there was a significant increase in median systolic (128 vs. 121.5 mmHg, p = 0.029) and median diastolic (83.5 vs. 76 mmHg, p < 0.001) blood pressure (Fig. 3 ). A majority (81%) of the blood pressures used to calculate baseline values were from within the last two years prior to COVID-19 and none were beyond 5 years from the time of COVID-19 infection. A total of 52 patients had an increase in systolic or diastolic blood pressure of 10 mmHg or more from baseline.
Table 3.
Vital signs in patients with PASC.
| Vital sign | Median value at initial office visit [IQR], (N = 100) | Median value at follow-up office visit [IQR], (N = 74) | p-value |
|---|---|---|---|
| Heart Rate (BPM) | 83 [74–94] | 76.5 [66.3–87.5] | <0.0001 |
| Systolic Blood Pressure (mmHg) | 128 [116–136] | 121 [112−131] | 0.0004 |
| Diastolic Blood Pressure (mmHg) | 83.5 [77–90] | 80 [73.8–87] | 0.0026 |
| Oxygen Saturation (%) | 98 [97–99] | 98 [97–99] | 0.65 |
| Body Mass index | 28.3 [25.0–35.8] | – | – |
Beats per Minute (BPM).
Interquartile Range (IQR).
Post-Acute Sequalae of SARS-CoV-2-Infection (PASC).
Millimetre of Mercury (mmHg).
Fig. 3.

Systolic and diastolic blood pressure distribution.
Fig. 3 demonstrates the blood pressure increase between baseline and initial cardiology office visits for systolic and diastolic pressures in A and B, respectively. Lines highlight the median values.
Eighty-eight patients had heart rates and weights available prior to COVID-19 infection to calculate a baseline heart rate and weight. As with blood pressure, the majority of values were within the preceding two years and none were beyond 5 years from the time of COVID-19 infection. Compared to baseline, there was a significant increase in median heart rate (84 vs 79 bpm, p = 0.0034) and median weight (81.7 g vs 80.4 kg, p = 0.0138) (Supplemental Fig. 2A).
Supplemental Fig. 2.
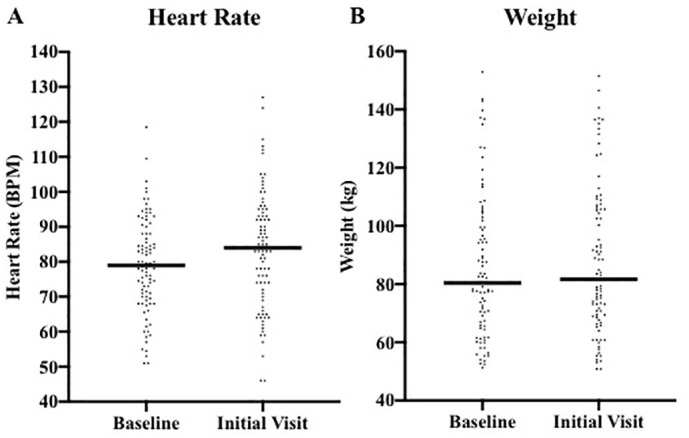
Heart rate and weight distribution. Fig. 2 demonstrates the heart rate (A) and weight increase (B) between baseline and initial cardiology office visits.
All patients presenting to clinic had an ECG performed. Of these, 20% had low voltage. Laboratory testing for inflammatory and cardiac biomarkers was performed which included C-reactive protein, estimated sedimentation rate, ferritin, D-dimer, NT-proBNP, and troponin. Several patients had elevations of one or more of these laboratory tests; however, there was no correlation of specific symptoms to any particular laboratory test results (Table 4 ).
Table 4.
Laboratory testing in patients with PASC.
| Biomarker | Normal Range | Median [IQR] | Number of Patients with Elevation/Patients Tested (%) |
|---|---|---|---|
| C-Reactive Protein: | |||
| Conventional (mg/L) | <10 | 3.0 [1.1–5.3] | 8/59 (13.6%) |
| High Sensitivity (mg/L) | <1.0 | 2.0 [0.7–4.9] | 22/32 (68.8%) |
| Erythrocyte Sedimentation Rate (mm/h) | <30 | 9.0 [6.5–17.5] | 12/89 (13.5%) |
| Ferritin (ng/mL) | <250 | 89 [42.4–173] | 12/80 (15%) |
| D-dimer (ng/mL) | <500 | 289 [0–427.3] | 15/80 (18.8%) |
| BNP (pg/mL) | <100 | 12 [9.9–32] | 1/9 (11.1%) |
| NT-proBNP (pg/mL) | <400 | 37 [0−122] | 7/81 (18.9%) |
| Troponin I: | |||
| Conventional (ng/mL) | <0.04 | 0 [0–0] | 1/29 (3.4%) |
| High Sensitivity (pg/mL) | <30 | 0 [0–0] | 5/52 (9.6%) |
B-type Natriuretic Peptide (BNP).
Interquartile Range (IQR).
N-terminal-pro hormone B-type Natriuretic Peptide (BNP).
Post-acute sequelae of SARS-CoV-2 Infection (PASC).
Sixty-nine patients had Holter monitoring performed for 48–72 h (Table 5 ). Data for burden of sinus tachycardia was available for fifty-nine of the patients. The median burden of sinus tachycardia was 8.4% (interquartile range [IQR] 2.6–17.7%). All patients with a burden of sinus tachycardia of >5% were symptomatic with cardiovascular PASC symptoms primarily during episodes of sinus tachycardia. Eight patients (11.6%) in the cohort met criteria for IST.
Table 5.
Holter monitor findings.
| Average Heart Rates (bpm) [SD] (n = 69): | |
|---|---|
| Mean | 80.3 [10.5] |
| Minimum | 53.9 [9.03] |
| Maximum | 151.8 [19.3] |
| Burden of Sinus Tachycardia (n = 59): | |
| Median Percentage [IQR] | 8.4% [2.6–17.7%] |
| 0–5% (N, %) | 21 (35.6%) |
| 5–10% (N, %) | 12 (20.3%) |
| >10% (N, %) | 26 (44.1%) |
| Inappropriate sinus tachycardia | |
| Resting Heart Rate > 100 bpm, n = 100 | 17 (17%) |
| Mean Heart Rate > 90 bpm (on Holter), n = 69 | 14 (20.2%) |
| Both Resting Heart Rate > 90 bpm + Mean Heart Rate > 100 bpm, n = 69 | 8 (11.6%) |
Beats per Minute (BPM).
Interquartile Range (IQR).
Standard Deviation (SD).
Ninety-seven patients had TTE performed. The mean LVEF was 62.7% (standard deviation [SD] 8.9%), with three patients with LVEF of <40%. GLS was available on seventy of the TTE exams, with a mean of −18.1% (SD 2.9). Of these, twenty patients (28.6%) had reduced GLS. Twenty-three patients (23.7%) had evidence of diastolic dysfunction. Left-ventricular volumes were available for all ninety-seven TTE exams. The median LVEDVi was 51.3 mL/m2 (IQR 44.6–61.7 mL/m2). Of these, 23.7% were noted to have increased left ventricular volumes by 2D echo using modified biplane Simpson's rule.
Thirty-seven patients had cardiac MRI performed due to ongoing chest pain with symptoms concerning for myopericarditis. Average LVEF was 60%, with 7 patients having LVEF <50%. Nineteen percent (7 of 37) of these patients had T1 and/or T2 abnormalities (4 with prolonged native T1 values, 3 with prolonged T2 values, and 3 patients with both). Cardiac MRI of two patients showed late gadolinium enhancement. One patient had prolonged T1 and T2 values along with late gadolinium enhancement, meeting Lake Louise Criteria for active myocarditis.
In those patients presenting with chest pain, palpitations, dyspnea on exertion and/or pre-syncope symptoms, 74/98 patients (75.5%) were found to have a significant blood pressure elevation or sinus tachycardia burden, reduced GLS, and/or increased LVEDVi by echocardiogram. Over half of the patients presenting with chest pain and/or palpitations were found to have systolic or diastolic blood pressure elevations of ≥10 mmHg (Table 6 ).
Table 6.
Frequency of symptoms and clinical findings.
| Systolic or diastolic blood pressure elevation of ≥10 mmHg |
Sinus Tachycardia Burden of >10% |
Reduced Global Longitudinal Strain |
Increased LVEDVi |
||
|---|---|---|---|---|---|
| Symptom | Number of patients | Patients with finding (%): | |||
| Chest Pain | 66 | 35 (53%) | 18 (27%) | 13 (20%) | 13 (20%) |
| Palpitations | 59 | 32 (54%) | 19 (32%) | 11 (19%) | 11 (19%) |
| Dyspnea on Exertion | 56 | 26 (46%) | 12 (21%) | 11 (20%) | 13 (23%) |
| Pre-Syncope | 42 | 21 (50%) | 10 (24%) | 5 (12%) | 7 (17%) |
Indexed left-ventricular end-diastolic volume (LVEDVi).
Millimetre of Mercury (mmHg).
Ninety-four patients (94%) were treated with a new medication for their symptoms. In the subset of the fifty-two patients that had an increase in systolic or diastolic blood pressure of 10 mmHg or more from baseline, forty-eight were treated with the addition of a new anti-hypertensive or an increased dose of a previously prescribed anti-hypertensive. For symptomatic sinus tachycardia management, 62 patients were started on a beta blocker, 10 on a calcium channel blocker and 8 on Ivabradine. While most patients tolerated these medications well with improvement in symptoms, five patients failed metoprolol alone, three failed diltiazem alone, and one failed ivabradine alone, due to ineffective management of sinus tachycardia, bradycardia, hypotension, and/or hair loss.
In the subset of the seventy-four patients (74%) that have followed up thus far, when comparing symptoms at initial cardiology office visit to follow-up office visit, 82.4% (n = 61) reported improvement in symptoms, and 10.8% (n = 8) reported unchanged symptoms. Only four (5.4%) patients reported resolved symptoms, and one patient reported symptoms were worse in the setting of recent COVID-19 vaccination. Of those that reported improvement or resolution in symptoms, all 65 patients (100%) had been started on a medication for management at their initial office visit.
Vital signs on follow-up demonstrated a lower heart rate and blood pressure (systolic and diastolic) as compared to initial cardiology office visit (Table 3). Sixty-nine patients that followed-up (93.2%) were prescribed a new anti-hypertensive or required an increased dose of a prior anti-hypertensive at their initial visit. Blood pressures at follow-up were not significantly different from prior to COVID-19 infection baseline (median systolic delta = 0 mmHg, diastolic delta = 1.0 mmHg; p > 0.05).
4. Discussion
In this retrospective study, we describe a patient cohort presenting to the Post-COVID Cardiology Clinic at Washington University with ongoing cardiovascular symptoms following acute COVID-19 infection. The population is young and predominantly female. The majority of the cohort had a relatively benign COVID-19 course and did not require hospitalization. Patients described a broad range of cardiovascular symptoms which were ongoing several months after acute COVID-19 infection. Most of the patients were not vaccinated at the time of acute COVID-19 infection (in part due to lack of vaccination at that time) but were vaccinated following infection. We were unable to determine whether COVID-19 vaccination prior to infection was correlated with attenuation of PASC; however, despite vaccination in the post-COVID period, many patients continued to have PASC.
The female preponderance with regards to PASC is not isolated to cardiovascular PASC but rather extends to other PASC symptoms such as fatigue and neurological symptoms [13]. Studies have posited that sex hormone differences, sex-specific differences in comorbidities and inflammatory response, as well as sex-specific patterns of access to medical care may contribute to higher rates of PASC in women [14]. Interestingly, women tend to have lower rates of severe acute infection compared to men yet seem to have higher rates of post-COVID symptoms. For the difference in acute infection, higher levels of soluble ACE2 – to which SARS-CoV-2 binds - have been found in women and believed to be protective against acute infection [15]. It remains unclear whether this mechanism is also involved in the pathogenesis of PASC [16].
Palpitations were a common symptom reported by patients presenting after having COVID-19 infection. Resting heart rate based on vital sign data, while statistically significant with regards to an elevation of the median value in the post-COVID setting, is unlikely clinically significant. Holter monitor data however better captured the interesting tachycardia pattern when using the tachycardia burden as we previously defined. Overall, patients seem to have an over-exaggerated tachycardic response to physiologic demands which then takes longer to recover, amounting to higher tachycardia burden than expected with normal activity. Some investigators have noted similar findings and termed this phenotype Post-COVID-19 tachycardia syndrome [17]. Possible mechanisms for this excessive tachycardia may include response to change in physiologic and/or metabolic demands such as weight gain, fatigue, pain, and/or deconditioning. In our cohort, though, weight gain amounted to an increase in median weight by 1.3 kg, not likely to be of clinical relevance as a driver for tachycardia.
There have also been several reports of postural orthostatic tachycardia syndrome (POTS), dysautonomia and IST, following COVID-19 in the literature [4,[18], [19], [20], [21], [22]]. Although we were able to characterize IST in our cohort, we could diagnose and/or exclude POTS as a possible diagnosis for patients with palpitations based on defined criteria. Most patients though had orthostatic vital signs which were not consistent with POTS and noted to have palpitations typically occurring with activity rather than with postural changes, making the diagnosis unlikely. Overall, established disorders of sinus tachycardia including IST and POTS may apply to some of our patients with others seeming to have similar attributes suggesting they have a disorder on the same spectrum.
Nonetheless, patients seem to have improvement in their symptoms such as palpitations, shortness of breath and chest pain with heart rate lowering medications. Typically, this did not reduce heart rate back to their baseline, but rather, minimized wide fluctuations in heart rate that would otherwise occur with activity and limit exertion.
A subset of patients presenting with cardiovascular PASC had increased blood pressure when compared to blood pressure prior to infection. Many of these patients complained of headaches, chest pain and dyspnea. While this relative increase in blood pressure for a majority of patients did not meet criteria for hypertension, improvement in blood pressure control was associated with resolution of symptoms. As noted with the tachycardia response, the blood pressure response may similarly be related to a change in metabolic and physiologic demands.
On a cellular level, the renin-angiotensin-aldosterone system (RAAS) may be implicated in blood pressure fluctuation. Once SARS-CoV-2 infects the cell via the ACE2 receptor, it promotes a downregulation in the expression of the receptor resulting in an increase in the levels of Ang-II, a potent vasoconstrictor [23,24]. This may help explain increase in blood pressure in patients with PASC. Interestingly, prior research on POTS has also implicated RAAS suggesting an impaired response to Ang II [25].
The pro-inflammatory state stimulated by ACE2 and other inflammatory milieu is another possible underlying mechanism for the clinical phenotypes we observed. There is a growing body of evidence implicating endothelial dysfunction both in acute COVID-19 infection and PASC [26]. Endothelial dysfunction is a systemic condition in which the endothelium loses integral properties such as regulation of vascular tone, permeability and homeostasis [27]. It has been attributed to many cardiometabolic conditions including hypertension, diabetes, dyslipidemia, coronary artery disease and cerebrovascular disease [28]. Notably, the vascular endothelium of small and large arteries and veins are laden with ACE2 receptors and evidence of endothelial inflammation and dysfunction has been documented in myocardium of patients with COVID-19 infection [29,30]. These endothelial changes from COVID-19 may be a plausible mechanism for PASC [26,27].
A proportion of the cohort reported lingering symptoms of chest pain and shortness of breath. Most of these patients had normal diagnostic testing without evidence of ischemia on stress testing, cardiac dysfunction on transthoracic echocardiography and/or myopericarditis on cardiac MRI. However, there was a small group of patients with abnormal imaging findings including reduced GLS, diastolic dysfunction, mildly dilated LV, and/or MRI findings consistent with myocardial involvement (as described in the literature) [31]. The number of patients with abnormal cardiac MRI meeting criteria for myocarditis - only one case - is much lower than initially thought and more in line with recent reports [32,33].
These abnormalities on imaging in addition to the symptoms we observed may be secondary to COVID-19 infection, by either direct or indirect mechanisms [34]. Autopsies and endomyocardial biopsy specimens from subjects with SARS-CoV-2 infection and clinical diagnoses of myocarditis have confirmed the presence of SARS-CoV-2 virus as well as evidence of cardiomyocyte necrosis suggesting possible direct myocardial injury [34]. Some patients may have had a component of myocarditis in the acute stage of COVID-19 infection and persistent symptoms and imaging abnormalities could reflect chronic myocarditis, features of recovering myocarditis, and/or sequalae of systemic inflammatory response.
Although many patients had improved symptoms with treatment over time, we do not yet know the long-term effects of these processes at play with and without treatment. Testing including echocardiography may provide a subtle indicator of what to expect in the future – such as reduction in GLS, a sensitive marker of future cardiomyopathy which has been shown to be a poor prognostic indicator in patients with LV dysfunction [35,36]. However, without robust prior baseline testing, it is difficult to state that these findings were secondary to COVID-19.
While this is the first investigation presenting clinical findings on a uniformly evaluated subset of patients presenting with cardiovascular PASC symptoms, it is a small single center cohort. Future multi-centered studies with larger sample sizes are needed for external validation. Some participants only had blood pressures available from several years ago which may have affected the change in blood pressure, though the large differential was unlikely to be the result of ageing alone [24]. Additionally, blood pressure, heart rate, and weight readings were from a single measurement from the initial cardiology office visit; heart rate and blood pressure in particular can vary widely throughout the day yet only one value was available for comparison to prior baseline values. While many patients had a considerable sinus tachycardia burden, there are no standardized definitions of clinically significant tachycardia burden. With retrospective data, some key clinical information to help with diagnosis of conditions such as POTS was unavailable. Also, lack of pre-COVID echocardiography and cardiac MRI precludes us from knowing whether abnormalities seen were truly a result of COVID-19 infection.
5. Conclusion
As the COVID-19 pandemic continues with growing number of COVID-19 cases as well as the emergence of new variants, the sequalae of COVID-19 infection will become more prevalent emphasizing the need for a systematic approach to evaluation and management of patients. Our findings highlight the clinical symptom phenotypes of the cardiovascular manifestations of PASC and add to the growing body of evidence pertaining to this new clinical syndrome. This serves as a stepping stone for future studies on the pathophysiology and treatment options for these patients. Long-term follow up is needed to evaluate symptom persistence and clinical outcomes in patients who present with PASC.
The following are the supplementary data related to this article.
Study design. This figure outlines the number of patients screened and then included in the study as well as the investigations patients had during evaluation.
Funding
No funding or support was received for the work presented in this manuscript.
Declaration of Competing Interest
None.
References
- 1.Ghebreyesus T.A. WHO Director General’s speeches; 2020. WHO Director-General’s Opening Remarks at the Media Briefing on COVID-19 - 11 March 2020 [Internet]https://www.who.int/dg/speeches/detail/who-director-general-s-opening-remarks-at-the-media-briefing-on-covid-19---11-march-2020 [cited 2021 Apr 21]. p. 4. Available from: [Google Scholar]
- 2.Johns Hopkins Coronavirus Resource Center [Internet] 2021. https://coronavirus.jhu.edu/data/hubei-timeline [cited 2021 Jun 30]. Available from:
- 3.NIH Launches New Initiative to Study “Long COVID” | National Institutes of Health (NIH) [Internet] 2021. https://www.nih.gov/about-nih/who-we-are/nih-director/statements/nih-launches-new-initiative-study-long-covid [cited 2021 Apr 22]. Available from:
- 4.Johansson M., Ståhlberg M., Runold M., Nygren-Bonnier M., Nilsson J., Olshansky B., et al. Long-haul post–COVID-19 symptoms presenting as a variant of postural orthostatic tachycardia syndrome: the Swedish experience. JACC Case Reports. 2021 Apr 1;3(4):573–580. doi: 10.1016/j.jaccas.2021.01.009. [DOI] [PMC free article] [PubMed] [Google Scholar]
- 5.Carfì A., Bernabei R., Landi F. Persistent symptoms in patients after acute COVID-19 [Internet] JAMA. 2020;324:603–605. doi: 10.1001/jama.2020.12603. https://www American Medical Association; [cited 2021 Feb 11]. Available from: [DOI] [PMC free article] [PubMed] [Google Scholar]
- 6.Bierle D.M., Aakre C.A., Grach S.L., Salonen B.R., Croghan I.T., Hurt R.T., et al. Central sensitization phenotypes in post acute sequelae of SARS-CoV-2 infection (PASC): defining the post COVID syndrome. J. Prim. Care Commun. Health [Internet] 2021;12 doi: 10.1177/21501327211030826. https://pubmed.ncbi.nlm.nih.gov/34231404/ [cited 2021 Jul 17]. 21501327211030824. Available from: [DOI] [PMC free article] [PubMed] [Google Scholar]
- 7.Estiri H., Strasser Z.H., Brat G.A., Semenov Y.R., Aaron J.R., Agapito G., et al. Evolving phenotypes of non-hospitalized patients that indicate long COVID. BMC Med. [Internet] 2021;19(1) doi: 10.1186/s12916-021-02115-0. https://pubmed.ncbi.nlm.nih.gov/33948602/ Apr 27 [cited 2021 Jul 17]. Available from: [DOI] [PMC free article] [PubMed] [Google Scholar]
- 8.Vehar S., Boushra M., Ntiamoah P., Biehl M. Post-acute sequelae of SARS-CoV-2 infection: Caring for the ‘long-haulers’. Cleve Clin. J. Med. [Internet] 2021 May 3;88(5):267–272. doi: 10.3949/ccjm.88a.21010. https://pubmed.ncbi.nlm.nih.gov/33941600/ [cited 2021 Jul 17]. Available from: [DOI] [PubMed] [Google Scholar]
- 9.Nalbandian A., Sehgal K., Gupta A., Madhavan M.V., McGroder C., Stevens J.S., et al. Post-acute COVID-19 syndrome. Nat. Med. 2021 Apr 1;27(4):601–615. doi: 10.1038/s41591-021-01283-z. [DOI] [PMC free article] [PubMed] [Google Scholar]
- 10.Lang R.M., Badano L.P., Victor M.A., Afilalo J., Armstrong A., Ernande L., et al. Recommendations for cardiac chamber quantification by echocardiography in adults: an update from the American Society of Echocardiography and the European Association of Cardiovascular Imaging. J. Am. Soc. Echocardiogr. [Internet] 2015;28(1) doi: 10.1016/j.echo.2014.10.003. https://pubmed.ncbi.nlm.nih.gov/25559473/ [cited 2022 Jan 12]. 1–39.e14. Available from: [DOI] [PubMed] [Google Scholar]
- 11.Baman T.S., Lange D.C., Ilg K.J., Gupta S.K., Liu T.Y., Alguire C., et al. Relationship between burden of premature ventricular complexes and left ventricular function. Heart Rhythm [Internet] 2010 Jul;7(7):865–869. doi: 10.1016/j.hrthm.2010.03.036. https://pubmed.ncbi.nlm.nih.gov/20348027/ [cited 2021 Jul 13]. Available from: [DOI] [PubMed] [Google Scholar]
- 12.Sheldon R.S., Grubb B.P., Olshansky B., Shen W.K., Calkins H., Brignole M., et al. 2015 heart rhythm society expert consensus statement on the diagnosis and treatment of postural tachycardia syndrome, inappropriate sinus tachycardia, and vasovagal syncope. Heart Rhythm. 2015 Jun 1;12(6):e41–e63. doi: 10.1016/j.hrthm.2015.03.029. [DOI] [PMC free article] [PubMed] [Google Scholar]
- 13.Sudre C.H., Murray B., Varsavsky T., Graham M.S., Penfold R.S., Bowyer R.C., et al. Attributes and predictors of long COVID. Nat. Med. [Internet] 2021 Mar 10;27(4):626–631. doi: 10.1038/s41591-021-01292-y. https://www.nature.com/articles/s41591-021-01292-y [cited 2021 Aug 12]. Available from: [DOI] [PMC free article] [PubMed] [Google Scholar]
- 14.Bechmann N., Barthel A., Schedl A., Herzig S., Varga Z., Gebhard C., et al. Sexual dimorphism in COVID-19: potential clinical and public health implications. Lancet Diabet. Endocrinol. [Internet] 2022 Mar 1;10(3):221–230. doi: 10.1016/S2213-8587(21)00346-6. https://pubmed.ncbi.nlm.nih.gov/35114136/ [cited 2022 Jun 26]. Available from: [DOI] [PMC free article] [PubMed] [Google Scholar]
- 15.Ciaglia E., Vecchione C., Puca A.A. COVID-19 infection and circulating ACE2 levels: protective role in women and children. Front. Pediatr. [Internet] 2020 Apr 23;8:206. doi: 10.3389/fped.2020.00206/full. [cited 2021 Feb 11]. Available from: [DOI] [PMC free article] [PubMed] [Google Scholar]
- 16.Peckham H., de Gruijter N.M., Raine C., Radziszewska A., Ciurtin C., Wedderburn L.R., et al. Male sex identified by global COVID-19 meta-analysis as a risk factor for death and ITU admission. Nat. Commun. [Internet] 2020 Dec 1;11(1):1–10. doi: 10.1038/s41467-020-19741-6. [cited 2021 Apr 27]. Available from. [DOI] [PMC free article] [PubMed] [Google Scholar]
- 17.Ståhlberg M., Reistam U., Fedorowski A., Villacorta H., Horiuchi Y., Bax J., et al. Post-Covid-19 tachycardia syndrome: a distinct phenotype of post-acute Covid-19 syndrome. Am. J. Med. [Internet] 2021 Aug 11;134(12):1451–1456. doi: 10.1016/j.amjmed.2021.07.004. https://linkinghub.elsevier.com/retrieve/pii/S0002934321004721 [cited 2021 Aug 18]; Available from: [DOI] [PMC free article] [PubMed] [Google Scholar]
- 18.Goldstein D.S. The possible association between COVID-19 and postural tachycardia syndrome. Heart Rhythm [Internet] 2021 Apr 1;18(4):508. doi: 10.1016/j.hrthm.2020.12.007. [cited 2021 Jul 18]. Available from: /pmc/articles/PMC7729277/ [DOI] [PMC free article] [PubMed] [Google Scholar]
- 19.Raj S.R., Arnold A.C., Barboi A., Claydon V.E., Limberg J.K., Lucci V.-E.M., et al. Long-COVID postural tachycardia syndrome: an American Autonomic Society statement. Clin. Auton. Res. 2021 Mar 19;31(3):365–368. doi: 10.1007/s10286-021-00798-2. [cited 2021 Jul 18]. Available from: [DOI] [PMC free article] [PubMed] [Google Scholar]
- 20.Blitshteyn S., Whitelaw S. Postural orthostatic tachycardia syndrome (POTS) and other autonomic disorders after COVID-19 infection: a case series of 20 patients. Immunol. Res. 2021 Mar 30;69(2):205–211. doi: 10.1007/s12026-021-09185-5. [cited 2021 Jul 18]. Available from: [DOI] [PMC free article] [PubMed] [Google Scholar]
- 21.Barizien N., Le Guen M., Russel S., Touche P., Huang F., Vallée A. Clinical characterization of dysautonomia in long COVID-19 patients. Sci. Report. 2021 Jul 7;11(1):1–7. doi: 10.1038/s41598-021-93546-5. https://www.nature.com/articles/s41598-021-93546-5 [cited 2021 Jul 18]. Available from: [DOI] [PMC free article] [PubMed] [Google Scholar]
- 22.Arano Llach J., Victor Bazan V., Gemma Llados G., Raquel Adelino R., Maria Jesus Dominguez M., Marta Massanella M., et al. Inappropriate sinus tachycardia in post-covid-19 syndrome. EP Eur. [Internet] 2021 May 24;23(Supplement_3) doi: 10.1038/s41598-021-03831-6. https://academic.oup.com/europace/article/23/Supplement_3/euab116.114/6283026 [cited 2021 Jul 18]. Available from: [DOI] [PMC free article] [PubMed] [Google Scholar]
- 23.Gheblawi M., Wang K., Viveiros A., Nguyen Q., Zhong J.C., Turner A.J., et al. vol. 126. Lippincott Williams and Wilkins; 2020. Angiotensin-Converting Enzyme 2: SARS-CoV-2 Receptor and Regulator of the Renin-Angiotensin System: Celebrating the 20th Anniversary of the Discovery of ACE2 [Internet] pp. 1456–1474.www.ahajournals.org/journal/res (Circulation Research). [cited 2021 Apr 23]. Available from: [DOI] [PMC free article] [PubMed] [Google Scholar]
- 24.Beevers G., Lip G.Y.H., O’brien E. The pathophysiology of hypertension. BMJ [Internet] 2001 Apr 14;322(7291):912. doi: 10.1136/bmj.322.7291.912. http://www.bmj.com/ [cited 2021 Apr 27]. Available from: [DOI] [PMC free article] [PubMed] [Google Scholar]
- 25.Yu X., Li H., Murphy T.A., Nuss Z., Liles J., Liles C., et al. Angiotensin II type 1 receptor autoantibodies in postural tachycardia syndrome. J. Am. Heart Assoc. [Internet] 2018 Apr 17;7(8) doi: 10.1161/JAHA.117.008351. http://ahajournals.org [cited 2021 Apr 27]. Available from: [DOI] [PMC free article] [PubMed] [Google Scholar]
- 26.Nägele M.P., Haubner B., Tanner F.C., Ruschitzka F., Flammer A.J. Endothelial dysfunction in COVID-19: current findings and therapeutic implications. Atherosclerosis. 2020 Dec 1;314:58–62. doi: 10.1016/j.atherosclerosis.2020.10.014. [DOI] [PMC free article] [PubMed] [Google Scholar]
- 27.Del Turco S., Vianello A., Ragusa R., Caselli C., Basta G. COVID-19 and cardiovascular consequences: is the endothelial dysfunction the hardest challenge? Thromb. Res. [Internet] 2020 Dec 1;196:143. doi: 10.1016/j.thromres.2020.08.039. [cited 2021 Aug 18]. Available from: /pmc/articles/PMC7451195/ [DOI] [PMC free article] [PubMed] [Google Scholar]
- 28.Brunner H., Cockcroft J.R., Deanfield J., Donald A., Ferrannini E., Halcox J., et al. Endothelial function and dysfunction. Part II: Association with cardiovascular risk factors and diseases. A statement by the Working Group on Endothelins and Endothelial Factors of the European Society of Hypertension. J. Hypertens [Internet] 2005;23(2):233–246. doi: 10.1097/00004872-200502000-00001. https://pubmed.ncbi.nlm.nih.gov/15662207/ [cited 2021 Aug 18]. Available from: [DOI] [PubMed] [Google Scholar]
- 29.Hamming I., Timens W., Bulthuis M.L.C., Lely A.T., Navis G.J., van Goor H. Tissue distribution of ACE2 protein, the functional receptor for SARS coronavirus. A first step in understanding SARS pathogenesis. J. Pathol. [Internet] 2004 Jun;203(2):631–637. doi: 10.1002/path.1570. https://pubmed.ncbi.nlm.nih.gov/15141377/ [cited 2021 Aug 18. Available from: [DOI] [PMC free article] [PubMed] [Google Scholar]
- 30.Varga Z., Flammer A.J., Steiger P., Haberecker M., Andermatt R., Zinkernagel A.S., et al. Endothelial cell infection and endotheliitis in COVID-19. Lancet [Internet] 2020 May 2;395(10234):1417–1418. doi: 10.1016/S0140-6736(20)30937-5. http://www.thelancet.com/article/S0140673620309375/fulltext [cited 2021 Aug 18]. Available from: [DOI] [PMC free article] [PubMed] [Google Scholar]
- 31.Gluckman T.J., Bhave N.M., Allen L.A., Chung E.H., Spatz E.S., Ammirati E., et al. 2022 ACC expert consensus decision pathway on cardiovascular sequelae of COVID-19 in Adults: myocarditis and other myocardial involvement, post-acute sequelae of SARS-CoV-2 infection, and return to play: a report of the American College of Cardiology Solu. J. Am. Coll. Cardiol. [Internet] 2022 May 3;79(17):1717–1756. doi: 10.1016/j.jacc.2022.02.003. https://pubmed.ncbi.nlm.nih.gov/35307156/ [cited 2022 Jun 26]. Available from: [DOI] [PMC free article] [PubMed] [Google Scholar]
- 32.Long B., Brady W.J., Koyfman A., Gottlieb M. Cardiovascular complications in COVID-19. Am. J. Emerg. Med. 2020;38:1504–1507. doi: 10.1016/j.ajem.2020.04.048. W.B. Saunders. [DOI] [PMC free article] [PubMed] [Google Scholar]
- 33.Patone M., Mei X.W., Handunnetthi L., Dixon S., Zaccardi F., Shankar-Hari M., et al. Risks of myocarditis, pericarditis, and cardiac arrhythmias associated with COVID-19 vaccination or SARS-CoV-2 infection. Nat. Med. [Internet] 2021 Dec 14:1–13. doi: 10.1038/s41591-021-01630-0. https://www.nature.com/articles/s41591-021-01630-0 [cited 2022 Jan 12]. Available from: [DOI] [PMC free article] [PubMed] [Google Scholar]
- 34.Bailey A.L., Dmytrenko O., Greenberg L., Bredemeyer A.L., Ma P., Liu J., et al. SARS-CoV-2 infects human engineered heart tissues and models COVID-19 myocarditis. JACC Basic Transl. Sci. 2021;6(4):331–345. doi: 10.1016/j.jacbts.2021.01.002. [DOI] [PMC free article] [PubMed] [Google Scholar]
- 35.Smiseth O.A., Torp H., Opdahl A., Haugaa K.H. Urheim S. Myocardial strain imaging: How useful is it in clinical decision making? Eur. Heart J. [Internet] 2016 Apr 14;37(15):1196–1207. doi: 10.1093/eurheartj/ehv529. https://pubmed.ncbi.nlm.nih.gov/26508168/ [cited 2021 Jul 18]. Available from: [DOI] [PMC free article] [PubMed] [Google Scholar]
- 36.Sengeløv M., Jørgensen P.G., Jensen J.S., Bruun N.E., Olsen F.J., Fritz-Hansen T., et al. Global longitudinal strain is a superior predictor of all-cause mortality in heart failure with reduced ejection fraction. JACC Cardiovasc. Imaging [Internet] 2015 Dec 1;8(12):1351–1359. doi: 10.1016/j.jcmg.2015.07.013. https://pubmed.ncbi.nlm.nih.gov/26577264/ [cited 2021 Jul 18]. Available from: [DOI] [PubMed] [Google Scholar]
Associated Data
This section collects any data citations, data availability statements, or supplementary materials included in this article.
Supplementary Materials
Study design. This figure outlines the number of patients screened and then included in the study as well as the investigations patients had during evaluation.