Abstract
The coherent vibrational dynamics of gold nanoclusters (NCs) provides important information on the coupling between vibrations and electrons as well as their mechanical properties, which is critical for understanding the evolution from a metallic state to a molecular state with diminishing size. Coherent vibrations have been widely explored in small-sized atomically precise gold NCs, while it remains a challenge to observe them in large-sized gold NCs. In this work, we report the coherent vibrational dynamics of atomically precise Au144(SR)60 NCs via temperature-dependent femtosecond transient absorption (TA) spectroscopy. The population dynamics of Au144(SR)60 consists of three relaxation processes: internal conversion, core–shell charge transfer and relaxation to the ground state. After removing the population dynamics from the TA kinetics, fast Fourier transform analysis on the residual oscillation reveals distinct vibrational modes at 1.5 THz (50 cm−1) and 2 THz (67 cm−1), which arise from the wavepacket motions along the ground-state and excited-state potential energy surfaces (PES), respectively. These results are helpful for understanding the physical properties of gold nanostructures with a threshold size that lies in between those of molecular-like NCs and metallic-state nanoparticles.
The coherent vibrational dynamics of Au144(SR)60 nanoclusters was revealed by temperature-dependent ultrafast transient absorption spectroscopy. Both excited-state and ground-state wavepacket motions contribute to the vibrational coherence.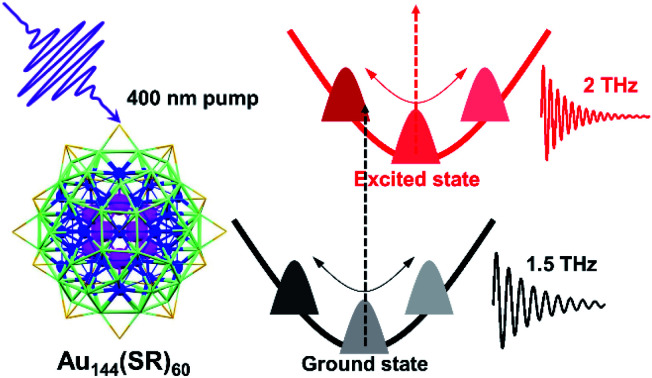
Introduction
Gold nanostructures exhibit unique optical and electronic properties and have received wide attention from researchers owing to promising applications in optical sensing, catalysis, therapeutics, etc.1–6 These distinct properties are highly dependent on the structure, size, and metal composition of nanocrystals. Gold nanoparticles (NPs) with a diameter larger than ∼2 nm are well known to show surface plasmon resonance (SPR) because of the collective oscillations of conduction band electrons.2,7 However, the quantum confinement effect starts to govern the optical properties of sub-2 nm nanoparticles (also known as nanoclusters, NCs), which possess discrete energy levels and molecular-like properties such as single-electron transitions or excitons.4,8,9 The acoustic response of these nanostructures with different sizes has been widely reported,8–18 which originate from different mechanisms. Normally, the photoexcited coherent breathing vibration mode for gold NPs is explained as the impulsive heating of the lattice upon short pulse laser excitation that expands the volume of NPs and results in decreased electronic density, which further gives rise to lattice vibration and periodic shift of the SPR band.11,19 In molecular-like gold NCs, however, the coherent oscillations arise from the wavepacket motions along the ground- and excited-state potential energy surface (PES) generated by ultrafast laser pulses.20–22 The coherent vibrations in small-sized atomically precise gold NCs were well explored experimentally or theoretically, including Au10, Au15, Au25, Au30, Au37, Au38, Au102, etc.,23–29 while such phenomena in large-sized gold NCs (n > 100) have rarely been observed.30 The coherent vibrations have also received wide coverage in the literature previously, including organics, inorganics, biological systems, light harvesting systems, etc.31–44
Among different sized gold NCs, Au144L60 (L = ligands) NCs play a vital role in understanding the size-dependent electronic and optical evolution. Au144L60 has a diameter of ∼2 nm that lies in between those of ultrasmall molecular NCs and larger-size plasmonic gold nanoparticles. The crystal structure of Au144(SR)60 was successfully solved by Yan et al. in 2018.45 They found that the inner core is a hollow icosahedral 12-gold unit (the first layer, Au12, magenta in Fig. 1a), which shows a similar structure to the center-filled icosahedral 13-gold structure (Au13, Fig. 1b and c). The second layer is composed of 42 gold atoms (blue in Fig. 1a), and then 60 gold atoms (third layer, light green in Fig. 1a) enclose the 54 (12 + 42) gold atoms and assemble into a 114-gold core (Au114), on which 30 Au(SR)2 staples (orange in Fig. 1a, non-gold atoms not shown) ride astride, giving rise to a complete Au144(SR)60 structure. In the same year, Lei et al.46 reported the crystal structure of Au144(C CAr)60 (Ar = 2-FC6H4−), which showed a similar kernel structure to that of Au144(SR)60.
Fig. 1. (a) The crystal structure of an Au144(SR)60 NC:45 the inner core Au12 (first layer) is shown in magenta, the second layer of 42 gold atoms is shown in blue, the third layer of 60 gold atoms is shown in light green, and the 30 Au atoms in staples are shown in orange. The non-gold atoms are not shown for clarity. (b) The structure of the hollow Au12 inner core of Au144(SR)60. (c) The structure of icosahedral Au13; the center gold atom is shown in yellow. (d) The matrix-assisted laser desorption ionization (MALDI) mass spectrum of Au144PET60; note that the peak at 17.2 k is doubly charged and the 34 k peak is 1+ charged (in-source ionized). (e) The steady-state absorption spectrum of Au144PET60 dissolved in toluene.
Besides the crystal structure determination of Au144(SR)60 NCs, the physical properties have also attracted considerable research interest. Malola et al.47 reported a computational study of several monolayer-protected Aun NCs by applying the ab initio method together with the atomistic method, and they found that the threshold gold-core diameter for the emergency of the localized surface plasmon effect is between 1.5 nm (Au144(SH)60) and 2 nm (Au314(SH)96). Weissker et al.48 presented a low-temperature absorption spectrum of Au144(SR)60 with clearly visible individual peaks from the UV to the NIR region, conveying quantum confinement characters in the clusters. Yi et al.49 provided an electronic relaxation study of [Au144(SC6H13)60]q (q = −1, 0, +1, +2) by employing femtosecond transient absorption spectroscopy, and they thought that the pump power-dependent bleach recovery kinetics and oxidation state-dependent excited-state absorption kinetics should be assigned to metallic behavior while stimulated emission showed signatures of “superatom” character. Mustalahti et al.50 reported the ultrafast electronic relaxation and vibrational cooling dynamics of Au144(SC2H4Ph)60 using transient mid-IR spectroscopy, in which two relaxation processes corresponding to fast relaxation via electron–phonon coupling and heat dissipation were found. Low-temperature absorption spectroscopy and density functional theory (DFT) calculations conducted by Negishi et al.51 revealed that the metal core of Au144(SC12)60 and smaller NCs have molecular-like electronic structures, whereas the core structures of larger NCs resemble that of bulk gold. Zhou et al.52 performed systematic ultrafast spectroscopy studies on atomically precise gold NCs with different sizes, and they found that Au144(SR)60 and smaller NCs exhibit molecular-like behavior. Lei et al.46 reported that the steady-state absorption spectrum of Au144(C CAr)60 NCs shows two bands at around 560 and 620 nm, indicating molecular-like behavior. Besides, they found that the Au–Au distances in the Au12 core (2.7470–2.7587 Å) are shorter than the average Au–Au distance of bulk face-centered cubic gold (2.884 Å), which also suggests that the bonding is more molecular than metallic. Deng et al.53 found that the origin of the structural stability of Au144(SR)60 and Au144(C CR)60 is due to the thermodynamic stability by applying DFT energy calculation and energy decomposition analysis (EDA); in addition, they also suggested that the Au144 NCs are unique in size because the larger (Au279) and smaller (Au130, Au133) gold NCs both prefer the center-filled gold polyhedrons. Recent work by Du et al.54 reported temperature-dependent (room temperature to 2.5 K) absorption spectra, in which they observed several new features at cryogenic temperatures, which provides strong evidence of discrete energy levels within Au144PET60 (where, PET = SCH2CH2Ph).
Despite the great progress made in the study of the photophysical properties of Au144L60 NCs, the coherent vibrational dynamics still remains unknown, which is thus critical to pursue, and abundant information about interactions between the ambient environment and electronic relaxation may be revealed. In this work, using temperature-dependent femtosecond broadband transient absorption (TA) spectroscopy, we report the photoinduced excited-state population and vibration dynamics of Au144PET60 NCs. By tracking the kinetic traces at different probe wavelengths, the coherent oscillations with frequencies at around 1.5 THz (50 cm−1) and 2 THz (67 cm−1) are obtained. Furthermore, detailed analysis of coherent oscillations has identified the possible contributions of the two vibrational modes in Au144PET60.
Results and discussion
The synthesis of Au144PET60 NCs followed a previous method,55 and the MALDI mass spectrum of Au144PET60 is displayed in Fig. 1d, suggesting the high purity of the sample. Shown in Fig. 1e is the steady-state absorption spectrum of Au144PET60 in toluene, spanning from the UV to the NIR region. There are several broad absorption peaks at around 337, 463, 517 and 700 nm, which agrees with previous reports.50,54,55 From the continuous absorption bands in Au144PET60, it is difficult to extract the energy gap. Koivisto et al.56 collected the optical spectra of an Au144PET60 thin film in IR and NIR regimes, and combined with linear response time-dependent DFT (TD-DFT) calculations, the optical gap of Au144PET60 was determined to be 0.19 eV. Chen et al.57 revealed a 0.17 eV gap for Au144(BM)60 (BM is the abbreviation of benzyl mercaptan) at 298 K by means of cyclic and differential pulse voltammetry experiments. The conclusions of these two reports coincide with each other, suggesting a very small energy gap of Au144 NCs (around 0.2 eV).
To probe the excited-state population and vibration dynamics, we first collected the broadband femtosecond transient absorption of Au144PET60 dissolved in toluene in the visible spectral region with a pump laser of 400 nm (3.1 eV). As shown in Fig. S1,† there is no sign of obvious coherent oscillations in the pseudo-color map, which may be due to the weak coherent vibrations of Au144PET60 in solution that can be easily perturbed by the solvent fluctuation and environmental heat. To obtain coherent oscillation dynamics, the temperature-dependent TA spectra of Au144PET60 dispersed in a PMMA thin film were recorded. As there is no absorption in the visible region for PMMA, the TA experiments of Au144PET60 cannot be affected by the polymer film.
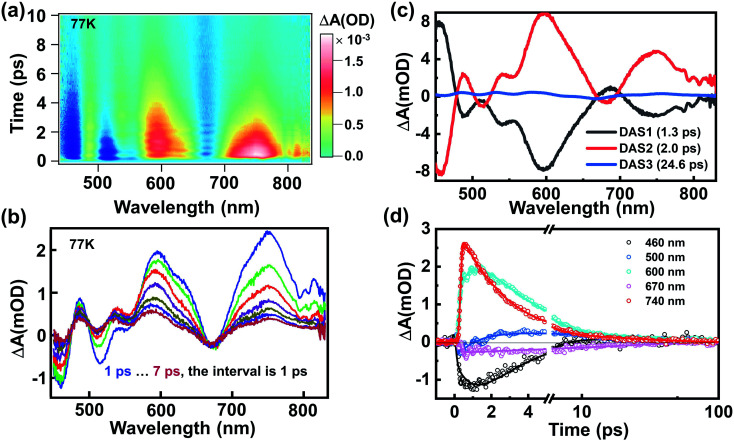
Fig. 2a shows the TA data map of the Au144PET60 film at 77 K; the energy of the excitation pulse (3.1 eV) is significantly higher than the band gap of ∼0.2 eV.56,57 Significant oscillations superimposed on the TA dynamics can be observed. 400 nm excitation forms an excited-state that is localized in the Au114 core (12 + 42 + 60 = 114, as shown in Fig. 1a and b) based on a previous report,48 which is named the core state. Immediately after photon excitation, broad excited-state absorption (ESA) that spanned over most of the probed region was observed instantaneously; and most of the excited-state population decays to the ground state within the first 10 ps (Fig. 2a and b). After global analysis on the TA data,58 the wavelength-dependent amplitudes of characteristic transient components were extracted. As shown in Fig. 2c, the best fitting results with three decay-associated spectra (DAS) are portrayed, and temporal analysis of the three distinct components gives time constants of 1.3 ps, 2.0 ps, and 24.6 ps, respectively. One could observe that DAS1 and DAS2 are almost negatively correlated,24 implying that the amplitude of DAS2 increases on a time scale of 1.3 ps. We assign the first evolution process from DAS1 to DAS2 to internal conversion (from the core state to a relaxed core state) because the 400 nm excitation gives rise to excess excited-state energy, which can also be further evidenced by the kinetic traces shown in Fig. 2d. The ESA at 740 nm was obtained immediately after photoexcitation, whereas 600 nm ESA exhibits a slow growth process in the first ∼1.7 ps, which points to an internal conversion process from the core state to a relaxed core state, i.e., the ESA at 600 nm originates from the relaxed core state to higher excited states. Subsequently, the initial excitation localized in the Au114 core relaxes to a core–shell state because of energy redistribution. The last time-constant (24.6 ps) should be assigned to the relaxation to the ground state. Compared to those smaller gold NCs, the relatively fast decay herein results from the ultrasmall energy gap (∼0.2 eV) of Au144PET60.30
Fig. 2. (a) The TA data map of Au144PET60 dispersed in a polymethyl methacrylate (PMMA) thin film under the excitation of 400 nm at 77 K. (b) The TA spectra as a function of time delay within 7 ps. (c) Decay-associated spectra (DAS) obtained from global analysis on the TA data. (d) TA kinetic traces probed at different wavelengths and the corresponding fitting results of Au144PET60.
The TA spectra at 295 K in the film phase are shown in the S2 part of the ESI.† As shown in Fig. S2a and b,† the TA spectra show some clear trends as the temperature decreases: (1) both ESA and ground-state bleach (GSB) became shaper; (2) both GSB and ESA evolved to higher energies; (3) the intensity of the entire spectra increased. A similar phenomenon was observed in rod-shaped [Au37(PPh3)10(SC2H4Ph)10X2]+ (X = Cl/Br) previously,29 in which the blue-shift and enhancement of ESA at low temperatures implied that the electron–phonon coupling played a vital role in the relaxation process. To understand the thermal effect on the electronic dynamics, the normalized TA kinetic traces measured at different temperatures and corresponding fitting are shown in Fig. S2c–f.† One could find that the electronic dynamics measured at 295 K is slightly faster than that measured at 77 K. This suggests that the heat transfer/dissipation are not the dominant factors during the excited-state relaxation. The blue-shift of the GSB signal is attributed to the increase of the HOMO–LUMO gap as the temperature decreases,57 which was also observed in Au35, Au38, etc.,51,54,59,60 with these phenomena often explained as the interaction between the Au core and phonons at the staple.51,59 The detailed TA spectra and fitting results are shown in Fig. S3 and Table S1.†
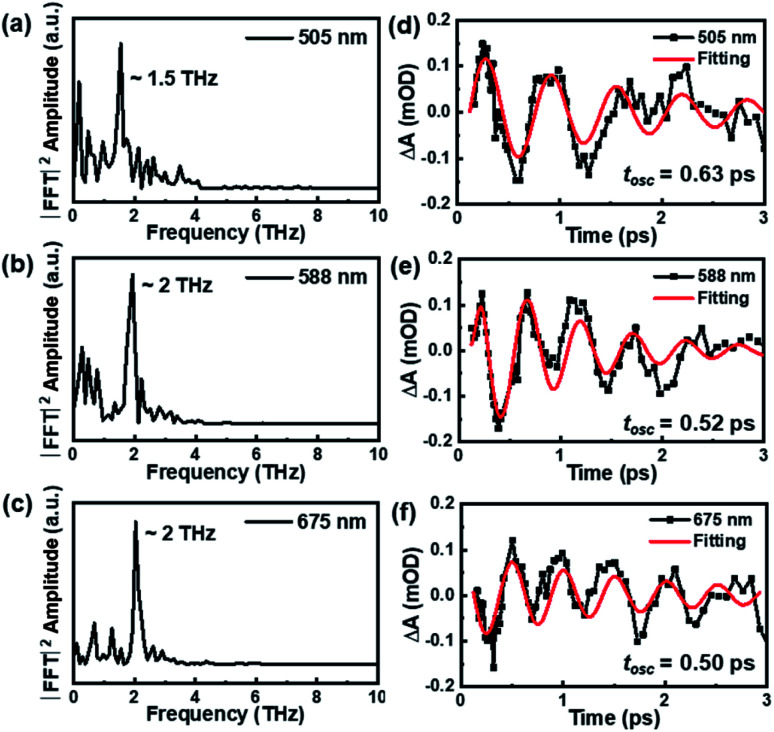
Besides the population dynamics, the coherent vibrational dynamics also provides important information of the excited-state behavior. Upon resonant pump excitation (400 nm), the electronic transition can project a wavepacket onto the excited-state potential, and a wavepacket was formed on the ground-state potential through resonant Raman transition.61 In the initial 3 picoseconds, one can observe significant coherent vibrations at almost all probed wavelengths (Fig. 2a), and the extracted kinetics at selected wavelengths are shown in Fig. S4.† By subtracting the population dynamics of the kinetic traces, the fast Fourier transform (FFT) analyses of the oscillatory components (Fig. 3a–c) give two frequencies of ∼1.5 THz (50 cm−1) and ∼2 THz (67 cm−1) that predominantly contribute to the oscillations of the TA spectra. After careful analysis on the coherent oscillation in Au144PET60 NCs, we found that the ∼1.5 THz oscillation dominates the GSB signal between 500 nm and 550 nm. ∼2 THz oscillation is more significant from 550 nm to 700 nm, in which the excited-state components play a vital role in this region. Of note, there is a negative peak at 660 to 680 nm that was assigned to the stimulated emission (SE) signal previously,49 which also reflects the excited-state dynamics. Overall, we can confirm that the ∼1.5 THz mode originates from the wavepacket motions in the ground-state PES, whereas the ∼2 THz mode arises from excited-state PES.
Fig. 3. The FFT results (a–c) and analysis of oscillatory components (d–f) on the coherent vibrational dynamics of Au144PET60 (77 K) probed at 505 nm, 588 nm, and 675 nm.
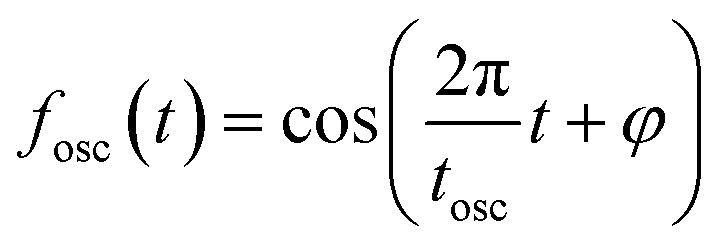
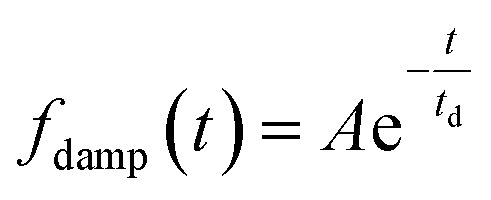
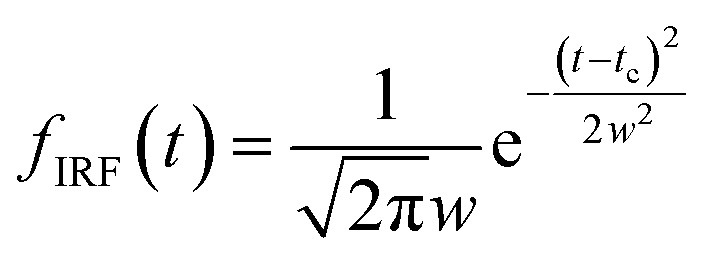
The oscillatory components were fitted with a curve that resembles a cosine curve oscillating in the envelope of an exponential damping function and considering the instrumental response function. The convolution form of the damped oscillation is expressed as follows:24,62,63
 |
1 |
where
 |
2 |
 |
3 |
 |
4 |
f osc(t) represents the cosine oscillating component, fdamp(t) represents the damping component, and fIRF(t) represents the instrumental response function (IRF). The form of convolution can be rewritten as
 |
5 |
in which A denotes the amplitude of the oscillation, tosc denotes the time constant of the oscillation, td denotes the time constant of the damping, tc denotes the time zero of the IRF,  and FWHM denotes the full-width-half-maximum of the IRF, φ is the relative phase of the oscillation, and
 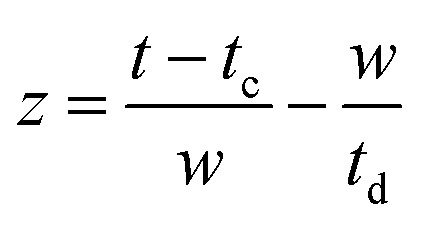 .
.
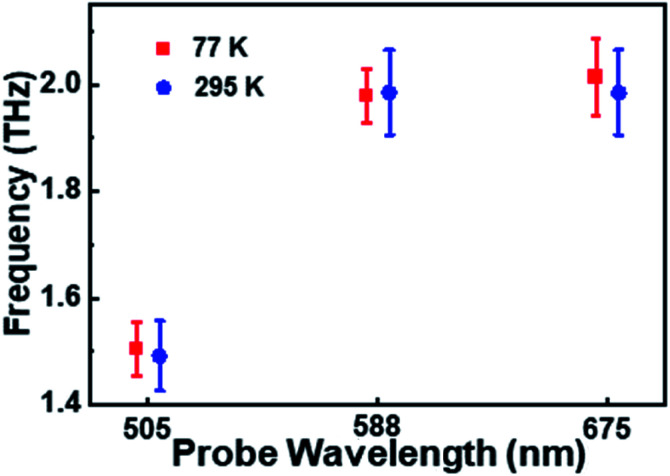
The oscillation period (tosc) monitored at 505 nm was fitted to be 0.64 ps, while tosc probed at 588 nm and 675 nm was ∼0.51 ps. Analysis on the transient absorption at 295 K was also performed, but the oscillatory signals are weaker than those at 77 K. The detailed coherent-vibration dynamics of Au144PET60 obtained at 295 K are shown in Fig. S5 and S6.† Comparing the vibrational data in solution (295 K) and film (77 K and 295 K) states, we found that (1) there are no vibrational signals in the solution state (Fig. S1†), while oscillatory features can be clearly observed in the film state (Fig. 2a and S5a†); (2) at cryogenic temperature, the coherent vibrations become more significant. These can be explained by: (1) the conformational relaxation and vibration of ligands and the Au core will be suppressed in the film state; (2) the reduced environmental noise at low temperatures will enhance the coherent oscillations in the TA kinetics of Au144PET60. The frequency comparison of Au144PET60 collected at 77 K and 295 K is shown in Fig. 4 and Table 1 summarises the parameters from the fitting of oscillatory data.
Fig. 4. The oscillation frequencies as a function of probe wavelength at 77 K and 295 K. Note that the error bars were calculated based on the frequencies probed at around 505 nm, 588 nm, and 675 nm, respectively.
The parameters of coherent oscillations obtained from the TA data.
| Wavelength/nm | Frequency/THz | t osc/ps | Assignment | ||
|---|---|---|---|---|---|
| 77 K | 295 K | 77 K | 295 K | ||
| 505 | ∼1.5 | 0.63 | 0.66 | Ground-state PES | |
| 588 | ∼2 | 0.52 | 0.55 | Excited-state PES | |
| 675 | ∼2 | 0.50 | 0.51 | Excited-state PES | |
The assignment of the oscillatory components is crucial for understanding the excited-state deactivation dynamics. As we discussed above, the inner core of Au144 NCs is hollow icosahedral Au12, which is structurally similar to center-filled icosahedral Au13 (see Fig. 1). Previous coherent oscillatory analysis of rod-shaped [Au37(PPh3)10(SC2H4Ph)10X2]+ (X = Cl/Br) indicated that a 2.1 THz (70 cm−1) vibration arises from the radial breathing mode of the Au13 unit.29 We also note that recent work by Martinet et al.64 reported the low-frequency Raman spectra of Au25(SG)18 (SG = glutathione) and Au25(p-MBA)18 (p-MBA = 4-mercaptobenzoic acid) NCs, in which the 1.9 THz vibration was assigned to the breathing mode of the icosahedral Au13 core. Considering that there are several layers of gold atoms that enclose the Au12 inner core within the Au144PET60 structure, the 2 THz oscillations of Au144PET60 should be ascribed to the breathing mode of the icosahedral Au12 unit. We also observed that the TA profiles probed at 6 ps of Au144 and Au25 are similar to each other (Fig. S7†). Such an observation may suggest some connections of the icosahedral cores (Au12vs. Au13), while further theoretical simulations are required to understand the similar excited-state spectral profiles of Au25 and Au144.
For large counterparts of gold NCs, the continuum mechanical model can be used to predict the coherent oscillation, which gives rise to the empirical relationship ν = 50/R (R is the particle radius).24,65 By substituting R with 0.95 nm (note that the diameter of the entire Au144PET60 is 1.9 nm),66 we obtained 52 cm−1 (1.6 THz). Since Au144PET60 is a spherical structure, one could conclude that the 1.5 THz originates from the entire Au144PET60 NC, which is symmetrically distributed on the entire Au144PET60.
In addition, we note that Au144PET60 has a core–shell spherical structure, which is similar to [Au12(SCH3)9]+, [Au25(SCH3)18]−, and Au102(SCH3)44.23 Maioli et al.23 found that all three gold NCs exhibit two vibrational modes: a low-frequency quadrupolar-like mode (QM for short) and a high-frequency breathing-acoustic mode (BM for short). The BM is a highly symmetric fundamental mode that is formed from in-phase radially symmetric vibration of each atom around the equilibrium position, while the QM is composed of periodical expansion and contraction along one direction accompanied by out-of-phase vibration in the perpendicular direction. It is deduced that the 2 THz and 1.5 THz vibrations of Au144PET60 may arise from the BM and QM, respectively. The accurate assignments of coherent vibration modes of Au144 NCs still require further experimental and theoretical evidence.
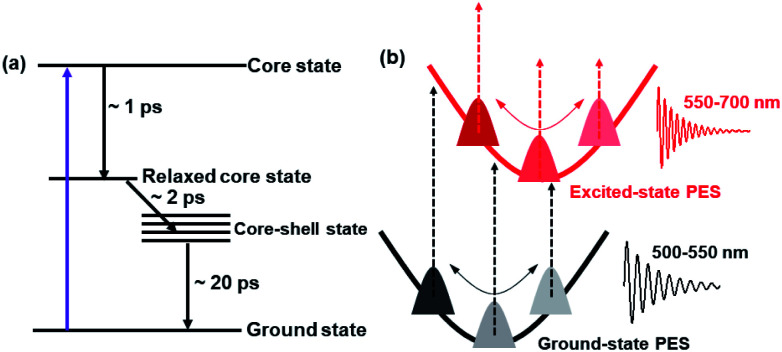
Based on the TA data analysis, the excited-state deactivation diagram and the mechanism of coherent vibrations of Au144 are shown in Fig. 5. As discussed above, the 600 nm ESA originates from the relaxed core state, whereas the 740 nm ESA arises from the core state. With 400 nm (3.1 eV) excitation, the Au114 core is directly populated (core state), and then the energy is redistributed over the entire Au144PET60 NC after the 1.3 ps internal conversion is followed by a 2.0 ps charge transfer (Fig. 5a). The last process is the relaxation to the ground state. Such a fast excited-state relaxation processes agrees with the very small energy gap of Au144PET60 (∼0.2 eV). The energy gap decreases as temperature increases,57 which accelerates the excited-state relaxation at higher temperatures. The 400 nm photoexcitation leads to simultaneous generation of wavepacket motions on the excited- and ground-states61 with frequencies of 2 THz and 1.5 THz, respectively (Fig. 5b). These wavepacket motions result in coherent oscillations in the TA kinetics probed at different wavelengths.
Fig. 5. (a) Proposed excited-state deactivation mechanism of Au144PET60. (b) Schematic diagram of the coherent vibrations of Au144PET60.
Understanding the excited-state population- and vibration-dynamics of gold NCs is crucial for their applications in solar cells,67 photoluminescence68 and nonlinear optical properties.69 The population dynamics pictures the relaxation of excited states, while the coherent vibrational dynamics reflects the detailed interactions between electrons and structural vibrations. The excited-state processes of gold NCs, including charge transfer, energy transfer and excited-state coherence, are detrimental to boost the applications of NCs in photo-energy storage and conversion. Therefore, unravelling the excited-state relaxation mechanisms and measuring the accurate time-constants of the excited-state processes are of great importance.
Large-sized gold nanoclusters (more than 100 gold atoms) are critical for understanding the transition from discrete energy levels to continuous bands in metal nanoparticles. They exhibit broad absorption bands and relatively weak excited state signals. Therefore, it remains a challenge to accurately probe their population- and vibration-dynamics. Among those large sized gold NCs, Au144(SR)60 is a typical example and it has a very small Eg of 0.17 eV.56,57 Therefore, it has no gap emission so that we chose ultrafast TA to probe the population and vibration dynamics of Au144. By applying low-temperature TA, we successfully observed two coherent vibration modes at 77 K, which were hidden at room temperature. Detailed analysis on these coherent vibrations can reveal the origin of electron–phonon coupling in different sized nanoparticles. Based on the current observations and analysis, we found that temperature dependent TA can be a new strategy to investigate the coherent vibrational dynamics of other large-sized metal NCs, which should provide new insight into research in this field.
Conclusions
In summary, we report the coherent vibrational dynamics of Au144PET60 NCs by temperature-dependent transient absorption analysis. Upon photoexcitation, the excited-state relaxation pathways of Au144PET60 can be extracted with three processes, corresponding to the internal conversion, core–shell state and decay to the ground state, respectively. Significant coherent oscillations superimposed on the population dynamics can be observed in the first 3 ps at 77 K and 295 K. We demonstrate that the high-frequency 2 THz oscillation originates from wavepacket motions along the excited-state PES, whereas the low-frequency 1.5 THz oscillation arises from wavepacket motions along the ground-state PES. Based on previous results and the continuum mechanical model, we have proposed two possible assignments of the vibrational modes: (1) the 2 THz mode is localized on the 12-gold-atom inner core while the 1.5 THz mode is symmetrically distributed on the entire Au144PET60; (2) the 2 THz and 1.5 THz modes may also arise from the breathing mode and quadrupolar-like mode of Au144PET60, respectively. We also proposed that low temperature transient absorption should be a new strategy to probe the vibration dynamics of large-sized metal NCs. These results are very helpful for elucidating the electron-vibration interactions of gold NCs with size around 2 nm, which should stimulate broad research interest in this topic.
Data availability
Materials and methods, additional TA data and coherent vibrations have been uploaded as the ESI.† The data that support the findings of this study are available from the corresponding author(s) upon reasonable request.
Author contributions
The manuscript was written through contributions of all authors. All authors have given approval to the final version of the manuscript.
Conflicts of interest
There are no conflicts to declare.
Supplementary Material
Acknowledgments
M. Z. acknowledges the support from the Chinese Academy of Sciences (YSBR-007).
Electronic supplementary information (ESI) available. See https://doi.org/10.1039/d2sc02246j
References
- Yamazoe S. Koyasu K. Tsukuda T. Acc. Chem. Res. 2014;47:816–824. doi: 10.1021/ar400209a. [DOI] [PubMed] [Google Scholar]
- Mayer K. M. Hafner J. H. Chem. Rev. 2011;111:3828–3857. doi: 10.1021/cr100313v. [DOI] [PubMed] [Google Scholar]
- Li G. Jin R. Acc. Chem. Res. 2013;46:1749–1758. doi: 10.1021/ar300213z. [DOI] [PubMed] [Google Scholar]
- Jin R. Zeng C. Zhou M. Chen Y. Chem. Rev. 2016;116:10346–10413. doi: 10.1021/acs.chemrev.5b00703. [DOI] [PubMed] [Google Scholar]
- Kumar S. S. Kwak K. Lee D. Electroanalysis. 2011;23:2116–2124. doi: 10.1002/elan.201100240. [DOI] [Google Scholar]
- García-Álvarez R. Chen L. Nedilko A. Sánchez-Iglesias A. Rix A. Lederle W. Pathak V. Lammers T. von Plessen G. Kostarelos K. Liz-Marzán L. M. Kuehne A. J. C. Chigrin D. N. ACS Photonics. 2020;7:646–652. doi: 10.1021/acsphotonics.9b01418. [DOI] [Google Scholar]
- Hartland G. V. Chem. Rev. 2011;111:3858–3887. doi: 10.1021/cr1002547. [DOI] [PubMed] [Google Scholar]
- Zhou M. Du X. Wang H. Jin R. ACS Nano. 2021;15:13980–13992. doi: 10.1021/acsnano.1c04705. [DOI] [PubMed] [Google Scholar]
- Zhou M. Jin R. Annu. Rev. Phys. Chem. 2021;72:121–142. doi: 10.1146/annurev-physchem-090419-104921. [DOI] [PubMed] [Google Scholar]
- Diroll B. T. Kirschner M. S. Guo P. Schaller R. D. Annu. Rev. Phys. Chem. 2019;70:353–377. doi: 10.1146/annurev-physchem-042018-052639. [DOI] [PubMed] [Google Scholar]
- Hartland G. V. Annu. Rev. Phys. Chem. 2006;57:403–430. doi: 10.1146/annurev.physchem.57.032905.104533. [DOI] [PubMed] [Google Scholar]
- Iwamura M. Kimoto K. Nozaki K. Kuramochi H. Takeuchi S. Tahara T. J. Phys. Chem. Lett. 2018;9:7085–7089. doi: 10.1021/acs.jpclett.8b03139. [DOI] [PubMed] [Google Scholar]
- Yau S. H. Varnavski O. Goodson T. Acc. Chem. Res. 2013;46:1506–1516. doi: 10.1021/ar300280w. [DOI] [PubMed] [Google Scholar]
- Zhou M. Vdović S. Long S. Zhu M. Yan L. Wang Y. Niu Y. Wang X. Guo Q. Jin R. Xia A. J. Phys. Chem. A. 2013;117:10294–10303. doi: 10.1021/jp406336q. [DOI] [PubMed] [Google Scholar]
- Newhouse R. J. Wang H. Hensel J. K. Wheeler D. A. Zou S. Zhang J. Z. J. Phys. Chem. Lett. 2011;2:228–235. doi: 10.1021/jz101716h. [DOI] [Google Scholar]
- Marty R. Arbouet A. Girard C. Mlayah A. Paillard V. Lin V. K. Teo S. L. Tripathy S. Nano Lett. 2011;11:3301–3306. doi: 10.1021/nl201668t. [DOI] [PubMed] [Google Scholar]
- Staechelin Y. U. Hoeing D. Schulz F. Lange H. ACS Photonics. 2021;8:752–757. doi: 10.1021/acsphotonics.1c00078. [DOI] [Google Scholar]
- Kirschner M. S. Lethiec C. M. Lin X.-M. Schatz G. C. Chen L. X. Schaller R. D. ACS Photonics. 2016;3:758–763. doi: 10.1021/acsphotonics.6b00136. [DOI] [Google Scholar]
- Pelton M. Sader J. E. Burgin J. Liu M. Guyot-Sionnest P. Gosztola D. Nat. Nanotechnol. 2009;4:492–495. doi: 10.1038/nnano.2009.192. [DOI] [PubMed] [Google Scholar]
- Bardeen C. J. Wang Q. Shank C. V. Phys. Rev. Lett. 1995;75:3410–3413. doi: 10.1103/PhysRevLett.75.3410. [DOI] [PubMed] [Google Scholar]
- Scholes G. D. Fleming G. R. Chen L. X. Aspuru-Guzik A. Buchleitner A. Coker D. F. Engel G. S. van Grondelle R. Ishizaki A. Jonas D. M. Lundeen J. S. McCusker J. K. Mukamel S. Ogilvie J. P. Olaya-Castro A. Ratner M. A. Spano F. C. Whaley K. B. Zhu X. Nature. 2017;543:647–656. doi: 10.1038/nature21425. [DOI] [PubMed] [Google Scholar]
- Rafiq S S. G. J. Phys. Chem. A. 2016;120:6297–6299. doi: 10.1021/acs.jpca.6b07796. [DOI] [PubMed] [Google Scholar]
- Maioli P. Stoll T. Sauceda H. E. Valencia I. Demessence A. Bertorelle F. Crut A. Vallée F. Garzón I. L. Cerullo G. Del Fatti N. Nano Lett. 2018;18:6842–6849. doi: 10.1021/acs.nanolett.8b02717. [DOI] [PubMed] [Google Scholar]
- Sfeir M. Y. Qian H. Nobusada K. Jin R. J. Phys. Chem. C. 2011;115:6200–6207. doi: 10.1021/jp110703e. [DOI] [Google Scholar]
- Zhou M. Higaki T. Hu G. Sfeir M. Y. Chen Y. Jiang D.-e. Jin R. Science. 2019;364:279–282. doi: 10.1126/science.aaw8007. [DOI] [PubMed] [Google Scholar]
- Senanayake R. D. Guidez E. B. Neukirch A. J. Prezhdo O. V. Aikens C. M. J. Phys. Chem. C. 2018;122:16380–16388. doi: 10.1021/acs.jpcc.8b03595. [DOI] [Google Scholar]
- Qian H. Sfeir M. Y. Jin R. J. Phys. Chem. C. 2010;114:19935–19940. doi: 10.1021/jp107915x. [DOI] [Google Scholar]
- Zhou M. Tian S. Zeng C. Sfeir M. Y. Wu Z. Jin R. J. Phys. Chem. C. 2017;121:10686–10693. doi: 10.1021/acs.jpcc.6b10360. [DOI] [Google Scholar]
- Zhou M. Jin R. Sfeir M. Y. Chen Y. Song Y. Jin R. Proc. Natl. Acad. Sci. 2017;114:E4697–E4705. doi: 10.1073/pnas.1619014114. [DOI] [PMC free article] [PubMed] [Google Scholar]
- Zhou M. Zeng C. Song Y. Padelford J. W. Wang G. Sfeir M. Y. Higaki T. Jin R. Angew. Chem., Int. Ed. 2017;56:16257–16261. doi: 10.1002/anie.201709095. [DOI] [PubMed] [Google Scholar]
- Bolzonello L. Fassioli F. Collini E. J. Phys. Chem. Lett. 2016;7:4996–5001. doi: 10.1021/acs.jpclett.6b02433. [DOI] [PMC free article] [PubMed] [Google Scholar]
- Rafiq S. Fu B. Kudisch B. Scholes G. D. Nat. Chem. 2021;13:70–76. doi: 10.1038/s41557-020-00607-9. [DOI] [PubMed] [Google Scholar]
- Park M. Neukirch A. J. Reyes-Lillo S. E. Lai M. Ellis S. R. Dietze D. Neaton J. B. Yang P. Tretiak S. Mathies R. A. Nat. Commun. 2018;9:2525. doi: 10.1038/s41467-018-04946-7. [DOI] [PMC free article] [PubMed] [Google Scholar]
- Chenu A. Scholes G. D. Annu. Rev. Phys. Chem. 2015;66:69–96. doi: 10.1146/annurev-physchem-040214-121713. [DOI] [PubMed] [Google Scholar]
- Christensson N. Kauffmann H. F. Pullerits T. Mančal T. J. Phys. Chem. B. 2012;116:7449–7454. doi: 10.1021/jp304649c. [DOI] [PMC free article] [PubMed] [Google Scholar]
- Caram J. R. Zheng H. Dahlberg P. D. Rolczynski B. S. Griffin G. B. Fidler A. F. Dolzhnikov D. S. Talapin D. V. Engel G. S. J. Phys. Chem. Lett. 2014;5:196–204. doi: 10.1021/jz402336t. [DOI] [PMC free article] [PubMed] [Google Scholar]
- Pullerits T. Zigmantas D. Sundström V. Proc. Natl. Acad. Sci. 2013;110:1148–1149. doi: 10.1073/pnas.1221058110. [DOI] [PMC free article] [PubMed] [Google Scholar]
- Rury A. S. Sorenson S. A. Dawlaty J. M. J. Phys. Chem. Lett. 2017;8:181–187. doi: 10.1021/acs.jpclett.6b02523. [DOI] [PubMed] [Google Scholar]
- Debnath T. Sarker D. Huang H. Han Z.-K. Dey A. Polavarapu L. Levchenko S. V. Feldmann J. Nat. Commun. 2021;12:2629. doi: 10.1038/s41467-021-22934-2. [DOI] [PMC free article] [PubMed] [Google Scholar]
- Scholes G. D. J. Phys. Chem. Lett. 2018;9:1568–1572. doi: 10.1021/acs.jpclett.8b00734. [DOI] [PubMed] [Google Scholar]
- Chin A. W. Prior J. Rosenbach R. Caycedo-Soler F. Huelga S. F. Plenio M. B. Nat. Phys. 2013;9:113–118. [Google Scholar]
- Johnson P. J. M. Halpin A. Morizumi T. Prokhorenko V. I. Ernst O. P. Miller R. J. D. Nat. Chem. 2015;7:980–986. doi: 10.1038/nchem.2398. [DOI] [PubMed] [Google Scholar]
- Falke S. M. Rozzi C. A. Brida D. Maiuri M. Amato M. Sommer E. Sio A. D. Rubio A. Cerullo G. Molinari E. Lienau C. Science. 2014;344:1001–1005. doi: 10.1126/science.1249771. [DOI] [PubMed] [Google Scholar]
- Thyrhaug E. Bogh S. A. Carro-Temboury M. R. Madsen C. S. Vosch T. Zigmantas D. Nat. Commun. 2017;8:15577. doi: 10.1038/ncomms15577. [DOI] [PMC free article] [PubMed] [Google Scholar]
- Yan N. Xia N. Liao L. Zhu M. Jin F. Jin R. Wu Z. Sci. Adv. 2018;4:eaat7259. doi: 10.1126/sciadv.aat7259. [DOI] [PMC free article] [PubMed] [Google Scholar]
- Lei Z. Li J.-J. Wan X.-K. Zhang W.-H. Wang Q.-M. Angew. Chem., Int. Ed. 2018;57:8639–8643. doi: 10.1002/anie.201804481. [DOI] [PubMed] [Google Scholar]
- Malola S. Lehtovaara L. Enkovaara J. Häkkinen H. ACS Nano. 2013;7:10263–10270. doi: 10.1021/nn4046634. [DOI] [PubMed] [Google Scholar]
- Weissker H. C. Escobar H. B. Thanthirige V. D. Kwak K. Lee D. Ramakrishna G. Whetten R. L. López-Lozano X. Nat. Commun. 2014;5:3785. doi: 10.1038/ncomms4785. [DOI] [PubMed] [Google Scholar]
- Yi C. Tofanelli M. A. Ackerson C. J. Knappenberger K. L. J. Am. Chem. Soc. 2013;135:18222–18228. doi: 10.1021/ja409998j. [DOI] [PubMed] [Google Scholar]
- Mustalahti S. Myllyperkiö P. Lahtinen T. Salorinne K. Malola S. Koivisto J. Häkkinen H. Pettersson M. J. Phys. Chem. C. 2014;118:18233–18239. doi: 10.1021/jp505464z. [DOI] [PubMed] [Google Scholar]
- Negishi Y. Nakazaki T. Malola S. Takano S. Niihori Y. Kurashige W. Yamazoe S. Tsukuda T. Häkkinen H. J. Am. Chem. Soc. 2015;137:1206–1212. doi: 10.1021/ja5109968. [DOI] [PubMed] [Google Scholar]
- Zhou M. Zeng C. Chen Y. Zhao S. Sfeir M. Y. Zhu M. Jin R. Nat. Commun. 2016;7:13240. doi: 10.1038/ncomms13240. [DOI] [PMC free article] [PubMed] [Google Scholar]
- Deng S. Li J. Wang P. Pei Y. Nanoscale. 2021;13:18134–18139. doi: 10.1039/D1NR05227F. [DOI] [PubMed] [Google Scholar]
- Du X. Liu Z. Higaki T. Zhou M. Jin R. Chem. Sci. 2022;13:1925–1932. doi: 10.1039/D1SC06819A. [DOI] [PMC free article] [PubMed] [Google Scholar]
- Qian H. Jin R. Chem. Mater. 2011;23:2209–2217. doi: 10.1021/cm200143s. [DOI] [Google Scholar]
- Koivisto J. Malola S. Kumara C. Dass A. Häkkinen H. Pettersson M. J. Phys. Chem. Lett. 2012;3:3076–3080. doi: 10.1021/jz301261x. [DOI] [PubMed] [Google Scholar]
- Chen S. Higaki T. Ma H. Zhu M. Jin R. Wang G. ACS Nano. 2020;14:16781–16790. doi: 10.1021/acsnano.0c04914. [DOI] [PubMed] [Google Scholar]
- Snellenburg J. Laptenok S. Seger R. Mullen K. Van Stokkum I. J. Stat. Software. 2012;49:1–22. [Google Scholar]
- Devadas M. S. Bairu S. Qian H. Sinn E. Jin R. Ramakrishna G. J. Phys. Chem. Lett. 2011;2:2752–2758. doi: 10.1021/jz2012897. [DOI] [Google Scholar]
- Thanthirige V. D. Kim M. Choi W. Kwak K. Lee D. Ramakrishna G. J. Phys. Chem. C. 2016;120:23180–23188. doi: 10.1021/acs.jpcc.6b09386. [DOI] [Google Scholar]
- Fitzpatrick C. Odhner J. H. Levis R. J. J. Phys. Chem. A. 2020;124:6856–6866. doi: 10.1021/acs.jpca.0c03912. [DOI] [PubMed] [Google Scholar]
- Varnavski O. Ramakrishna G. Kim J. Lee D. Goodson T. ACS Nano. 2010;4:3406–3412. doi: 10.1021/nn1003524. [DOI] [PubMed] [Google Scholar]
- https://webhome.phy.duke.edu/∼rgb/Class/phy51/phy51/node24.html
- Martinet Q. Berthelot A. Girard A. Donoeva B. Comby-Zerbino C. Romeo E. Bertorelle F. van der Linden M. Tarrat N. Combe N. Margueritat J. J. Phys. Chem. C. 2020;124:19324–19332. doi: 10.1021/acs.jpcc.0c04722. [DOI] [Google Scholar]
- Hodak J. H. Henglein A. Hartland G. V. J. Phys. Chem. B. 2000;104:9954–9965. doi: 10.1021/jp002256x. [DOI] [Google Scholar]
- Zhang J. Li Z. Huang J. Liu C. Hong F. Zheng K. Li G. Nanoscale. 2017;9:16879–16886. doi: 10.1039/C7NR06566C. [DOI] [PubMed] [Google Scholar]
- Stamplecoskie K. G. Swint A. J. Mater. Chem. A. 2016;4:2075–2081. doi: 10.1039/C5TA07580G. [DOI] [Google Scholar]
- Narouz M. R. Takano S. Lummis P. A. Levchenko T. I. Nazemi A. Kaappa S. Malola S. Yousefalizadeh G. Calhoun L. A. Stamplecoskie K. G. Häkkinen H. Tsukuda T. Crudden C. M. J. Am. Chem. Soc. 2019;141:14997–15002. doi: 10.1021/jacs.9b07854. [DOI] [PubMed] [Google Scholar]
- Olesiak-Banska J. Waszkielewicz M. Obstarczyk P. Samoc M. Chem. Soc. Rev. 2019;48:4087–4117. doi: 10.1039/C8CS00849C. [DOI] [PubMed] [Google Scholar]
Associated Data
This section collects any data citations, data availability statements, or supplementary materials included in this article.
Supplementary Materials
Data Availability Statement
Materials and methods, additional TA data and coherent vibrations have been uploaded as the ESI.† The data that support the findings of this study are available from the corresponding author(s) upon reasonable request.


