

Abstract
Arterial stiffness (AS), measured by arterial stiffness index (ASI), is a determinant in cardiovascular (CV) diseases. A high serum uric acid (SUA) level is a known risk factor for CV disease. The authors investigated the relationship between SUA and ASI in the middle‐age UK Biobank population study. AS was defined as ASI > 10 m/s. A cross‐sectional study was conducted from 126 663 participants. Participants were divided into four quartiles according to SUA levels and sex. Sex multivariate analyses were performed with adjustment for confounding factors. The average ASI for overall participants was 9.3 m/s (SD: 2.9); 9.9 m/s (SD: 2.8) for men and 8.7 m/s (SD: 2.9) for women (P < .001). Men presented higher SUA rate (351.3 mmol/L (SD:67.9)) than women (270.7 mmol/L (SD:64.4)), P < .001. In men multivariate analysis, SUA remained a determinant of AS, with an increase in the strength of the association between the quartiles, Q4 versus Q1, OR = 1.10 [1.05–1.16], P < .001, Q3 versus Q1, OR = 1.09 [1.04–1.14], P < .001 but not between Q2 and Q1 (P = .136). In women, SUA remained significant for AS, with an increase in the strength of the association between the quartiles, Q4 versus Q1, OR = 1.22 [1.15–1.30], P < .001, Q3 versus Q1, OR = 1.13 [1.07–1.19], P < .001 and no difference between Q2 and Q1 (P = .101). When applying continuous SUA values in the multivariate analysis, SUA remained significant (P < .001), with a Youden index value for men = 338.3 mmol/L and for women = 267.3 mmol/L. High SUA levels were associated with AS, suggesting that SUA could be used as a predictor of atherosclerosis.
Keywords: arterial stiffness, arterial stiffness index, atherosclerosis, cardiovascular disease, sex difference, urate, uric acid
1. INTRODUCTION
Atherosclerosis is a main pathological mechanism of cardiovascular (CV) diseases, 1 but early atherosclerosis is lack of specific manifestations, thus, atherosclerosis is easy to be ignored in its early stages. 2 Therefore, how to identify arterial stiffness early is an important strategy to prevent and manage CV diseases. With the gradual development of medical equipment and the continuous improvement of people's attention to CV diseases, the technology of evaluating arterial stiffness by non‐invasive method has become the focus of clinicians.
Arterial stiffness, measured by arterial stiffness index (ASI), can be considered as a major denominator in target organ damage. 3 Numerous noninvasive arterial parameters have been shown to be biomarkers of arterial stiffness. 4 Arterial stiffness is the arteries capacities to expand and contracts face to the cardiac flow. Arterial stiffness can be an integrator of long‐lasting arterial wall damage leading to a luminal dilation due to increase in collagen deposition. 5 Arterial stiffness is associated with coronary atherosclerosis, 6 CV events 7 or inflammatory disorders. 8
Several studies have shown that carotid‐femoral (aortic) pulse wave velocity (PWV) can considered as the criterion standard of arterial stiffness. PWV levels are strongly correlated with risk factors such as atherosclerosis, 9 hypertension and diabetes, 10 and CV diseases. 11 Nevertheless, PWV measurement is time‐consuming and operator dependent.
In parallel, ASI is a simple, operator independent, convenient and noninvasive device to measure arterial stiffness through the utilization of infrared light (photoplethysmography) to record the volume waveform of the blood into the finger. The shape of the waveform is directly associated to the time it takes for the pulse wave to cross by the arterial tree. These ASI tools could be of interest for rapid estimation of CV risk. 5 , 12 A high serum uric acid (SUA) level is a known risk factor for cardiovascular disease. 13 , 14 Epidemiologic studies have also found an association between high SUA level and arterial stiffness in patients with various disorders such as diabetes, hypertension, and chronic kidney disease. 15 But this relationship remains still controversial and few reports were performed in general population. 14 , 16 , 17
Thus, our cross‐sectional study investigated the association between SUA and arterial stiffness as evaluated by ASI in the large middle‐aged UK Biobank population.
2. METHODS
2.1. UK Biobank population
The UK Biobank is a prospective cohort for the investigation, prevention, diagnosis and treatment of chronic diseases, such as CV diseases in adults. 502 478 Britons aged 40 to 70 years old across 22 UK cities from the UK National Health Service Register were included between 2006 and 2010. The cohort was phenotyped and genotyped, by participants who responded to a questionnaire; a computer‐assisted interview; physical and functional measures; and blood, urine, and saliva samples. 18 Data included socio‐economic, behavior and lifestyle, mental health battery, clinical diagnoses and therapies, genetics, imaging and physiological biomarkers from blood and urine samples. The cohort protocol can be found in literature. 19 All participants provided electronic informed consent and UK Biobank received ethical approval from the North‐West Multi‐center Research Ethics Committee (MREC) covering the whole of UK. The study was conducted according to the guidelines of the Declaration of Helsinki, and approved by the North West – Haydock Research Ethics Committee (protocol code: 21/NW/0157, date of approval: 21 June 2021). For details https://www.ukbiobank.ac.uk/learn‐more‐about‐uk‐biobank/about‐us/ethics
2.2. Blood pressure measurement
Systolic and diastolic blood pressure (SBD, DBP) were measured twice at the assessment center by the use of an automated BP device (Omron 705 IT electronic blood pressure monitor; OMRON Healthcare Europe B.V. Kruisweg 577 2132 NA Hoofddorp), or manually by the use of a sphygmomanometer with an inflatable cuff in association with a stethoscope if the blood pressure device failed to measure the BP or if the largest inflatable cuff of the device did not fit around the individual's arm. 20
The participant was sitting in a chair for performing all the measures. The measures were carried out by nurses trained in performing BP measures. 21 Multiple available measures for one participant were averaged. The Omron 705 IT BP monitor has satisfied the Association for the Advancement of Medical Instrumentation SP10 standard and was validated by the British Hypertension Society protocol, with an overall “A” grade for both SBP and DBP. 22 Nevertheless, automated devices measure higher BP in comparison to manual sphygmomanometers, thus, we adjusted both SBP and DBP which were measured using the automated device using algorithms 23 :
For SBP, we performed the following algorithm:
For DBP, we performed the following algorithm:
These adjusted BP values were used for all calculations, including mean BP calculation.
Mean BP was calculated as:
2.3. Outcomes
Pulse wave arterial stiffness index (ASI) was measured by non‐invasive method during a volunteer's visit to a UK Biobank Assessment Center. Pulse waveform was taken by clipping a photoplethysmograph transducer (PulseTrace PCA 2, CareFusion, USA) to the rested volunteer's finger (any finger or thumb, mainly the index finger). Volunteers were asked to breathe in and out slowly five times in a relaxed fashion and readings were taken over a 10–15 s time. ASI is performed from a single peripheral pulse waveform. The carotid‐to‐femoral pulse transit time was estimated from the dicrotic waveform as the time difference between a forward compound when the pressure is transmitted from the left ventricle to the finger and a reflected or backward compound as the wave is transmitted from the heart to lower body via the aorta. 24 ASI was estimated in meters per second (m/s) as: H/PTT. H is the individual's height, and PTT is the pulse transit time or the peak‐to‐peak time between the systolic and diastolic wave peaks in the dicrotic waveform. 24 This methodology has been validated by comparing it with carotid‐femoral PWV. These studies concluded that both measure methods were highly correlated. ASI was a simple, operator independent, non‐expensive and rapid method. 12 , 25 , 26 We excluded extreme outlier ASI values from the analyses. ASI > 10 m/s defined arterial stiffness.
2.4. Laboratory and clinical parameters
Hypertension was defined as systolic blood pressure (SBP) at least 140 mm Hg and/or diastolic BP (DBP) at least 90 mm Hg, according to guidelines by the European Society of Cardiology, and/ or antihypertensive drug used 27 or hypertension diagnosed by a doctor. Diabetes status was defined on either receiving anti‐diabetic medication or diabetes diagnosed by a doctor or a fasting glucose concentration ≥7 mmol/L. Dyslipidemia was defined as having a fasting plasma total‐cholesterol or triglycerides level of ≥6.61 mmol/L (255 mg/dl) or > 1.7 mmol/L (150 mg/dl), respectively, or having statins medication. 28 Calculated‐glomerular filtration rate (GFR) (by MDRD formula, MDRD: modification of diet in renal disease, by ml/min/1.73m2; GFR < 60 ml/min/1.73 m2 defined chronic kidney disease (CKD)). Current tobacco smokers were defined as participants who responded “yes, on most or all days” at the question “do you smoke tobacco now”. CV diseases were defined by heart attack, angina and stroke, as diagnosed by a doctor and reported in questionnaires. Medications were characterized by the question: “Do you regularly take any of the following medications?”. Uric acid lowering therapy was defined as reported by patients who had allopurinol, benzbromarone, febuxostat, probenecid or sulfinpyrazone. 29 Body mass index was calculated as weight (in kg) divided by heigh2 (meter). ASI > 10 m/s defined arterial stiffness. Biological parameters were detailed in the UK Biobank protocol. 30
2.5. Study population
Based on the 502 478 volunteers of the UK Biobank, participants with missing data and extreme values of ASI (defined as mean +/‐ 5*standard deviation) 31 and extreme values of SUA (.5% participants with extreme values) 32 were excluded to include 126 663 participants for the analyses.
2.6. Statistical analysis
Characteristics of the study population were described as the means with standard deviation (SD) for continuous variables and number and percentage for categorical variables. Analyses were performed via a sex stratification. SUA levels were categorized into quartiles. 16 , 33 To compare characteristics among the quartiles, we used the one‐way ANOVA test for continuous variables and the chi‐square test for categorical variables.
Arterial stiffness was defined as ASI > 10 m/s. Multivariate logistic analyses were performed to assess the relationship between arterial stiffness and SUA according to sex and with adjustment for BMI, GFR, C reactive protein (CRP), heart rate (HR), mean BP, age, testosterone, Insulin‐like Growth Factor One (IGF‐1), high density lipoprotein (HDL) cholesterol, fasting glucose, total cholesterol, triglycerides, tobacco status, low density lipoprotein (LDL) cholesterol, creatinine, urea, uric acid lowering therapy and CV diseases (+hormone therapy for women). Mean BP was determined for adjustment factor due to the high collinearity observed between SBP, DBP and MBP. Each parameter was performed independently to assess its association with arterial stiffness, SBP showed an AUC = .605, DBP an AUC = .611 and mean BP an AUC = .616, thus, mean BP was included in the multiple regression models because of its higher association with arterial stiffness.
Associations between SUA levels and ASI values were examined with linear regression models with adjustment for all confounding factors. Interactions were examined by including simultaneously cannabis use status and one of the covariates, their interaction term and adjustment for all other covariates.
The maximum Youden index of SUA values, performed as:
was chosen to determine the optimal decision thresholds (c) for the discrimination based on as sensitivity and as specificity. 34
A sensitivity analysis was performed by creating two subgroups of population: a population without CV diseases, diabetes and hypertension (N = 61 453) and a population with at least a CV disease, diabetes or hypertension (N = 65 210). Multivariate logistic analyses were performed to assess the relationship between arterial stiffness and SUA according to sex and these two groups with adjustment for all covariates.
Statistics were performed using SAS software (version 9.4; SAS Institute, Carry, NC, USA). A P value < .05 was considered statistically significant.
3. RESULTS
The clinical and biological characteristics of our population were stratified into four quartiles groups according to the distribution of the SUA values (Table 1 ). The four quartiles of SUA were defined as follows: for men, SUA < 303.9 mmol/L for Q1, Q2: 303.9 mmol/L to 348.1 mmol/L, Q3/ 349.1 mmol/L to 396.1 mmol/L and Q4 > 396.1 mmol/; for women, Q1: SUA < 225.4 mmol/L, Q2: 225.4 mmol/L to 264.3 mmol/M, Q3: 264.3 mmol/L to 309.2 mmol/L, and for Q4 > 309.2 mmol/L.
TABLE 1.
Baseline characteristics of total study population by quartiles (n = 126 663)
| Q1 | Q2 | Q3 | Q4 | ||||||
|---|---|---|---|---|---|---|---|---|---|
| MEN | N = 16 038 | N = 16 046 | N = 16 009 | N = 15 999 | P value | ||||
| Hypertension | 8120 | 50.6% | 8765 | 54.6% | 9548 | 59.6% | 11040 | 69.0% | <.001 |
| Diabetes | 1827 | 11.4% | 1237 | 7.7% | 1176 | 7.3% | 1355 | 8.5% | <.001 |
| Dyslipidemia | 8683 | 54.1% | 9823 | 61.2% | 10757 | 67.2% | 12098 | 75.6% | <.001 |
| Chronic Kidney disease (CKD) | 117 | .7% | 154 | 1.0% | 285 | 1.8% | 693 | 4.3% | <.001 |
| Antihypertensive medication | 3304 | 20.8% | 3426 | 21.5% | 3901 | 24.6% | 5467 | 34.5% | <.001 |
| Anti‐diabetes medication | 1183 | 7.4% | 706 | 4.4% | 639 | 4.0% | 722 | 4.5% | <.001 |
| Statins | 3682 | 23.2% | 3572 | 22.5% | 3818 | 24.0% | 4515 | 28.5% | <.001 |
| Hormone medication | – | – | – | – | – | – | – | – | – |
| CV diseases | 1177 | 7.3% | 1160 | 7.2% | 1255 | 7.8% | 1522 | 9.5% | <.001 |
| Current tobacco | 1764 | 11.0% | 1403 | 8.7% | 1224 | 7.6% | 1010 | 6.3% | <.001 |
| Arterial Stiffness Index (ASI), m/s | 9.71 | 2.85 | 9.85 | 2.88 | 9.99 | 2.80 | 10.13 | 2.80 | <.001 |
| ASI > 10 m/s | 7108 | 44.3% | 7439 | 46.4% | 7832 | 48.9% | 8117 | 50.7% | <.001 |
| Age (years) | 56.89 | 8.29 | 56.88 | 8.32 | 57.06 | 8.25 | 57.21 | 8.19 | <.001 |
| BMI (kg/m2) | 26.22 | 3.89 | 27.24 | 3.85 | 28.18 | 3.99 | 29.55 | 4.35 | <.001 |
| SBP mm Hg | 136.72 | 15.99 | 138.00 | 15.85 | 139.10 | 15.85 | 140.63 | 15.82 | <.001 |
| DBP mm Hg | 82.92 | 7.86 | 83.94 | 7.85 | 84.84 | 7.94 | 85.84 | 8.02 | <.001 |
| MBP mm Hg | 100.85 | 9.78 | 101.96 | 9.70 | 102.93 | 9.71 | 104.10 | 9.68 | <.001 |
| HR bpm | 66.61 | 11.39 | 66.75 | 11.29 | 67.61 | 11.57 | 68.91 | 12.12 | <.001 |
| C reactive protein (CRP), mg/L | 2.13 | 4.42 | 2.20 | 4.14 | 2.36 | 3.85 | 2.85 | 4.30 | <.001 |
| Glucose, mmol/L | 5.37 | 1.80 | 5.20 | 1.20 | 5.19 | 1.05 | 5.25 | 1.02 | <.001 |
| HbA1c, mmol/L | 37.24 | 9.68 | 36.28 | 7.07 | 36.23 | 6.17 | 36.63 | 6.63 | <.001 |
| HDL cholesterol, mmol/L | 1.34 | .33 | 1.30 | .31 | 1.28 | .30 | 1.25 | .30 | <.001 |
| LDL cholesterol, mmol/L | 3.35 | .83 | 3.46 | .84 | 3.52 | .87 | 3.52 | .89 | <.001 |
| Total cholesterol, mmol/L | 5.33 | 1.08 | 5.46 | 1.09 | 5.53 | 1.13 | 5.54 | 1.18 | <.001 |
| Triglycerides, mmol/L | 1.65 | .94 | 1.83 | 1.02 | 1.98 | 1.10 | 2.25 | 1.26 | <.001 |
| Testosterone, nmol/L | 12.88 | 3.98 | 12.32 | 3.75 | 11.89 | 3.55 | 11.22 | 3.47 | <.001 |
| Insulin like Growth Factor (IGF), nmol/L | 22.16 | 5.66 | 22.29 | 5.47 | 21.90 | 5.41 | 21.38 | 5.50 | <.001 |
| Serum Uric Acid (SUA), mmol/L | 274.5 | 38.6 | 326.9 | 21.6 | 370.7 | 23.8 | 432.2 | 50.1 | <.001 |
| Uric acid lowering therapy (n, %) | 557 | 3.47% | 334 | 2.08% | 300 | 1.87% | 337 | 2.11% | <.001 |
| Glomerular filtration rate (GFR), ml/min/1.73 m2 | 99.24 | 18.95 | 94.14 | 16.31 | 90.87 | 16.14 | 86.83 | 16.67 | <.001 |
| Creatinine, micromol/L | 77.11 | 16.85 | 80.35 | 12.00 | 83.13 | 17.66 | 86.98 | 19.00 | <.001 |
| Urea, mmol/L | 5.29 | 1.30 | 5.46 | 1.25 | 5.61 | 1.32 | 5.87 | 1.56 | <.001 |
| Q1 | Q2 | Q3 | Q4 | ||||||
|---|---|---|---|---|---|---|---|---|---|
| WOMEN | N = 15 660 | N = 15 641 | N = 15 654 | N = 15 616 | P value | ||||
| Hypertension | 4104 | 26.2% | 5021 | 32.1% | 6250 | 39.9% | 8896 | 57.0% | <.001 |
| Diabetes | 549 | 3.5% | 535 | 3.4% | 744 | 4.8% | 1417 | 9.1% | <.001 |
| Dyslipidemia | 5637 | 36.0% | 6903 | 44.1% | 8336 | 53.3% | 10583 | 67.8% | <.001 |
| Chronic Kidney disease (CKD) | 58 | .4% | 115 | .7% | 305 | 1.9% | 914 | 5.9% | <.001 |
| Antihypertensive medication | 1312 | 8.4% | 1781 | 11.5% | 2589 | 16.6% | 5134 | 33.0% | <.001 |
| Anti‐diabetes medication | 284 | 1.8% | 265 | 1.7% | 343 | 2.2% | 704 | 4.5% | <.001 |
| Statins | 1178 | 7.6% | 1412 | 9.1% | 1958 | 12.6% | 3123 | 20.1% | <.001 |
| Hormone medication | 969 | 6.2% | 1055 | 6.8% | 995 | 6.4% | 927 | 6.0% | .026 |
| CV diseases | 318 | 2.0% | 351 | 2.2% | 475 | 3.0% | 783 | 5.0% | <.001 |
| Current | 1140 | 7.3% | 1017 | 6.5% | 984 | 6.3% | 929 | 5.9% | <.001 |
| Arterial Stiffness Index (ASI), m/s | 8.26 | 2.80 | 9.48 | 2.91 | 8.78 | 3.01 | 9.27 | 3.15 | |
| Arterial Stiffness (ASI > 10 m/s) | 3801 | 24.3% | 4265 | 27.3% | 4916 | 31.4% | 5848 | 37.4% | <.001 |
| Age (years) | 54.00 | 8.31 | 55.36 | 8.21 | 56.68 | 7.96 | 58.31 | 7.43 | <.001 |
| BMI (kg/m2) | 24.70 | 3.84 | 26.04 | 4.31 | 27.55 | 4.77 | 30.45 | 5.84 | <.001 |
| Systolic BP mm Hg | 123.66 | 17.29 | 126.45 | 17.53 | 128.95 | 17.54 | 132.48 | 17.27 | <.001 |
| Diastolic BP mm Hg | 78.00 | 7.80 | 79.37 | 7.84 | 80.49 | 7.93 | 82.17 | 7.94 | <.001 |
| Mean BP mm Hg | 93.22 | 10.17 | 95.06 | 10.21 | 96.64 | 10.20 | 98.94 | 9.92 | <.001 |
| HR bpm | 68.38 | 9.76 | 68.71 | 10.02 | 69.47 | 10.46 | 71.10 | 11.29 | <.001 |
| C reactive protein (CRP), mg/L | 1.73 | 3.53 | 2.09 | 3.53 | 2.63 | 3.88 | 3.91 | 4.80 | <.001 |
| Glucose, mmol/L | 5.05 | 1.04 | 5.07 | .89 | 5.13 | .93 | 5.28 | 1.03 | <.001 |
| HbA1c, mmol/L | 34.87 | 6.06 | 35.21 | 5.52 | 35.89 | 5.64 | 37.49 | 6.78 | <.001 |
| HDL cholesterol, mmol/L | 1.68 | .37 | 1.65 | .37 | 1.60 | .38 | 1.50 | .37 | <.001 |
| LDL cholesterol, mmol/L | 3.50 | .82 | 3.60 | .84 | 3.69 | .87 | 3.74 | .92 | <.001 |
| Total cholesterol, mmol/L | 5.76 | 1.07 | 5.87 | 1.09 | 5.96 | 1.13 | 5.97 | 1.20 | <.001 |
| Triglycerides, mmol/L | 1.25 | .63 | 1.39 | .71 | 1.56 | .80 | 1.88 | .97 | <.001 |
| Testosterone, nmol/L | 1.08 | .60 | 1.10 | .57 | 1.12 | .70 | 1.18 | .73 | <.001 |
| Insulin like Growth Factor (IGF), nmol/L | 22.10 | 5.73 | 21.67 | 5.73 | 21.15 | 5.68 | 19.94 | 5.62 | <.001 |
| Serum Uric Acid (SUA), mmol/L | 200.6 | 32.4 | 245.4 | 19 | 284.9 | 21.8 | 344.9 | 52 | <.001 |
| Uric acid lowering therapy (n, %) | 26 | .17% | 20 | .13% | 30 | .19% | 33 | .21% | .321 |
| Glomerular filtration rate (GFR), ml/min/1.73 m2 | 98.22 | 16.67 | 92.77 | 15.64 | 88.98 | 15.88 | 84.32 | 16.92 | <.001 |
| Creatinine, micromol/L | 60.32 | 9.41 | 63.22 | 13.29 | 65.37 | 13.21 | 68.68 | 14.06 | <.001 |
| Urea, mmol/L | 4.72 | 1.11 | 4.99 | 1.14 | 5.23 | 1.19 | 5.62 | 1.45 | <.001 |
Categorical values: n and %, continuous values: mean and SD (standard deviation), SUA: median and interquartile range [IQR].
Abbreviations: CV, cardiovascular; BP, blood pressure; BMI, body mass index.
Sixty four thousand and nine two (50.6%) of the participants were men and 62 571 (49.4%) were women. Mean age of the overall participants was 56.6 years (SD: 8.2, minimal age: 40 years and maximal: 70 years). The mean average ASI for all the participants was 9.3 m/s (SD: 2.9), 9.9 m/s (SD: 2.8) for men and 8.7 m/s (SD: 2.9) for women (men vs. women, P < .001). Men presented higher rate of SUA (351.3 mmol/L (SD:67.9)) than women (270.7 mmol/L (SD:64.4)), P < .001. Only 1.29% of the overall population had uric acid lowering therapy, with a higher rate in men than in women (2.38% vs. .17%, P < .001). Only 7.5% of our study population was current smoker, but this rate was higher in men than in women (8.4% vs. 6.5%, P < .001).
A linear relationship between SUA levels and ASI values was observed among men (P < .001) and women (P < .001) (Figure 1 ) which remained significant after adjustment for all confounding factors, among men (P = .003) and women (P < .001).
FIGURE 1.
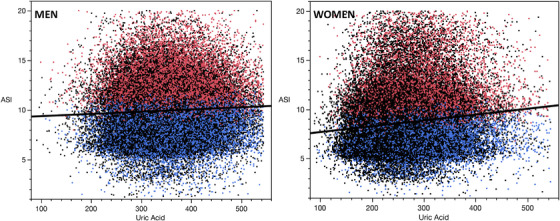
Linear relationship between SUA and ASI. SUA: serum uric acid; ASI: arterial stiffness index
A significant increase was observed for ASI levels across the different quartiles of SUA levels in both sex (P < .001) (Table 1 , Figure 2 ), and this with an age‐interaction with SUA for ASI levels (in both sex, p for interaction < .001) (Figure 3 ).
FIGURE 2.
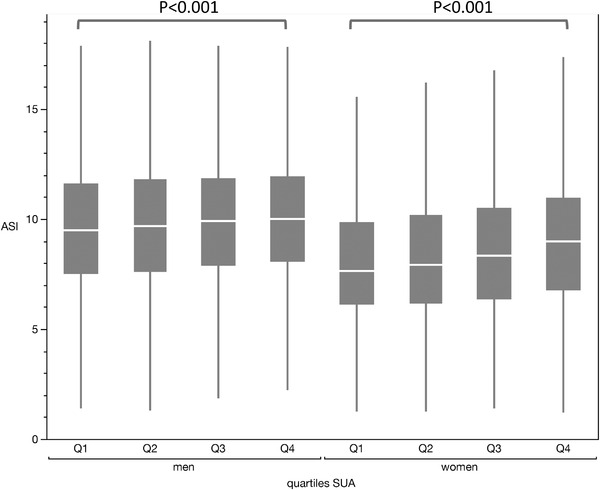
ASI values according to SUA quartiles and sex
FIGURE 3.
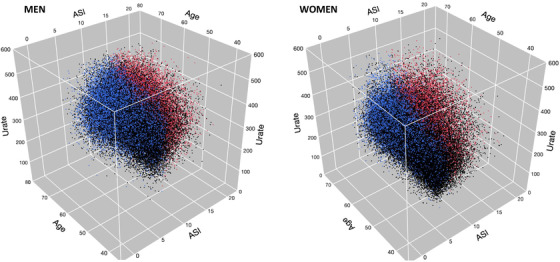
3D representation of the interaction between age and SUA on ASI values
Those in the higher quartile of SUA showed higher hypertension, diabetes, dyslipidemia, CKD, CV diseases in both sex (P < .001, for all covariates) (Table 1 ). Moreover, participants in the higher quartiles presented higher mean average of age, BMI, blood pressure, heart rate, CRP, fasting glucose, LDL cholesterol, total cholesterol, triglycerides, IGF‐1 than the others for both sex (P < .001), but lower HDL cholesterol and GFR levels. In contrast, men in the higher quartiles showed lower mean average of testosterone than the other quartiles (11.2 nmol/L (3.5) for Q4 vs. 12.9 nmol/L (4.0) for Q1), whereas it was the inverse among women (1.2 nmol/L (.7) for Q4 vs. 1.1 nmol/L (.6) for Q1, P < .001).
In the multivariate analysis among men, after adjustment for confounding factors, SUA remained an independent factor of arterial stiffness (defined by ASI > 10 m/s), with an increase in the strength of the association between the quartiles, that is, Q4 versus Q1, OR = 1.10 [1.05–1.16], P < .001, Q3 versus Q1, OR = 1.09 [1.04–‐1.14], P < .001 and no difference between Q2 and Q1 (P = .136). In the multivariate analysis, BMI (P < .001), HR (P = .048), Mean BP (P < .001), age (P < .001), IGF (P < .001), HDL cholesterol (P < .001), fasting glucose (P < .001), total cholesterol (P < .001), triglycerides (P < .001), tobacco status (P < .001), creatinine (P = .045), CV diseases (P = .006) and uric acid lowering therapy (P = .032) remained significant (Table 2 ). When applying continuous SUA values in the multivariate analysis, SUA remained significant (P < .001), with a Youden index value equal to 338.3 mmol/L.
TABLE 2.
Multivariate logistic analyses for arterial stiffness (ASI > 10 m/s) for men, women and overall study population
| Men | ||
|---|---|---|
| Parameters | OR 95%CI | P value |
| BMI (kg/m2) | 1.02 [1.01–‐1.03] | <.001 |
| Glomerular filtration rate (GFR), ml/min/1.73 m2 | 1.00 [.99–1.01] | .106 |
| C reactive protein (CRP), mg/L | 1.00 [.99–1.01] | .335 |
| HR bpm | 1.01 [1.00–1.02] | .048 |
| Mean BP mm Hg | 1.02 [1.01–1.03] | <.001 |
| Age, years | 1.06 [1.05–1.07] | <.001 |
| Testosterone, nmol/L | 1.00 [.99–1.01] | .379 |
| Insulin like growth factor (IGF), nmol/L | .98 [.97–.99] | <.001 |
| HDL cholesterol, mmol/L | .71 [.62–.80] | <.001 |
| Glucose, mmol/L | .97 [.96–.98] | <.001 |
| Total cholesterol, mmol/L | 1.03 [.92–1.16] | .573 |
| Triglycerides, mmol/L | 1.07 [1.04–1.10] | <.001 |
| Current tobacco (yes) | 1.64 [1.54–1.74] | <.001 |
| CV diseases (yes) | 1.09 [1.03–1.16] | .006 |
| Creatinine, micromol/L | .99 [.98–1.00] | .045 |
| LDL cholesterol, mmol/L | 1.01 [.88–1.16] | .926 |
| Uric acid lowering therapy | .89 [.80–.99] | .032 |
| Urea, mmol/L | 1.00 [.99–1.01] | .436 |
| Serum Uric Acid (SUA), mmol/L | <.001 | |
| °Q1 | Ref. | |
| °Q2 | 1.04 [.99–1.09] | .136 |
| °Q3 | 1.09 [1.04–1.14] | <.001 |
| °Q4 | 1.10 [1.05–1.16] | <.001 |
| Women | ||
|---|---|---|
| Parameters | OR 95%CI | P value |
| BMI (kg/m2) | 1.02 [1.01–1.03] | <.001 |
| Glomerular filtration rate (GFR), ml/min/1.73 m2 | 1.00 [.99–1.01] | .118 |
| C reactive protein (CRP), mg/L | 1.00 [.99–1.01] | .148 |
| HR bpm | 1.01 [1.00–1.02] | <.001 |
| Mean BP mm Hg | 1.02 [1.01–1.03] | <.001 |
| Age, years | 1.05 [1.04–1.06] | <.001 |
| Testosterone, nmol/L | 1.00 [.99–1.01] | .651 |
| Insulin like Growth Factor (IGF), nmol/L | 1.00 [.99–1.01] | .599 |
| HDL cholesterol, mmol/L | .85 [.80–.90] | <.001 |
| Glucose, mmol/L | .98 [.96–1.00] | .041 |
| Total cholesterol, mmol/L | 1.16 [1.02–1.33] | .026 |
| Triglycerides, mmol/L | 1.14 [1.10–1.18] | <.001 |
| Current tobacco (yes) | 1.78 [1.67–1.91] | <.001 |
| CV diseases (yes) | 1.07 [.97–1.19] | .189 |
| Hormone therapy (yes) | 1.08 [1.01–1.17] | .020 |
| Creatinine, micromol/L | 1.00 [.99–1.01] | .333 |
| LDL cholesterol, mmol/L | .84 [.72–.98] | .028 |
| Uric acid lowering therapy | .80 [.53–1.19] | .233 |
| Urea, mmol/L | 1.04 [1.02–1.05] | <.001 |
| Serum Uric Acid (SUA), mmol/L | <.001 | |
| °Q1 | Ref. | |
| °Q2 | 1.05 [.99–1.10] | .101 |
| °Q3 | 1.13 [1.07–1.19] | <.001 |
| °Q4 | 1.22 [1.15–1.30] | <.001 |
| Overall study population | ||
|---|---|---|
| Parameters | OR 95%CI | P value |
| BMI (kg/m2) | 1.02 [1.01–1.03] | <.001 |
| Glomerular filtration rate (GFR), ml/min/1.73 m2 | 1.00 [.99–1.01] | .075 |
| C reactive protein (CRP), mg/L | 1.00 [.99–1.01] | .951 |
| HR bpm | 1.01 [1.00–1.02] | <.001 |
| Mean BP mm Hg | 1.02 [1.01–1.03] | <.001 |
| Age, years | 1.05 [1.04–1.06] | <.001 |
| Testosterone, nmol/L | 1.00 [.99–1.01] | .198 |
| Insulin like Growth Factor (IGF), nmol/L | .99 [.98–1.00] | .007 |
| HDL cholesterol, mmol/L | .73 [.66–.80] | <.001 |
| Glucose, mmol/L | .98 [.97–.99] | <.001 |
| Total cholesterol, mmol/L | 1.08 [.99–1.18] | .082 |
| Triglycerides, mmol/L | 1.08 [1.06–1.11] | <.001 |
| Current tobacco (yes) | 1.70 [1.62–1.78] | <.001 |
| CV diseases (yes) | 1.08 [1.03–1.14] | .003 |
| Creatinine, micromol/L | .99 [.98–1.00] | .010 |
| LDL cholesterol, mmol/L | .93 [.84–1.03] | .176 |
| Uric acid lowering therapy | .90 [.81–.99] | .035 |
| Urea, mmol/L | 1.02 [1.01–1.03] | .003 |
| Serum Uric Acid (SUA), mmol/L | <.001 | |
| °Q1 | Ref. | |
| °Q2 | 1.04 [1.00–1.08] | .032 |
| °Q3 | 1.10 [1.06–1.14] | <.001 |
| °Q4 | 1.14 [1.10–1.19] | <.001 |
| Sex (male) | 1.68 [1.57–1.79] | <.001 |
In the multivariate analysis among women, after adjustment for confounding factors, SUA remained an independent factor of arterial stiffness (defined by ASI > 10 m/s), with an increase in the strength of the association between the quartiles, that is, Q4 versus Q1, OR = 1.22 [1.15–1.30], P < .001, Q3 versus Q1, OR = 1.13 [1.07–1.19], P < .001 and no difference between Q2 and Q1 (P = .101). In the multivariate analysis, BMI (P < .001), HR (P < .001), Mean BP (P < .001), age (P < .001), HDL cholesterol (P < .001), total cholesterol (P = .026), LDL cholesterol (P = .028), tobacco status (P < .001), triglycerides (P < .001), fasting glucose (P = .041), urea (P < .001), and hormone therapy (P = .020) remained significant (Table 2 ). When applying continuous SUA values in the multivariate analysis, SUA remained significant (P < .001), with a Youden index value equal to 267.3 mmol/L.
In the multivariate analysis in the overall population, after adjustment for confounding factors including sex, SUA remained an independent factor of arterial stiffness (defined by ASI > 10 m/s), with an increase in the strength of the association between the quartiles, that is, Q4 versus Q1, OR = 1.14 [1.10–1.19], P < .001, Q3 versus Q1, OR = 1.10 [1.06–1.14], P < .001 and Q2 versus Q1 OR = 1.04 [1.00–1.08], P = .032). In the multivariate analysis, sex (P < .001) BMI (P < .001), creatinine (P = .010), HR (P < .001), mean BP (P < .001), age (P < .001), HDL cholesterol (P < .001), fasting glucose (P < .001), tobacco status (P < .001), IGF (P = .007), triglycerides (P < .001), CV diseases (P = .003), creatinine (P = .010), urea (P = .003), and uric acid lowering therapy (P = .035) remained significant (Table 2 ). When applying continuous SUA values in the multivariate analysis, SUA remained significant (P < .001), with a Youden index value equal to 302.0 mmol/L.
3.1. Sensitivity analysis
By divided the overall population according the presence of CV disease or CV risk factors (ie, hypertension and diabetes), 61 453 (48.5%) participants showed no CV diseases or CV risk factors while 65 210 (51.5%) had at least one CV disease, hypertension or diabetes. Same results were observed in men, women and in overall population regardless the status of CV diseases as observed in primary analyses (Table 3 ).
TABLE 3.
Multivariate logistic analyses for arterial stiffness (ASI > 10 m/s) and quartiles of SUA levels for men, women and overall study population according to the presence or not of at least one CV disease, diabetes or hypertension
| MEN | |||||||
|---|---|---|---|---|---|---|---|
| With CVD (N = 39 295) | .047 | Without CVD (N = 24 797) | <.001 | ||||
| Q1 | Ref. | Q1 | Ref. | ||||
| Q2 | 1.02 | [.96–1.08] | 9.557 | Q2 | 1.07 | [.99–1.15] | .061 |
| Q3 | 1.08 | [1.01–1.14] | .019 | Q3 | 1.12 | [1.04–1.21] | .003 |
| Q4 | 1.07 | [1.01–1.13] | .041 | Q4 | 1.19 | [1.09–1.30] | <.001 |
| WOMEN | |||||||
|---|---|---|---|---|---|---|---|
| With CVD (N = 25 915) | <.001 | Without CVD (N = 36 656) | <.001 | ||||
| Q1 | Ref. | Q1 | Ref. | ||||
| Q2 | 1.00 | [.91–1.09] | .966 | Q2 | 1.07 | [.99–1.14] | .056 |
| Q3 | 1.08 | [1.01–1.18] | .048 | Q3 | 1.16 | [1.08–1.24] | <.001 |
| Q4 | 1.20 | [1.10–1.31] | <.001 | Q4 | 1.26 | [1.16–1.38] | <.001 |
| Overall population | |||||||
|---|---|---|---|---|---|---|---|
| With CVD (N = 65 210) | <.001 | Without CVD (N = 61 453) | <.001 | ||||
| Q1 | Ref. | Q1 | Ref. | ||||
| Q2 | 1.01 | [.96–1.01] | .708 | Q2 | 1.07 | [1.01–1.12] | .011 |
| Q3 | 1.07 | [1.02–1.13] | .004 | Q3 | 1.13 | [1.08–1.19] | <.001 |
| Q4 | 1.11 | [1.06–1.17] | <.001 | Q4 | 1.21 | [1.14–1.28] | <.001 |
CVD: cardiovascular disease (including at least heart attack, angina, stroke, diabetes or hypertension).
4. DISCUSSION
This cross‐sectional study investigated the association between SUA and ASI level in a large population of middle‐aged participants. A positive association between SUA quartiles and ASI was shown in multivariate analyses in both sex. These findings may suggest that higher SUA levels can possess an unfavorable action on arterial stiffness among general populations. In parallel, in our study we found the usual determinants of arterial stiffness, as age, sex, mean blood pressure and heart rate, 35 BMI, 35 , 36 , 37 tobacco status, 38 HDL cholesterol, fasting glucose, total cholesterol, triglycerides and IGF‐1, and CV diseases. 35 , 39 Youden indexes were performed to discriminate arterial stiffness, with a value of SUA equal to 302.0 mmol/L in the overall population, 338.2 mmol/L in men and 267.3 mmol/L in women.
4.1. Cross‐sectional investigations
The relationship between SUA and arterial stiffness has been evaluated in cross‐sectional and prospective large population studies. 4140 volunteers were included in the Framingham Heart Study and presented low risk factors. 33 In this study, SUA was associated with increased arterial stiffness, measured by PWV. This association remains significant after adjustment for confounding factors, as age, sex, hypertension, BMI, fasting plasma glucose, insulin, animal protein intake and renal function. But, the strength of this association was decreased after these adjustments, this can suggest that the relationship between SUA and arterial stiffness could be not clear among healthy participants. Moreover, a positive linear association was observed between SUA and baPWV levels in both sexs in the Korean Multi‐Rural Communities Cohort study. 40
In contrast, other studies have shown a sex difference for this relationship, as a positive correlation in women but not in men. This has been observed among 66 917 middle‐aged Koreans with low CV risk factors, and where men present a J‐shaped correlation. The conclusions of the authors were that SUA may present an unfavorable vascular effects among low‐risk population but the ethnic lifestyle could influence this relationship. 14
4.2. Sex differences
In our study we have shown an age‐interaction with SUA for arterial stiffness in both sex. A sex difference has been observed in different studies for SUA levels. 41 Women presented lower SUA levels than men. Aging according to sex may also influence this association, where healthy older women with hyperuricemia showed increased arterial stiffness risk. 42 The sex difference for this relationship could be due to the difference on prevalence of current smokers, hypertension, age, dyslipidemia between men and sex. 43 Furthermore, the association between SUA levels and CV events is stronger in women than in men. 44 Metabolic syndrome was closely related to SUA levels in women than in men. 45 These observation are consistent to the results of our study where women presented higher OR than men for the relationship between SUA levels and AS (Table 2 ). A meta‐analysis showed that the relationship between CV mortality and SUA levels was significant in women but not in men. 46 Nevertheless, few studies have clearly investigated the association between SUA levels and arterial stiffness. However, a sex‐specific association could be highlighted among women between SUA and arteriosclerosis. 47
An inverse relationship between SUA and estrogen has been observed in both sex. 48 , 49 Estrogen has a direct effects on sex‐associated UA transporters, such as ABCG2. 50 After menopause, the decrease in sex hormonal levels, as estrogen, induces increased SUA levels and this decrease can be mitigated by hormonal replacement therapy. 51 However, even if few women reported to have hormone medication, most women in the study were probably menopausal. Thus, the decrease in estrogen may have a greater effect in women than in men who per se low in estrogen. This could explain the higher relationship between SUA and arterial stiffness in women than in men. In our study, the relationship between SUA and AS remained significant after adjustment including hormone medication showing that estrogen could not be the only explained pathway in women.
4.3. Prospective investigations
During a follow‐up period of 6 years, repeated measures of SUA and cfPWV were performed and showed that a significant and independently association was observed over time in men but not in women. 52 In this study, the sex differences was characterized by the fact that men had higher values of SUA than women. A longer exposure to high levels of SUA could be associated with increased risk of vascular stiffness. 52 Among normotensive participants with a 1‐year follow‐up, SUA levels was associated with increased baPWV levels after adjustment for age, sex, BMI, lipid parameters and systolic BP. 53
4.4. Pathophysiological mechanism of SUA on arterial stiffness
Two main mechanisms can explain the relationship between arterial stiffness and hyperuricemia. The independent urate crystal is characterized by the translocation of soluble SUA into the vascular wall through Glut‐9 (a glucose transporter) or via URATv1 (a voltage‐driven urate efflux transporter‐1) to induce an intra‐cellular inflammation and then, oxidative stress. 54
The urate crystal‐dependent mechanism, activated by vascular macrophages, lead to the activation of NLRP3 (nod‐like receptor family proteins 3) inflammasome. This inflammasome cleaves pro‐IL‐1beta into activated IL‐1beta to enhance inflammation and the formation of collagen. 55 Nevertheless this process should be only considered among patients with high UA levels, due to the crystallized UA starting level within the body when UA level exceeds its solubility limit (6.8 mg/dl). 56
Moreover, hyperuricemia downregulates the production of NO (nitric oxide) in endothelial cells, 57 this, in association with the activation of the renin‐angiotensin‐aldosterone (RAA) system by high UA levels. 58 The downregulation of the bioavailability and production in NO leads to the dysfunction of endothelial cells, to increase vascular tone and then, to arterial stiffness 59 In parallel, the RAA‐activated by hyperuricemia is responsible for activation of the different processes of arterial stiffness in cytoskeleton of endothelial cells 60 and fibrosis of extracellular matrix. 61 Oxidative stress induced by UA stimulates the production of endothelin‐1 62 which is a vasoconstrictor and enhancer of arterial stiffness. 63
The proliferation of vascular smooth muscle cells (VSMC) was induced by high UA levels by stimulating the inflammation, via Protein‐1, 64 COX‐2 65 and NF‐kB pathway responsible for proatherogenic effects in the vascular wall. 66 Moreover, CRP was stimulated by UA, as observed with the proinflammatory marker, TNF‐α. 67 CRP stimulates the production of cellular adhesion molecules, enhances cellular apoptosis and leads to endothelial dysfunction and then, arterial stiffness. 68
SUA is the end product of purine metabolism, mist of which is excreted in the urine by kidneys. 69 Studies have observed that increased levels of SUA were mainly associated with CKD risk onset. 70 Moreover, a recent study showed that hyperuricemia could be considered as an independent risk factor for the development of new‐onset CKD. 71 UA produces reactive oxygen species and angiotensin II which contribute to vascular endothelial cell aging and initiation of atherosclerosis. 72 The increase in SUA can promote inflammation, oxidative stress, higher level of renin‐angiotensin system activity and reduction in GFR by increased renal vascular resistance due to endothelial cell damages. 72
4.5. Limitations
The main strength of this study is the very large sample size of the cohort. The cross‐sectional observational design limits the relationship of causality. Reverse causation can't be ruled out. A potential limitation could stem from the utilization of Pulse Trace device to measure arterial stiffness on account of greater variability in ASI values relative to other available devices. 73 The UK Biobank study showed a low response rate of 5.5% and possible volunteers bias may be involved. Nevertheless, given the large sample size and high internal validity, these are unlikely to affect the reported associations. 74 , 75 In addition, the study cohort consisted of middle‐aged European participants, so our findings may not be generalized to other age groups and ethnic populations. Uric acid lowering therapy could be underestimated in the study. Only five medications were reported, as allopurinol, benzbromarone, febuxostat, probenecid or sulfinpyrazone, according to other uric acid studies in UK Biobank. 29 , 76 This underestimation could be a bias in the association between SUA and arterial stiffness. Menopausal women proportion and estrogen levels were not reported in the study. The possible high proportion of menopausal women in the study and the low estrogen level in women could be a response of the higher relationship between women and SUA than men.
5. CONCLUSIONS
In conclusions, SUA levels appeared to be independent determinants of arterial stiffness, defined by ASI > 10 m/s, in both sex of a general middle‐aged population. Few studies have shown the significant relationship between ASI and SUA in a general population, and future prospective cohort studies are needed to better explore this link.
CONFLICT OF INTEREST
The author declares no conflict of interest.
AUTHOR CONTRIBUTIONS
Conceptualization, Alexandre Vallée; methodology, Alexandre Vallée; formal analysis, Alexandre Vallée; writing—original draft preparation, Alexandre Vallée; The author has read and agreed to the published version of the manuscript.
ACKNOWLEDGMENT
This research received no external funding.
Vallée A. Association between serum uric acid and arterial stiffness in a large‐aged 40–70 years old population. J Clin Hypertens. 2022;24:885–897. 10.1111/jch.14527
REFERENCES
- 1. Berenson GS, Srinivasan SR, Bao W, Newman WP, Tracy RE, Wattigney WA. Association between multiple cardiovascular risk factors and atherosclerosis in children and young adults. The Bogalusa Heart Study. N Engl J Med. 1998; 338: 1650‐1656. [DOI] [PubMed] [Google Scholar]
- 2. Brull DJ, Leeson CPM, Montgomery HE, et al. The effect of the Interleukin‐6‐174G >C promoter gene polymorphism on endothelial function in healthy volunteers. Eur J Clin Invest. 2002; 32: 153‐157. [DOI] [PubMed] [Google Scholar]
- 3. Leoncini G, Ratto E, Viazzi F, et al. Increased ambulatory arterial stiffness index is associated with target organ damage in primary hypertension. Hypertension. 2006; 48: 397‐403. [DOI] [PubMed] [Google Scholar]
- 4. Ben‐Shlomo Y, Spears M, Boustred C, et al. Aortic pulse wave velocity improves cardiovascular event prediction: an individual participant meta‐analysis of prospective observational data from 17,635 subjects. J Am Coll Cardiol. 2014; 63: 636‐646. [DOI] [PMC free article] [PubMed] [Google Scholar]
- 5. Said MA, Eppinga RN, Lipsic E, Verweij N, van der Harst P. Relationship of arterial stiffness index and pulse pressure with cardiovascular disease and mortality. J Am Heart Assoc. 2018; 7: e007621. [DOI] [PMC free article] [PubMed] [Google Scholar]
- 6. Duprez DA, Cohn JN. Arterial stiffness as a risk factor for coronary atherosclerosis. Curr Atheroscler Rep. 2007; 9: 139‐144. [DOI] [PubMed] [Google Scholar]
- 7. Vallée A, Cinaud A, Protogerou A, et al. Arterial stiffness and coronary ischemia: new aspects and paradigms. Curr Hypertens Rep. 2020; 22: 5. [DOI] [PubMed] [Google Scholar]
- 8. Dregan A. Arterial stiffness association with chronic inflammatory disorders in the UK Biobank study. Heart Br Card Soc. 2018; 104: 1257‐1262. [DOI] [PMC free article] [PubMed] [Google Scholar]
- 9. Fernandes VRS, Polak JF, Cheng S, et al. Arterial stiffness is associated with regional ventricular systolic and diastolic dysfunction: the multi‐ethnic study of atherosclerosis. Arterioscler Thromb Vasc Biol. 2008; 28: 194‐201. [DOI] [PubMed] [Google Scholar]
- 10. Laurent S, Cockcroft J, Van Bortel L, et al. Expert consensus document on arterial stiffness: methodological issues and clinical applications. Eur Heart J. 2006; 27: 2588‐2605. [DOI] [PubMed] [Google Scholar]
- 11. Vlachopoulos C, Aznaouridis K, Stefanadis C. Prediction of cardiovascular events and all‐cause mortality with arterial stiffness: a systematic review and meta‐analysis. J Am Coll Cardiol. 2010; 55: 1318‐1327. [DOI] [PubMed] [Google Scholar]
- 12. Alty SR, Angarita‐Jaimes N, Millasseau SC, Chowienczyk PJ. Predicting arterial stiffness from the digital volume pulse waveform. IEEE Trans Biomed Eng. 2007; 54: 2268‐2275. [DOI] [PubMed] [Google Scholar]
- 13. Chen J‐H, Chuang S‐Y, Chen H‐J, Yeh W‐T, Pan W‐H. Serum uric acid level as an independent risk factor for all‐cause, cardiovascular, and ischemic stroke mortality: a Chinese cohort study. Arthritis Rheum. 2009; 61: 225‐232. [DOI] [PubMed] [Google Scholar]
- 14. Hwang J, Hwang JH, Chung SM, Kwon M‐J, Ahn JK. Association between serum uric acid and arterial stiffness in a low‐risk, middle‐aged, large Korean population: a cross‐sectional study. Medicine (Baltimore). 2018; 97: e12086. [DOI] [PMC free article] [PubMed] [Google Scholar]
- 15. Vlachopoulos C, Xaplanteris P, Vyssoulis G, et al. Association of serum uric acid level with aortic stiffness and arterial wave reflections in newly diagnosed, never‐treated hypertension. Am J Hypertens. 2011; 24: 33‐39. [DOI] [PubMed] [Google Scholar]
- 16. Luo F, Zhuo C. Association between uric acid and brachial‐ankle pulse wave velocity: secondary analysis of data from a cross‐sectional study. Sci Rep. 2020; 10: 2282. [DOI] [PMC free article] [PubMed] [Google Scholar]
- 17. Rebora P, Andreano A, Triglione N, et al. Association between uric acid and pulse wave velocity in hypertensive patients and in the general population: a systematic review and meta‐analysis. Blood Press. 2020; 29: 220‐231. [DOI] [PubMed] [Google Scholar]
- 18. Sudlow C, Gallacher J, Allen N, et al. UK biobank: an open access resource for identifying the causes of a wide range of complex diseases of middle and old age. PLoS Med. 2015; 12: e1001779. [DOI] [PMC free article] [PubMed] [Google Scholar]
- 19. Bycroft C, Freeman C, Petkova D, et al. The UK Biobank resource with deep phenotyping and genomic data. Nature. 2018; 562: 203‐209. [DOI] [PMC free article] [PubMed] [Google Scholar]
- 20. UK Biobank . Arterial Pulse‐Wave Velocity. UK Biobank. https://biobank.ndph.ox.ac.uk/ukb/ukb/docs/Pulsewave.pdf. Accessed January 10, 2022. [Google Scholar]
- 21. UK Biobank . UK Biobank Blood Pressure. UK Biobank. Available at: https://biobank.ctsu.ox.ac.uk/crystal/crystal/docs/Bloodpressure.pdf. Accessed January 10, 2022. [Google Scholar]
- 22. Coleman A, Freeman P, Steel S, Shennan A. Validation of the Omron 705IT (HEM‐759‐E) oscillometric blood pressure monitoring device according to the British Hypertension Society protocol. Blood Press Monit. 2006; 11: 27‐32. [DOI] [PubMed] [Google Scholar]
- 23. Stang A, Moebus S, Möhlenkamp S, et al. Algorithms for converting random‐zero to automated oscillometric blood pressure values, and vice versa. Am J Epidemiol. 2006; 164: 85‐94. [DOI] [PubMed] [Google Scholar]
- 24. Woodman RJ, Kingwell BA, Beilin LJ, Hamilton SE, Dart AM, Watts GF. Assessment of central and peripheral arterial stiffness: studies indicating the need to use a combination of techniques. Am J Hypertens. 2005; 18: 249‐260. [DOI] [PubMed] [Google Scholar]
- 25. Sollinger D, Mohaupt MG, Wilhelm A, Uehlinger D, Frey FJ, Eisenberger U. Arterial stiffness assessed by digital volume pulse correlates with comorbidity in patients with ESRD. Am J Kidney Dis. 2006; 48: 456‐463. [DOI] [PubMed] [Google Scholar]
- 26. Millasseau SC, Kelly RP, Ritter JM, Chowienczyk PJ. Determination of age‐related increases in large artery stiffness by digital pulse contour analysis. Clin Sci (Lond) 1979. 2002; 103: 371‐377. [DOI] [PubMed] [Google Scholar]
- 27. Williams B, Mancia G, Spiering W, et al. 2018 practice guidelines for the management of arterial hypertension of the European Society of Hypertension and the European Society of Cardiology: eSH/ESC Task Force for the Management of Arterial Hypertension. J Hypertens. 2018; 36: 2284‐2309. [DOI] [PubMed] [Google Scholar]
- 28. Cherfan M, Vallée A, Kab S, et al. Unhealthy behavior and risk of hypertension: the CONSTANCES population‐based cohort. J Hypertens. 2019; 37: 2180‐2189. [DOI] [PubMed] [Google Scholar]
- 29. Topless RK, Gaffo A, Stamp LK, Robinson PC, Dalbeth N, Merriman TR. Gout and the risk of COVID‐19 diagnosis and death in the UK Biobank: a population‐based study. Lancet Rheumatol. 2022; 4: e274‐e281. [DOI] [PMC free article] [PubMed] [Google Scholar]
- 30. UK Biobank . Biomarker Assay Quality Procedures: Approaches used to Minimise Systematic and Random Errors (and the Wider Epidemiological Implications). UK Biobank; 2019. https://biobank.ctsu.ox.ac.uk/crystal/crystal/docs/biomarker_issues.pdf. Accessed January 10, 2022. [Google Scholar]
- 31. Lai KY, Kumari S, Gallacher J, Webster C, Sarkar C. Associations of residential walkability and greenness with arterial stiffness in the UK Biobank. Environ Int. 2022; 158: 106960. [DOI] [PubMed] [Google Scholar]
- 32. Berger A, Kiefer M. Comparison of different response time outlier exclusion methods: a simulation study. Front Psychol. 2021; 12: 675558. [DOI] [PMC free article] [PubMed] [Google Scholar]
- 33. Mehta T, Nuccio E, McFann K, Madero M, Sarnak MJ, Jalal D. Association of uric acid with vascular stiffness in the Framingham Heart Study. Am J Hypertens. 2015; 28: 877‐883. [DOI] [PMC free article] [PubMed] [Google Scholar]
- 34. Lavrac N. Selected techniques for data mining in medicine. Artif Intell Med. 1999; 16: 3‐23. [DOI] [PubMed] [Google Scholar]
- 35. Vallée A, Safar ME, Blacher J. Application of a decision tree to establish factors associated with a nomogram of aortic stiffness. J Clin Hypertens (Greenwich). 2019; 21: 1484‐1492. [DOI] [PMC free article] [PubMed] [Google Scholar]
- 36. Jain S, Khera R, Corrales‐Medina VF, Townsend RR, Chirinos JA. Inflammation and arterial stiffness in humans. Atherosclerosis. 2014; 237: 381‐390. [DOI] [PubMed] [Google Scholar]
- 37. Tang B, Luo F, Zhao J, et al. Relationship between body mass index and arterial stiffness in a health assessment Chinese population. Medicine (Baltimore). 2020; 99: e18793. [DOI] [PMC free article] [PubMed] [Google Scholar]
- 38. Mack WJ, Islam T, Lee Z, Selzer RH, Hodis HN. Environmental tobacco smoke and carotid arterial stiffness. Prev Med. 2003; 37: 148‐154. [DOI] [PubMed] [Google Scholar]
- 39. Shirwany NA, Zou M. Arterial stiffness: a brief review. Acta Pharmacol Sin. 2010; 31: 1267‐1276. [DOI] [PMC free article] [PubMed] [Google Scholar]
- 40. Bae JS, Shin DH, Park PS, et al. The impact of serum uric acid level on arterial stiffness and carotid atherosclerosis: the Korean Multi‐Rural Communities Cohort study. Atherosclerosis. 2013; 231: 145‐151. [DOI] [PubMed] [Google Scholar]
- 41. Kawabe M, Sato A, Hoshi T, et al. Gender differences in the association between serum uric acid and prognosis in patients with acute coronary syndrome. J Cardiol. 2016; 67: 170‐176. [DOI] [PubMed] [Google Scholar]
- 42. Choi HY, Kim S‐H, Choi AR, et al. Hyperuricemia and risk of increased arterial stiffness in healthy women based on health screening in Korean population. PloS One. 2017; 12: e0180406. [DOI] [PMC free article] [PubMed] [Google Scholar]
- 43. Bian S, Guo H, Ye P, Luo L, Wu H, Xiao W. Serum uric Acid level and diverse impacts on regional arterial stiffness and wave reflection. Iran J Public Health. 2012; 41: 33‐41. [PMC free article] [PubMed] [Google Scholar]
- 44. Fang J, Alderman MH. Serum uric acid and cardiovascular mortality the NHANES I epidemiologic follow‐up study, 1971–1992. National Health and Nutrition Examination Survey. JAMA. 2000; 283: 2404‐2410. [DOI] [PubMed] [Google Scholar]
- 45. Yoo TW, Sung KC, Shin HS, et al. Relationship between serum uric acid concentration and insulin resistance and metabolic syndrome. Circ J. 2005; 69: 928‐933. [DOI] [PubMed] [Google Scholar]
- 46. Kim SY, Guevara JP, Kim KM, Choi HK, Heitjan DF, Albert DA. Hyperuricemia and coronary heart disease: a systematic review and meta‐analysis. Arthritis Care Res. 2010; 62: 170‐180. [DOI] [PMC free article] [PubMed] [Google Scholar]
- 47. Liu Q, Liu C, Gao Y, et al. Gender‐specific association between serum uric acid and incident fundus arteriosclerosis in Chinese population: a retrospective cross‐sectional study. Sci Rep. 2020; 10: 8595. [DOI] [PMC free article] [PubMed] [Google Scholar]
- 48. Adamopoulos D, Vlassopoulos C, Seitanides B, Contoyiannis P, Vassilopoulos P. The relationship of sex steroids to uric acid levels in plasma and urine. Acta Endocrinol (Copenh). 1997; 85: 198‐208. [DOI] [PubMed] [Google Scholar]
- 49. Halperin Kuhns VL, Woodward OM. Sex differences in urate handling. Int J Mol Sci. 2020; 21: E4269. [DOI] [PMC free article] [PubMed] [Google Scholar]
- 50. Imai Y, Ishikawa E, Asada S, Sugimoto Y. Estrogen‐mediated post transcriptional down‐regulation of breast cancer resistance protein/ABCG2. Cancer Res. 2005; 65: 596‐604. [PubMed] [Google Scholar]
- 51. Ioannou GN, Boyko EJ. Effects of menopause and hormone replacement therapy on the associations of hyperuricemia with mortality. Atherosclerosis. 2013; 226: 220‐227. [DOI] [PMC free article] [PubMed] [Google Scholar]
- 52. Canepa M, Viazzi F, Strait JB, et al. Longitudinal association between serum uric acid and arterial stiffness: results from the Baltimore longitudinal study of aging. Hypertension. 2017; 69: 228‐235. [DOI] [PMC free article] [PubMed] [Google Scholar]
- 53. Nagano S, Takahashi M, Miyai N, et al. Association of serum uric acid with subsequent arterial stiffness and renal function in normotensive subjects. Hypertens Res. 2017; 40: 620‐624. [DOI] [PubMed] [Google Scholar]
- 54. Mishima M, Hamada T, Maharani N, et al. Effects of uric acid on the NO production of HUVECs and its restoration by urate lowering agents. Drug Res. 2016; 66: 270‐274. [DOI] [PubMed] [Google Scholar]
- 55. Gicquel T, Robert S, Loyer P, et al. IL‐1β production is dependent on the activation of purinergic receptors and NLRP3 pathway in human macrophages. FASEB J. 2015; 29: 4162‐4173. [DOI] [PubMed] [Google Scholar]
- 56. Kuwabara M, Kanbay M, Hisatome I. Uric acid and hypertension because of arterial stiffness. Hypertension. 2018; 72: 582‐584. [DOI] [PubMed] [Google Scholar]
- 57. Choi Y‐J, Yoon Y, Lee K‐Y, et al. Uric acid induces endothelial dysfunction by vascular insulin resistance associated with the impairment of nitric oxide synthesis. FASEB J. 2014; 28: 3197‐3204. [DOI] [PubMed] [Google Scholar]
- 58. Khosla UM, Zharikov S, Finch JL, et al. Hyperuricemia induces endothelial dysfunction. Kidney Int. 2005; 67: 1739‐1742. [DOI] [PubMed] [Google Scholar]
- 59. Corry DB, Eslami P, Yamamoto K, Nyby MD, Makino H, Tuck ML. Uric acid stimulates vascular smooth muscle cell proliferation and oxidative stress via the vascular renin‐angiotensin system. J Hypertens. 2008; 26: 269‐275. [DOI] [PubMed] [Google Scholar]
- 60. Drüppel V, Kusche‐Vihrog K, Grossmann C, et al. Long‐term application of the aldosterone antagonist spironolactone prevents stiff endothelial cell syndrome. FASEB J. 2013; 27: 3652‐3659. [DOI] [PubMed] [Google Scholar]
- 61. Izzo JL. Systolic hypertension, arterial stiffness, and vascular damage: role of the renin‐angiotensin system. Blood Press Monit. 2000; 5(Suppl 2): S7‐S11. [DOI] [PubMed] [Google Scholar]
- 62. Arai H, Hori S, Aramori I, Ohkubo H, Nakanishi S. Cloning and expression of a cDNA encoding an endothelin receptor. Nature. 1990; 348: 730‐732. [DOI] [PubMed] [Google Scholar]
- 63. du Plooy CS, Mels CMC, Huisman HW, Kruger R. The association of endothelin‐1 with markers of arterial stiffness in Black South African women: the SABPA study. J Amino Acids. 2015; 2015: 481517. [DOI] [PMC free article] [PubMed] [Google Scholar]
- 64. Kanellis J, Watanabe S, Li JH, et al. Uric acid stimulates monocyte chemoattractant protein‐1 production in vascular smooth muscle cells via mitogen‐activated protein kinase and cyclooxygenase‐2. Hypertension. 2003; 41: 1287‐1293. [DOI] [PubMed] [Google Scholar]
- 65. Kang D‐H, Nakagawa T, Feng L, et al. A role for uric acid in the progression of renal disease. J Am Soc Nephrol. 2002; 13: 2888‐2897. [DOI] [PubMed] [Google Scholar]
- 66. Liu T, Zhang L, Joo D, Sun S‐C. NF‐κB signaling in inflammation. Signal Transduct Target Ther. 2017; 2: 17023. [DOI] [PMC free article] [PubMed] [Google Scholar]
- 67. Netea MG, Kullberg BJ, Blok WL, Netea RT, van der Meer JW. The role of hyperuricemia in the increased cytokine production after lipopolysaccharide challenge in neutropenic mice. Blood. 1997; 89: 577‐582. [PubMed] [Google Scholar]
- 68. Park S, Lakatta EG. Role of inflammation in the pathogenesis of arterial stiffness. Yonsei Med J. 2012; 53: 258‐261. [DOI] [PMC free article] [PubMed] [Google Scholar]
- 69. Maiuolo J, Oppedisano F, Gratteri S, Muscoli C, Mollace V. Regulation of uric acid metabolism and excretion. Int J Cardiol. 2016; 213: 8‐14. [DOI] [PubMed] [Google Scholar]
- 70. Mok Y, Lee SJ, Kim MS, Cui W, Moon YM, Jee SH. Serum uric acid and chronic kidney disease: the severance cohort study. Nephrol Dial Transplant. 2012; 27: 1831‐1835. [DOI] [PubMed] [Google Scholar]
- 71. Tada K, Maeda T, Takahashi K, et al. Association between serum uric acid and new onset and progression of chronic kidney disease in a Japanese general population: iki epidemiological study of atherosclerosis and chronic kidney disease. Clin Exp Nephrol. 2021; 25: 751‐759. [DOI] [PubMed] [Google Scholar]
- 72. Jalal DI, Chonchol M, Chen W, Targher G. Uric acid as a target of therapy in CKD. Am J Kidney Dis. 2013; 61: 134‐146. [DOI] [PMC free article] [PubMed] [Google Scholar]
- 73. DeLoach SS, Townsend RR. Vascular stiffness: its measurement and significance for epidemiologic and outcome studies. Clin J Am Soc Nephrol. 2008; 3: 184‐192. [DOI] [PubMed] [Google Scholar]
- 74. Richiardi L, Pizzi C, Pearce N. Commentary: representativeness is usually not necessary and often should be avoided. Int J Epidemiol. 2013; 42: 1018‐1022. [DOI] [PubMed] [Google Scholar]
- 75. Rothman KJ, Gallacher JEJ, Hatch EE. Why representativeness should be avoided. Int J Epidemiol. 2013; 42: 1012‐1014. [DOI] [PMC free article] [PubMed] [Google Scholar]
- 76. Cadzow M, Merriman TR, Dalbeth N. Performance of gout definitions for genetic epidemiological studies: analysis of UK Biobank. Arthritis Res Ther. 2017; 19: 181. [DOI] [PMC free article] [PubMed] [Google Scholar]