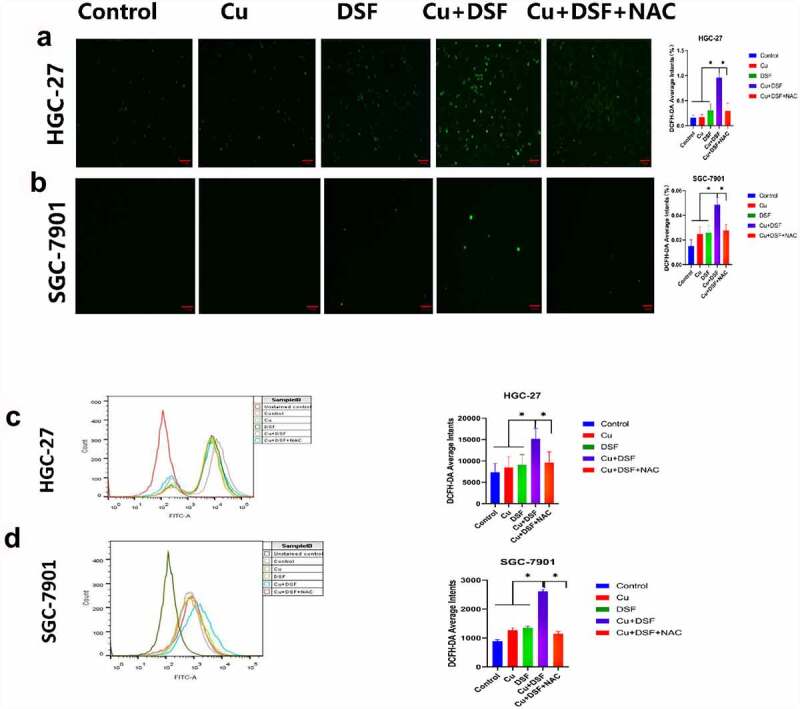
Figure 3.

DSF/Cu increases intracellular ROS levels. HGC-27 and SGC-7901 cells were exposed to Cu (0.2 μM) DSF (0.24 μM or 0.3 μM), or DSF + Cu (0.24 μM, 0.3 μM + 0.2 μM) for 2 h. (a, b) ROS production was measured using fluorescence microscopy. Scale bar: 100 µm. (c, d) ROS production was measured using flow cytometry. Scale bar: 100 µm. Data are expressed as mean ± standard deviation of three independent experiments. *p < 0.05 vs. the DSF/Cu group.
