
Figure 6.
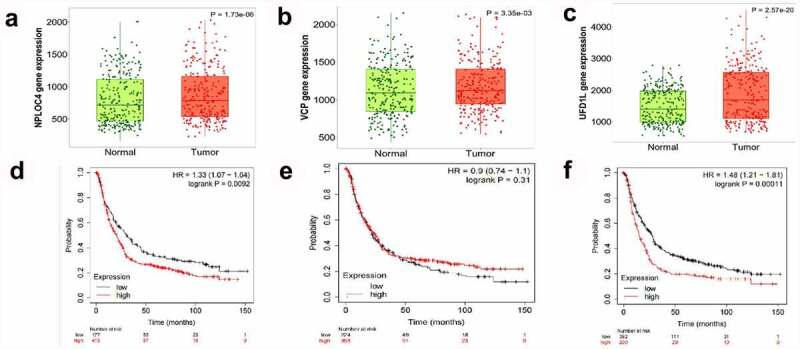
The prognostic value of VCP and NPL4 mRNA expression using the KM plotter database. (a, c). The expression of NPL4 and UFD1 in paired tumor and adjacent normal tissues in all GC patients. (b, d). Survival curves of NPL4 (Affymetrix IDs: 217796_s_at), UFD1 (Affymetrix IDs: 209103_s_at), and VCP (Affymetrix IDs: 208648_s_at) for all GC patients (n = 592). Red: high expression level; black: low expression level. GC, gastric cancer; HR: hazard ratio; KM, Kaplan-Meier.