Abstract
Aerobic glycolysis in cancer cells, also known as the ‘Warburg effect’, is driven by hyperactivity of lactate dehydrogenase A (LDHA). LDHA is thought to be a substrate-regulated enzyme, but it is unclear whether a dedicated intracellular protein also regulates its activity. Here, we identify the human tumor suppressor folliculin (FLCN) as a binding partner and uncompetitive inhibitor of LDHA. A flexible loop within the amino terminus of FLCN controls movement of the LDHA active-site loop, tightly regulating its enzyme activity and, consequently, metabolic homeostasis in normal cells. Cancer cells that experience the Warburg effect show FLCN dissociation from LDHA. Treatment of these cells with a decapeptide derived from the FLCN loop region causes cell death. Our data suggest that the glycolytic shift of cancer cells is the result of FLCN inactivation or dissociation from LDHA. Together, FLCN-mediated inhibition of LDHA provides a new paradigm for the regulation of glycolysis.
Deregulation of cellular metabolism is a prevalent and well-established hallmark of cancer1. Oxidative phosphorylation provides the majority of energy in many somatic cells, whereas malignant transformation generally leads to an increased reliance on glycolysis2. This increased glycolytic flux occurs despite the presence of oxygen, a phenomenon known as the ‘Warburg effect’3. Cancer cells benefit from this metabolic shift by using the increased supply of NAD+ (NAD, nicotinamide adenine dinucleotide) to support the growing demand for biosynthetic molecules provided by glycolysis. Generation of NAD+ in glycolysis is coupled to the fermentation of pyruvate to lactate by lactate dehydrogenase A (LDHA). Previous work has demonstrated the critical importance of LDHA activity to cancer cell proliferation and, indeed, lactate generation has become a surrogate for tumorigenicity4,5. Despite this understanding, the factors regulating LDHA activity remain largely unexplored.
Loss of the tumor suppressor folliculin (FLCN) leads to Birt–Hogg–Dubé (BHD) syndrome, a condition characterized by cutaneous fibrofolliculomas, spontaneous pneumothorax and pulmonary cyst development, as well as renal cell carcinoma6,7. Canonically, FLCN participates in the regulation of mTOR through its role as a GTPase-activating protein for the GTPase RagC8,9. However, the precise mechanism of FLCN tumor suppressive function is unknown. Notably, it was previously shown that loss of FLCN leads to increased LDHA activity10,11, suggesting a potential role for FLCN in the endogenous regulation of LDHA.
Results
Novel function of the tumor suppressor FLCN.
FLCN is a known tumor suppressor, but its exact function remains elusive12,13. Our proteomic approach using FLCN-6xHis isolated from HEK293 cells identified 114 interacting proteins, including LDHA (Fig. 1a and Supplementary Table 1). Gene Ontology (GO) term enrichment analysis revealed that these FLCN-binding partners primarily belong to cellular metabolic and RNA-processing pathways (Extended Data Fig. 1a). We confirmed the interaction with LDHA by immunoprecipitation (IP) of LDHA-FLAG and co-IP of endogenous FLCN (Extended Data Fig. 1b). Immunofluorescence microscopy shows co-localization of FLCN and LDHA in HEK293 cells, further demonstrating the plausibility of this interaction (Fig. 1b). FLCN expression is inversely correlated with the activity of LDHA, as evidenced by changes in the activation-coupled phospho-Tyr10-LDHA14,15 in response to modulation of FLCN levels (Extended Data Fig. 1c,d). These data suggest that FLCN interaction has a functional impact on LDHA activity.
Fig. 1 |. The tumor suppressor FLCN specifically binds and inhibits LDHA.
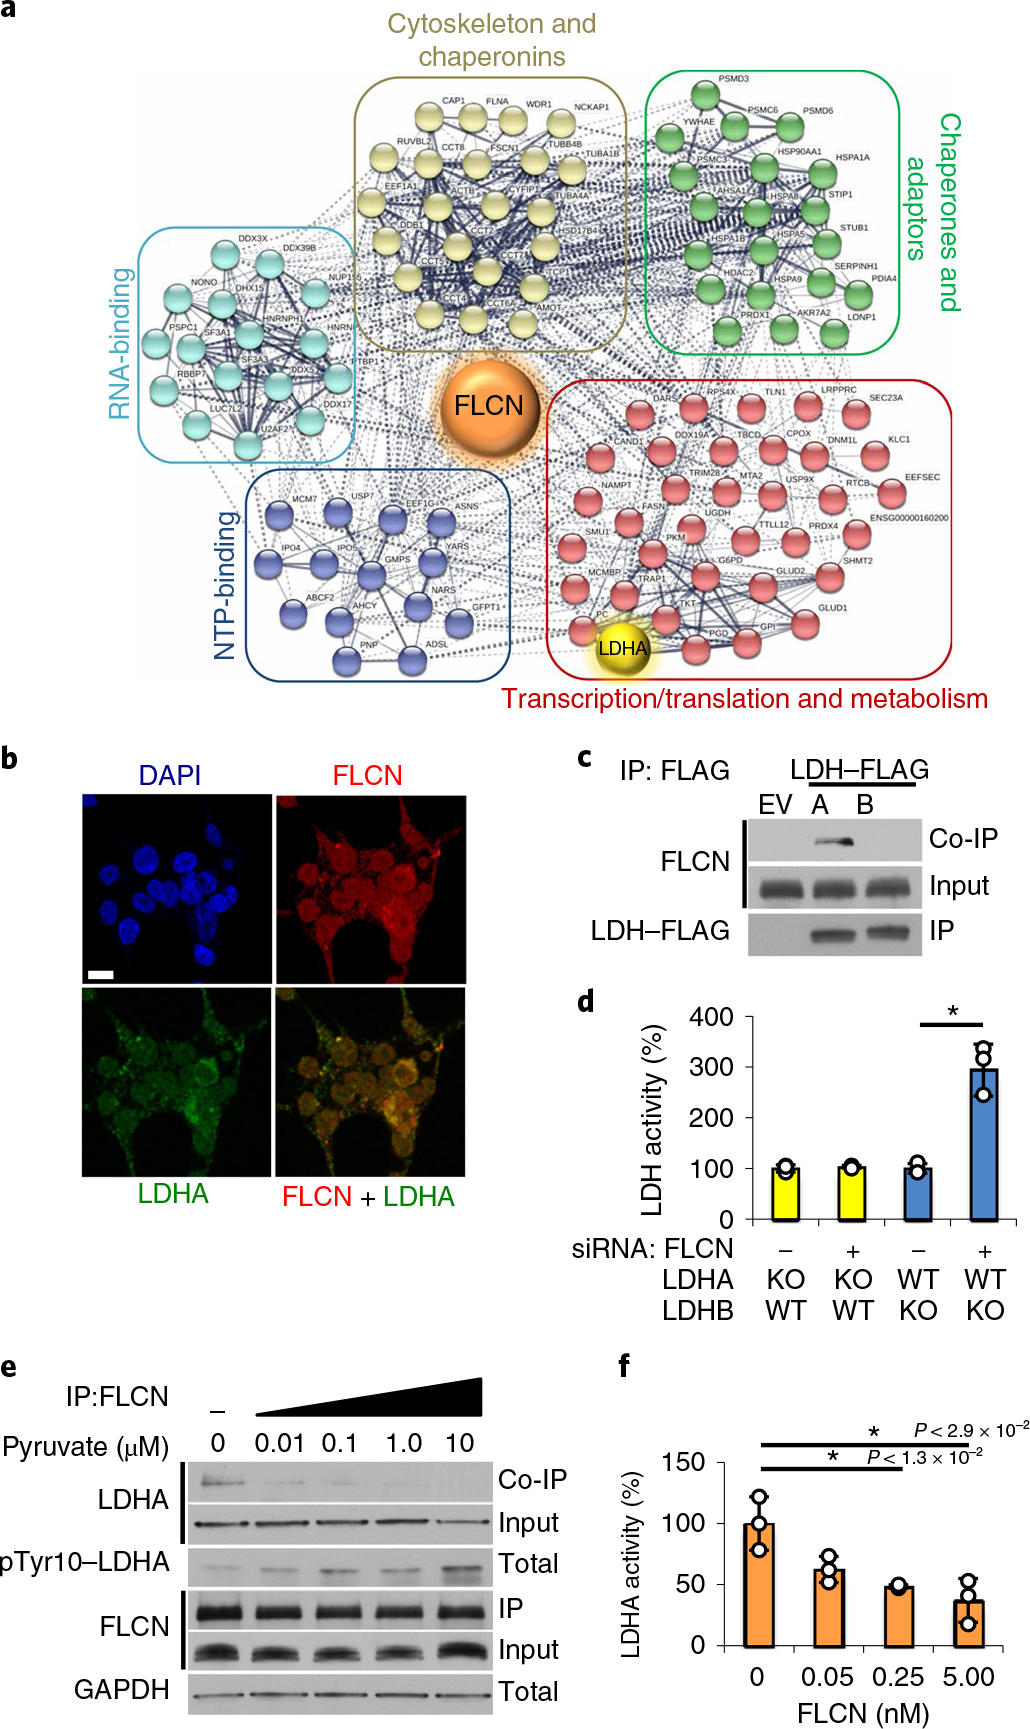
a, FLCN-FLAG IP from HEK293 cells was subjected to matrix-assisted laser desorption/ionization–time-of-flight (MALDITOF) analysis. Colored circles are interacting proteins: green, chaperones and adaptors; red, transcription, translation and metabolism; blue, nucleotide-binding; cyan, RNA-binding; beige, chaperonins and cytoskeleton. The interactome was generated using STRING (string-db.org). b, Immunofluorescence imaging of HEK293 cells stained with anti-FLCN (red) and anti-LDHA (green) antibodies and DAPI (blue, nuclei). Scale bar, 10 μm. c, IP of LDHA-FLAG or LDHB-FLAG expressed in HEK293 cells immunoblotted with anti-FLCN to assess the interaction (co-IP). The blots are a representative example of five independent experiments. d, LDH activity measured in vitro using whole-cell lysates from LDHA or LDHB knockout HAP1 cells following treatment with siRNA targeting FLCN. Data are presented as mean ± s.d. (n = 3 independent samples) (*P < 9.0 × 10⁻³, unpaired Student’s t-test). e, Immunoblots of anti-FLCN IPs and whole-cell extracts following exogenous addition of pyruvate to HEK293s (treatment duration of 6 h). The blots are a representative example of three independent experiments. f, Activity of 10nM recombinant LDHA measured in the presence of increasing amounts of recombinant FLCN. Data are presented as mean ± s.d. (n = 3 independent samples). P values based on unpaired Student’s t-test: *P < 0.05. Source data for c–f are available online.
LDHA and LDHB are highly conserved isoenzymes16, and both are present endogenously in HEK293 cells. Notably, IP of LDHA- or LDHB-FLAG from whole-cell lysate showed FLCN specifically bound to LDHA, but not LDHB (Fig. 1c). We subsequently performed an IP of endogenous FLCN from haploid HAP1 cells modified by CRISPR to express either LDHA or LDHB as the sole LDH (Extended Data Fig. 2a). Co-immunoprecipitation (co-IP) of LDHA could be observed in both wild-type and LDHA-expressing cells, but no interaction with LDHB was detected (Extended Data Fig. 2a). Additionally, suppressing FLCN expression using siRNA (Fig. 1d and Extended Data Fig. 2b) enhanced the activity of LDHA, but not LDHB, suggesting FLCN specifically binds and regulates LDHA activity (Fig. 1d).
LDHA and LDHB are known to form mixed tetrameric complexes described as a ‘dimer of dimers’14,15,17,18. Consecutive IP of co-expressed LDHA-HA/LDHA-FLAG or LDHA-HA/LDHB-FLAG demonstrated FLCN interaction with LDHA/LDHA homodimers but not LDHA/LDHB heterodimers (Extended Data Fig. 2c). LDHA also forms higher-order oligomers in cells observable by native polyacrylamide gel electrophoresis (PAGE)19, which probably correspond to the tetrameric and dimeric states of LDHA reported previously20. Our data showed that overexpression of FLCN corresponds to a decrease in large oligomeric complexes of LDHA (Extended Data Fig. 2d,e) and induces formation of a dimeric LDHA species (70 kDa; Extended Data Fig. 2e). We then immunoprecipitated FLCN-FLAG and observed interaction with this dimer of LDHA (70 kDa; Extended Data Fig. 2e).
To interrogate the mechanism of FLCN selectivity for LDHA, we developed chimeric constructs based on the concentration of natural sequence and structural variation in the first 22 (N) and last 38 (C) amino acids of LDHA and LDHB (Extended Data Fig. 3a,b)21. Exchanging the LDHB N domain or C domain individually into LDHA preserved binding of FLCN (Extended Data Fig. 3c). However, replacing both domains (NC) completely abrogated FLCN interaction, similar to wild-type LDHB (Extended Data Fig. 3c). These observations further reinforce the inherent specificity of FLCN for LDHA over LDHB.
Canonically, LDHA is activated in cells by pyruvate accumulation22,23. To evaluate whether the activation of LDHA is coupled to its dissociation from FLCN, we treated HEK293 cells with physiological concentrations of pyruvate. LDHA activation resulted in disruption of the FLCN–LDHA complex, as co-IP of LDHA with FLCN was primarily observed at the lowest doses of exogenous pyruvate (Fig. 1e and Extended Data Fig. 4a). Notably, addition of lactate had a much milder effect on dissociation of LDHA from FLCN (Extended Data Fig. 4b), consistent with LDHA preference for pyruvate as a substrate24. Pre-incubation of LDHA with recombinant FLCN also attenuates LDHA activity in vitro (Fig. 1f), suggesting that the FLCN–LDHA interaction precludes substrate binding.
We next examined the impact of FLCN on NADH cofactor binding to LDHA. NADH binding in the active site of LDHA is a prerequisite for substrate binding. The dye Cibacron Blue 3GA (Cib) is often used for affinity-purification of enzymes that contain NADH cofactor binding sites25. LDHA binding to Cib-agarose was greatly diminished in HEK293 cells overexpressing FLCN, suggesting FLCN interference with cofactor binding to LDHA (Extended Data Fig. 4c). Together, our data suggest that the tumor suppressor FLCN specifically binds to LDHA, but not LDHB26, and inhibits its enzymatic activity.
FLCN uncompetitively inhibits LDHA.
To determine the molecular mechanism of FLCN-mediated inhibition of LDHA, we constructed, transiently expressed, and immunoprecipitated a series of FLCN truncation mutants in HEK293 cells. We identified amino acids (aa) 210–220 within FLCN to be essential for interaction with LDHA (Extended Data Fig. 5a–d). On the basis of the published cryo-EM structures, this region of FLCN falls within an unstructured loop positioned between two α-helices in the N terminus (Fig. 2a)8,27. We subsequently made a series of overlapping peptides including addition or removal of upstream or downstream amino acids, point mutations and T227 phosphorylation beginning with aa 220–230, as these residues are definitively within the LDHA-binding region (Fig. 2b and Extended Data Fig. 5d). We demonstrated that this peptide derived from aa 220–230 (FLCN-1) bound tightly to LDHA (Ka ≈ 1 × 10⁷ M−1; Extended Data Fig. 5e). Encouragingly, peptide-10 (FLCN-10; aa 219–228) showed greatly enhanced binding (Fig. 2c) and had a strong inhibitory effect on LDHA activity (70%) (Fig. 2d). These data are summarized in a plot of Ka against LDHA activity in Extended Data Fig. 5f.
Fig. 2 |. A decameric peptide of FLCN uncompetitively inhibits LDHA.
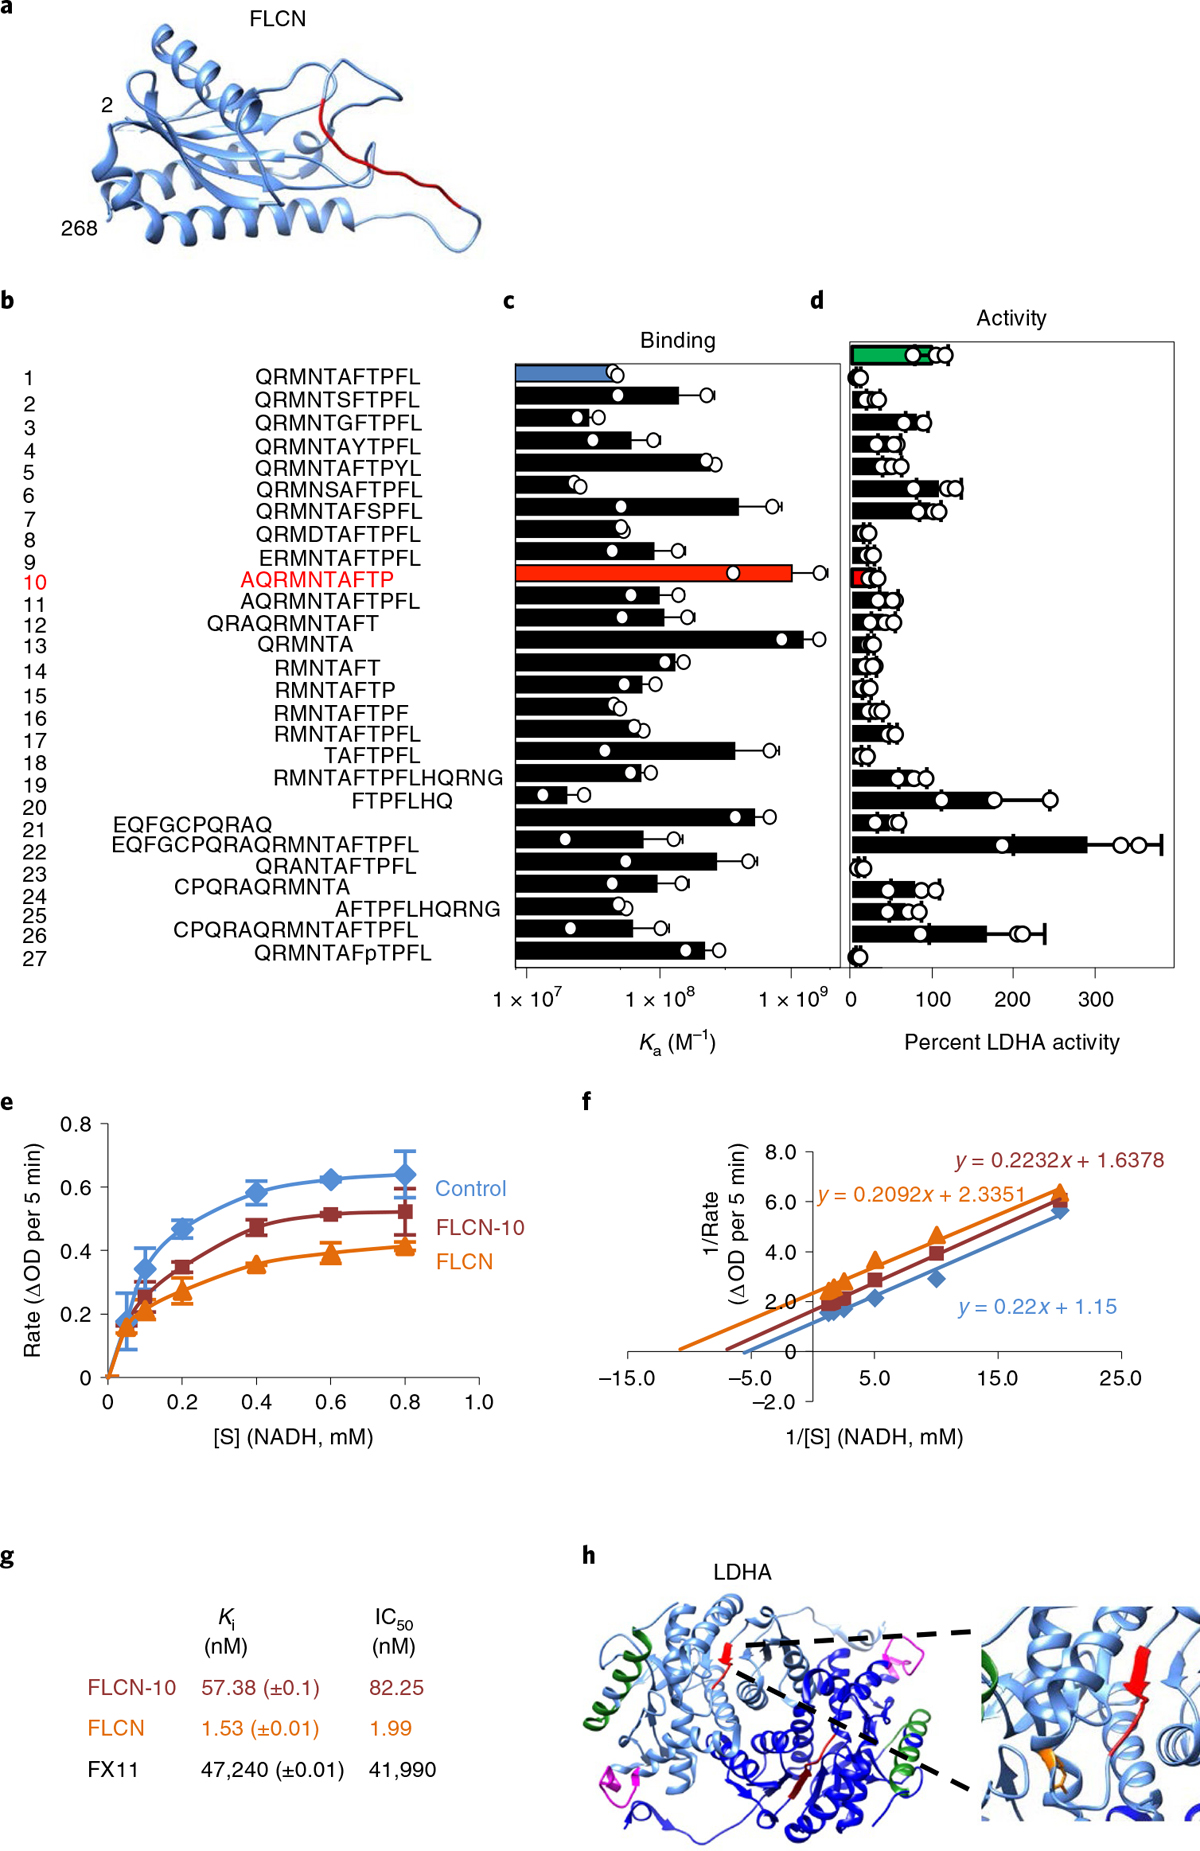
a, Structure of the FLCN N terminus solved by cryo-EM (aa 2–268; PDB 6NZD). The FLCN-10 peptide is highlighted in red. b–d, List of synthetic FLCN peptides (b) screened for Ka by fluorescence polarization anisotropy (c) or ability to inhibit LDHA (d) in vitro. The green bar represents the activity of LDHA alone (100%). LDHA activity is highlighted in the presence of FLCN-1 (blue) and FLCN-10 (red). Data are presented as mean ± s.d. (n = 3 independent samples). e, Michaelis–Menten kinetics of LDHA activity alone or in the presence of FLCN protein or FLCN-10 peptide. [S] is the concentration of NADH. Data are presented as mean ± s.d. (n = 3 independent samples). f, Enzyme kinetic data presented as a Lineweaver–Burk plot (n = 3 independent samples). g, Measured values for LDHA binding and kinetic data from this figure and Extended Data Fig. 6a–e. h, Structure of dimeric LDHA, with individual monomers colored light or dark blue (PDB 4OKN). Limited proteolysis-coupled mass spectrometry (MS) identified LDHA catalytic-loop-region perturbation (red) and loss of antigenic-loop accessibility (magenta) in response to FLCN-10 peptide binding. The green α-helix represents peptides unchanged by the presence of FLCN-10. The LDHA catalytic R106 is highlighted in orange (inset). Structures were rendered using Chimera v1.12 (UCSF). Source data for c–f are available online.
Previous work has shown that tetramerization of LDHA is largely dependent on concentration in vitro and that tetrameric LDHA displays increased activity20. Treatment of predominantly dimeric (10 ng μl−1) or tetrameric LDHA (500 ng μl−1) with recombinant FLCN protein or FLCN-10 peptide demonstrates that FLCN is able to effectively inhibit dimeric, but not tetrameric, LDHA (Extended Data Fig. 5g,h), in agreement with our earlier findings (Extended Data Fig. 2c–e). Using traditional enzyme kinetics, we further showed that FLCN-10 uncompetitively inhibits LDHA (Fig. 2e,f and Extended Data Fig. 6a,b). Both full-length FLCN protein and FLCN-10 peptide also showed greatly improved potency as compared to the previously characterized LDHA inhibitor FX114 (Extended Data Fig. 6c–f). The binding and kinetic data are summarized in Fig. 2g.
Limited proteolysis-coupled mass spectrometry (LiP-MS) is a technique by which proteolytic cleavage can be used to observe structural changes in a protein induced by small-molecule interaction28. Following digestion with trypsin, which cleaves after lysine and arginine residues, a complex of FLCN-10 peptide with full-length recombinant LDHA yielded one unique differential LDHA peptide corresponding to residues 91-LVIITAGAR-99, which forms the N-terminal portion of the LDHA catalytic loop (Fig. 2h and Supplementary Table 2)29. Accessibility of the LDHA catalytic loop is probably altered as a result of allosteric effects on the active site secondary to FLCN binding. This is consistent with FLCN interference with cofactor (NADH) binding and uncompetitive inhibition of LDHA. Interestingly, proteolytic sensitivity was lost for the LDHA peptide 213-TLHPDLGTDKDKEQWK-228 following FLCN-10 peptide treatment (Fig. 2h and Supplementary Table 2). This exposed, flexible region contains the ‘antigenic loop’ of LDHA, so named because it harbors sufficient variation to differentiate LDH isoforms30. Although distal from the active-site pocket (25 Å; ref. 16), this region may play a role in the ability of FLCN discrimination between LDH isoforms.
On the basis of the crystal structure of LDHA, arginine-106 is within its catalytic loop and is important for its activity, and mutation of R106 to alanine, lysine or glutamine has been shown to restrict movement of the catalytic loop31. These mutants showed increased binding to FLCN (Extended Data Fig. 6g). Additionally, streptavidin pulldown of a biotinylated FLCN-10 analog demonstrated enhanced binding to these inactive LDHA mutants (Extended Data Fig. 6g). Therefore, our data suggest that FLCN binding can be modulated by changes in the LDHA active site.
FLCN regulates glycolysis.
FLCN is a modular protein consisting of an N-terminal intrinsically disordered region (IDR), followed by two structured domains that are linked by a long IDR loop8,27,32. The identified LDHA-binding residues are located on this IDR loop, composed of residues 216–248 of FLCN (Fig. 3a). To gain further insight into the mechanism of FLCN binding and inhibition of LDHA, we made a series of mutations within the FLCN-10 peptide region of full-length FLCN. Each residue was mutated independently to alanine, with the exception of the two naturally occurring alanine residues (A219 and A225), which were mutated to asparagine (Fig. 3b). Several mutations in FLCN appeared to completely abrogate binding to LDHA, including R221A, F226A and P228A (Fig. 3c). Notably, only one mutation (M222A) markedly increased the binding of FLCN to LDHA (Fig. 3c).
Fig. 3 |. FLCN regulates glycolysis.
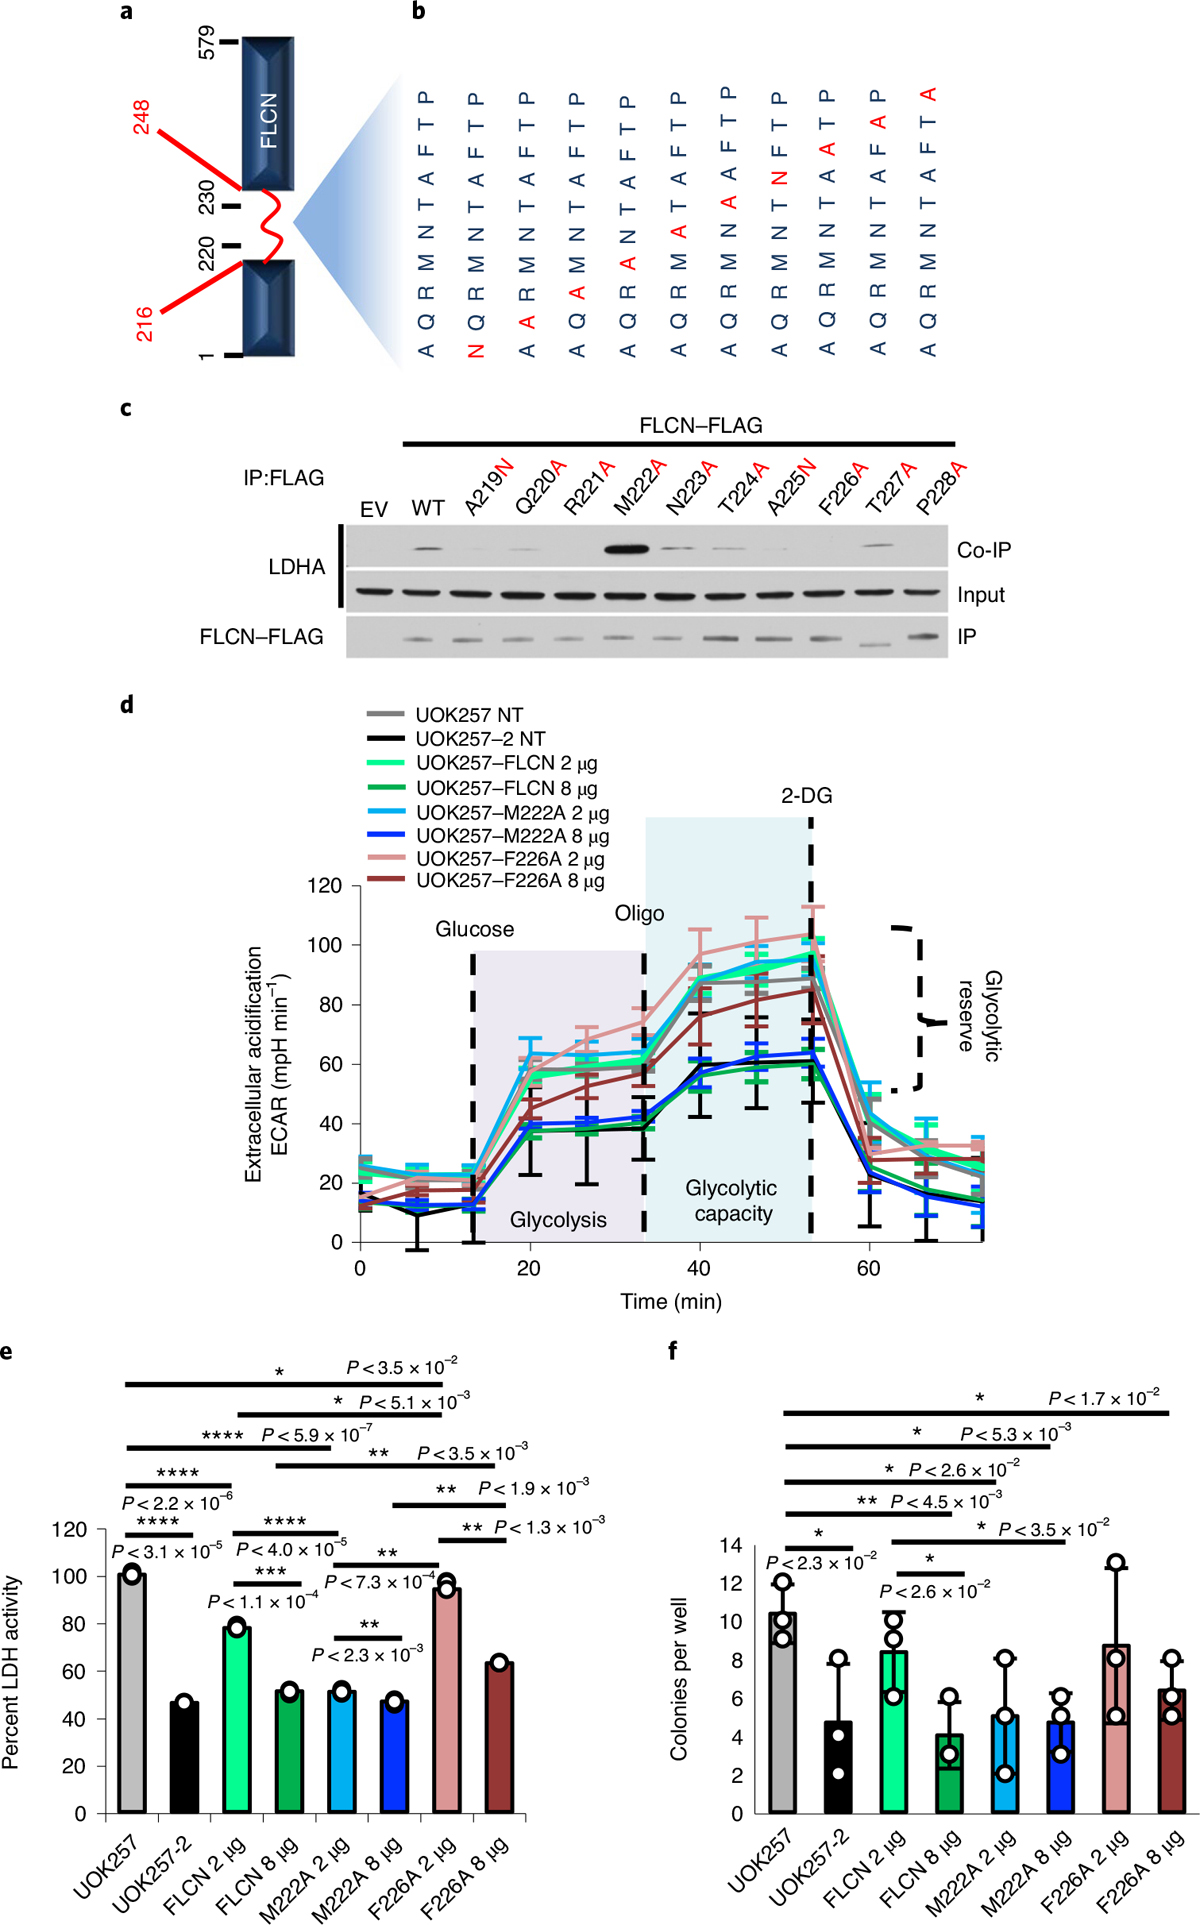
a, Schematic of the FLCN protein, highlighting the flexible loop region (red; aa 216–248). b, Individual amino acid mutations in full-length FLCN within the region corresponding to FLCN-10. c, FLAG-tagged FLCN protein harboring point mutations within the FLCN peptide region were transiently expressed in HEK293 cells and immunoprecipitated. The interaction with LDHA (co-IP) was assessed by immunoblot. The blots are a representative example of three independent experiments. d, Extracellular acidification rate of UOK257 cells transfected with 2 μg or 8 μg of WT FLCN, M222A or F226A mutants. Data are presented as mean ± s.d. (n = 8 independent samples). e, LDH activity of lysates collected from samples analyzed in Extended Data Fig. 7a,b. Data are presented as mean ± s.d. (n = 3 independent samples). Asterisks indicate P values based on unpaired Student’s t-test. *P < 0.05; **P < 0.01; ***P < 0.001; ****P < 0.0001. f, Soft agar assay of UOK257 cells expressing indicated FLCN-FLAG. The bar chart shows colonies counted per well. Data are presented as mean ± s.d. (n = 3 independent samples). Asterisks indicate P values based on unpaired Student’s t-test. Source data for c–f are available online.
BHD syndrome is caused by mutation and inactivation of FLCN and predisposes patients to renal cell carcinoma33. We examined the function of the FLCN-M222A mutant by expressing two different amounts of FLCN-WT-FLAG (WT, wild type) and FLCN-M222A-FLAG in the UOK257 cell line (Extended Data Fig. 7a), which is a FLCN-null cell line established from a patient with BHD syndrome10,34. Transient transfection of 2 μg of FLCN-WT or FLCN-M222A plasmid had little effect on extracellular acidification rate (ECAR), a measure of glycolytic flux (Fig. 3d). However, transfection of 8 μg of either construct reduced ECAR to a similar level as the FLCN-replaced control cell line, UOK257-2 (Fig. 3d). In parallel, we collected lysates from these transfections to assess their LDH activity. We observed LDH activity reduced to ~77% upon transfection of 2 μg of FLCN-WT, and a statistically significant further reduction in LDH activity (~51%) upon transfection of 2 μg FLCN-M222A (P < 0.0001; Fig. 3e). This decreased LDH activity is similar to that achieved by expressing 8 μg of FLCN-WT (Extended Data Fig. 7c), suggesting a much greater inhibitory effect of FLCN-M222A. These results were reinforced by the FLCN-F226A mutation, which lacked interaction with LDHA. Consequently, 2 μg of FLCN-F226A transfection had a minimal effect on ECAR and LDHA activity (Fig. 3c–e and Extended Data Fig. 7b). Overexpression of 8 μg of FLCN-F226A, however, appears to have saturated the cellular system, leading to a reduction in LDHA activity. It is noteworthy that this data point should be viewed as control and not the true dynamic of the FLCN–LDHA interaction.
Similarly, FLCN-M222A demonstrated increased ability to suppress anchorage-independent growth of UOK257 cells in soft agar, whereas the FLCN-F226A was less effective (Fig. 3f and Extended Data Fig. 7c,d). Together, the M222A and F226A mutants demonstrated that the inhibitory function of FLCN toward LDHA correlates with FLCN:LDHA binding affinity in cells.
Recent reports have demonstrated the role of FLCN-F118 in the assembly of the Ragulator complex8 and FLCN-R164 in the GTPase-activating protein (GAP) activity of FLCN27, both of which are outside the identified LDHA binding region. Interestingly, neither FLCN-F118D nor R164A mutation affected the FLCN-mediated inhibition of LDHA in HEK293 cell lysates, suggesting exclusivity of these reported FLCN functions (Extended Data Fig. 7e).
FLCN inhibition of LDHA is commonly lost in cancer.
It is well established that kidney cancers, in general, experience the Warburg effect35. We found FLCN expression levels reduced in clear cell renal cell carcinoma (ccRCC) cell lines compared to HEK293 control cells, and these ccRCC cell lines demonstrated hyperactive LDHA (Fig. 4a). We further observed that FLCN dissociation from LDHA in ccRCC correlated with increased LDHA activity (Fig. 4a). We also evaluated whether this dissociation was coupled to a change in the oligomeric state of LDHA. Consistent with our previous observations, these ccRCC cell lines demonstrated increased LDHA tetramer:dimer ratios that were inversely correlated with FLCN:LDHA interaction (Fig. 4b).
Fig. 4 |. FLCN inhibition of LDHA is commonly lost in cancer.
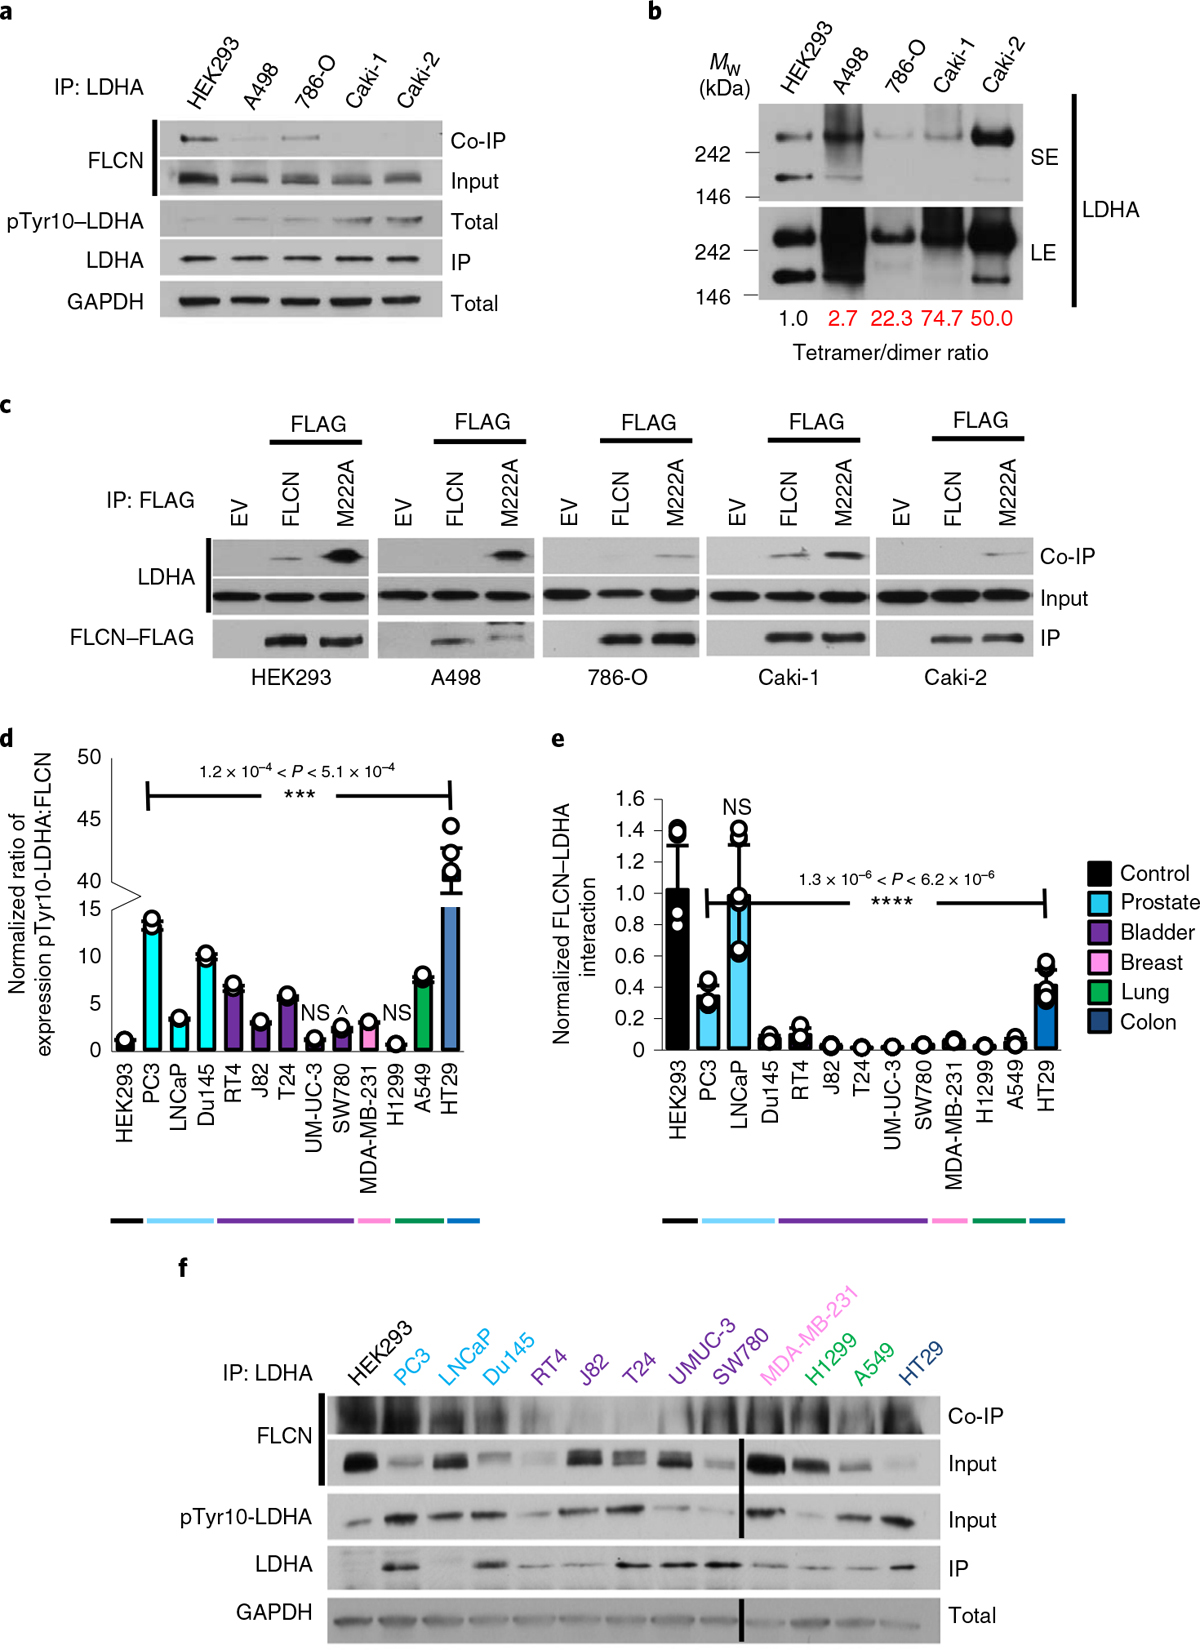
a, IP of endogenous LDHA with an anti-LDHA antibody from renal cell lines. Interaction with FLCN was observed by immunoblot. The blots are a representative example of three independent experiments. b, Native western blot of renal cell lysate, immunoblotted using anti-LDHA antibody. SE, short exposure; LE, long exposure. The blots are a representative example of three independent experiments. c, IP of WT FLCN and M222A FLCN mutant expressed in renal cell lines. Interaction with LDHA was observed by immunoblot. The blots are a representative example of three independent experiments. d, Densitometric ratio of normalized pTyr10-LDHA:FLCN expression in a panel of cancer cell lines. Data are presented as mean ± s.d. (n = 3 independent samples). P values based on unpaired Student’s t-test: ***P < 0.001; NS, not statistically significant; ^P < 6.9 × 10⁻². e, Normalized FLCN–LDHA interaction from a panel of cancer cell lines. Data are presented as mean ± s.d. (n = 3 independent samples). P values based on unpaired Student’s t-test: ****P < 0.0001. f, Immunoblots of endogenous FLCN and pTyr10-LDHA and interaction of FLCN and LDHA in a panel of cancer cell lines. Source data for all panels are available online.
As shown in Fig. 3c, FLCN-M222A displays enhanced binding to LDHA. FLCN-M222A retains the ability to bind LDHA when expressed in ccRCC, bypassing the potential regulatory signaling governing this loss of interaction in kidney cancer (Fig. 4c). We then sought to determine whether dissociation of FLCN from LDHA was a common feature of cancer cells. Across a panel of 12 cancer cell lines, 10 demonstrated an increased phospho-Tyr10-LDHA:FLCN ratio, supporting a link between decreased FLCN expression and increased LDHA activity across cancers (Fig. 4d,e). Immunoprecipitation of endogenous LDHA from these cancer cell lines confirmed this link, demonstrating a decreased ability of FLCN to interact with LDHA in cancer (Fig. 4e,f). Together, our data demonstrate FLCN:LDHA dissociation to be a common trait of cancer cells experiencing the Warburg effect.
FLCN peptide inhibits LDHA and induces apoptosis in cancer cells.
LDHA is an appealing therapeutic target, although inhibitors have not meaningfully progressed beyond preclinical evaluation36. Given this, we asked whether any of our screened peptides (Fig. 2b) were efficacious in cells. We selected a number of candidate peptides labeled with rhodamine B and evaluated their cell permeance using fluorescence microscopy (Extended Data Fig. 8a). We found that several of the candidate peptides were taken up by cells, including the two most potent in vitro, FLCN-10 and FLCN-13 (Extended Data Fig. 8a). In parallel, we examined whether these peptides were able to reduce the activity of LDHA in HEK293 cells. Interestingly, rhodamine B-labeled FLCN-1, FLCN-3 and FLCN-10 peptides effectively reduced LDHA activity, whereas FLCN-13 had only a modest effect (Extended Data Fig. 8b).
Previous work has established that inhibition of LDHA in Warburg-shifted cells induces apoptosis4. We subsequently examined whether these peptides could impact survival of ccRCC cell lines. Indeed, FLCN-10 peptide demonstrated the ability to suppress LDHA activity and induce cell death in ccRCC cell lines (Extended Data Fig. 9a). Importantly, FLCN-10 does not affect the survival of control HEK293 cells, despite LDHA inhibition (Fig. 5a and Extended Data Fig. 9b–d). As controls, we tested FLCN-13 (reduced cell permeability), FLCN-20 (inability to bind and inhibit LDHA), FLCN-24 (inability to inhibit LDHA) and c-Src-0237 (unrelated, cell-permeable negative control peptide) and showed that these peptides were unable to induce apoptosis (Fig. 5b,c).
Fig. 5 |. FLCN peptide inhibits LDHA and induces apoptosis in cancer cells.
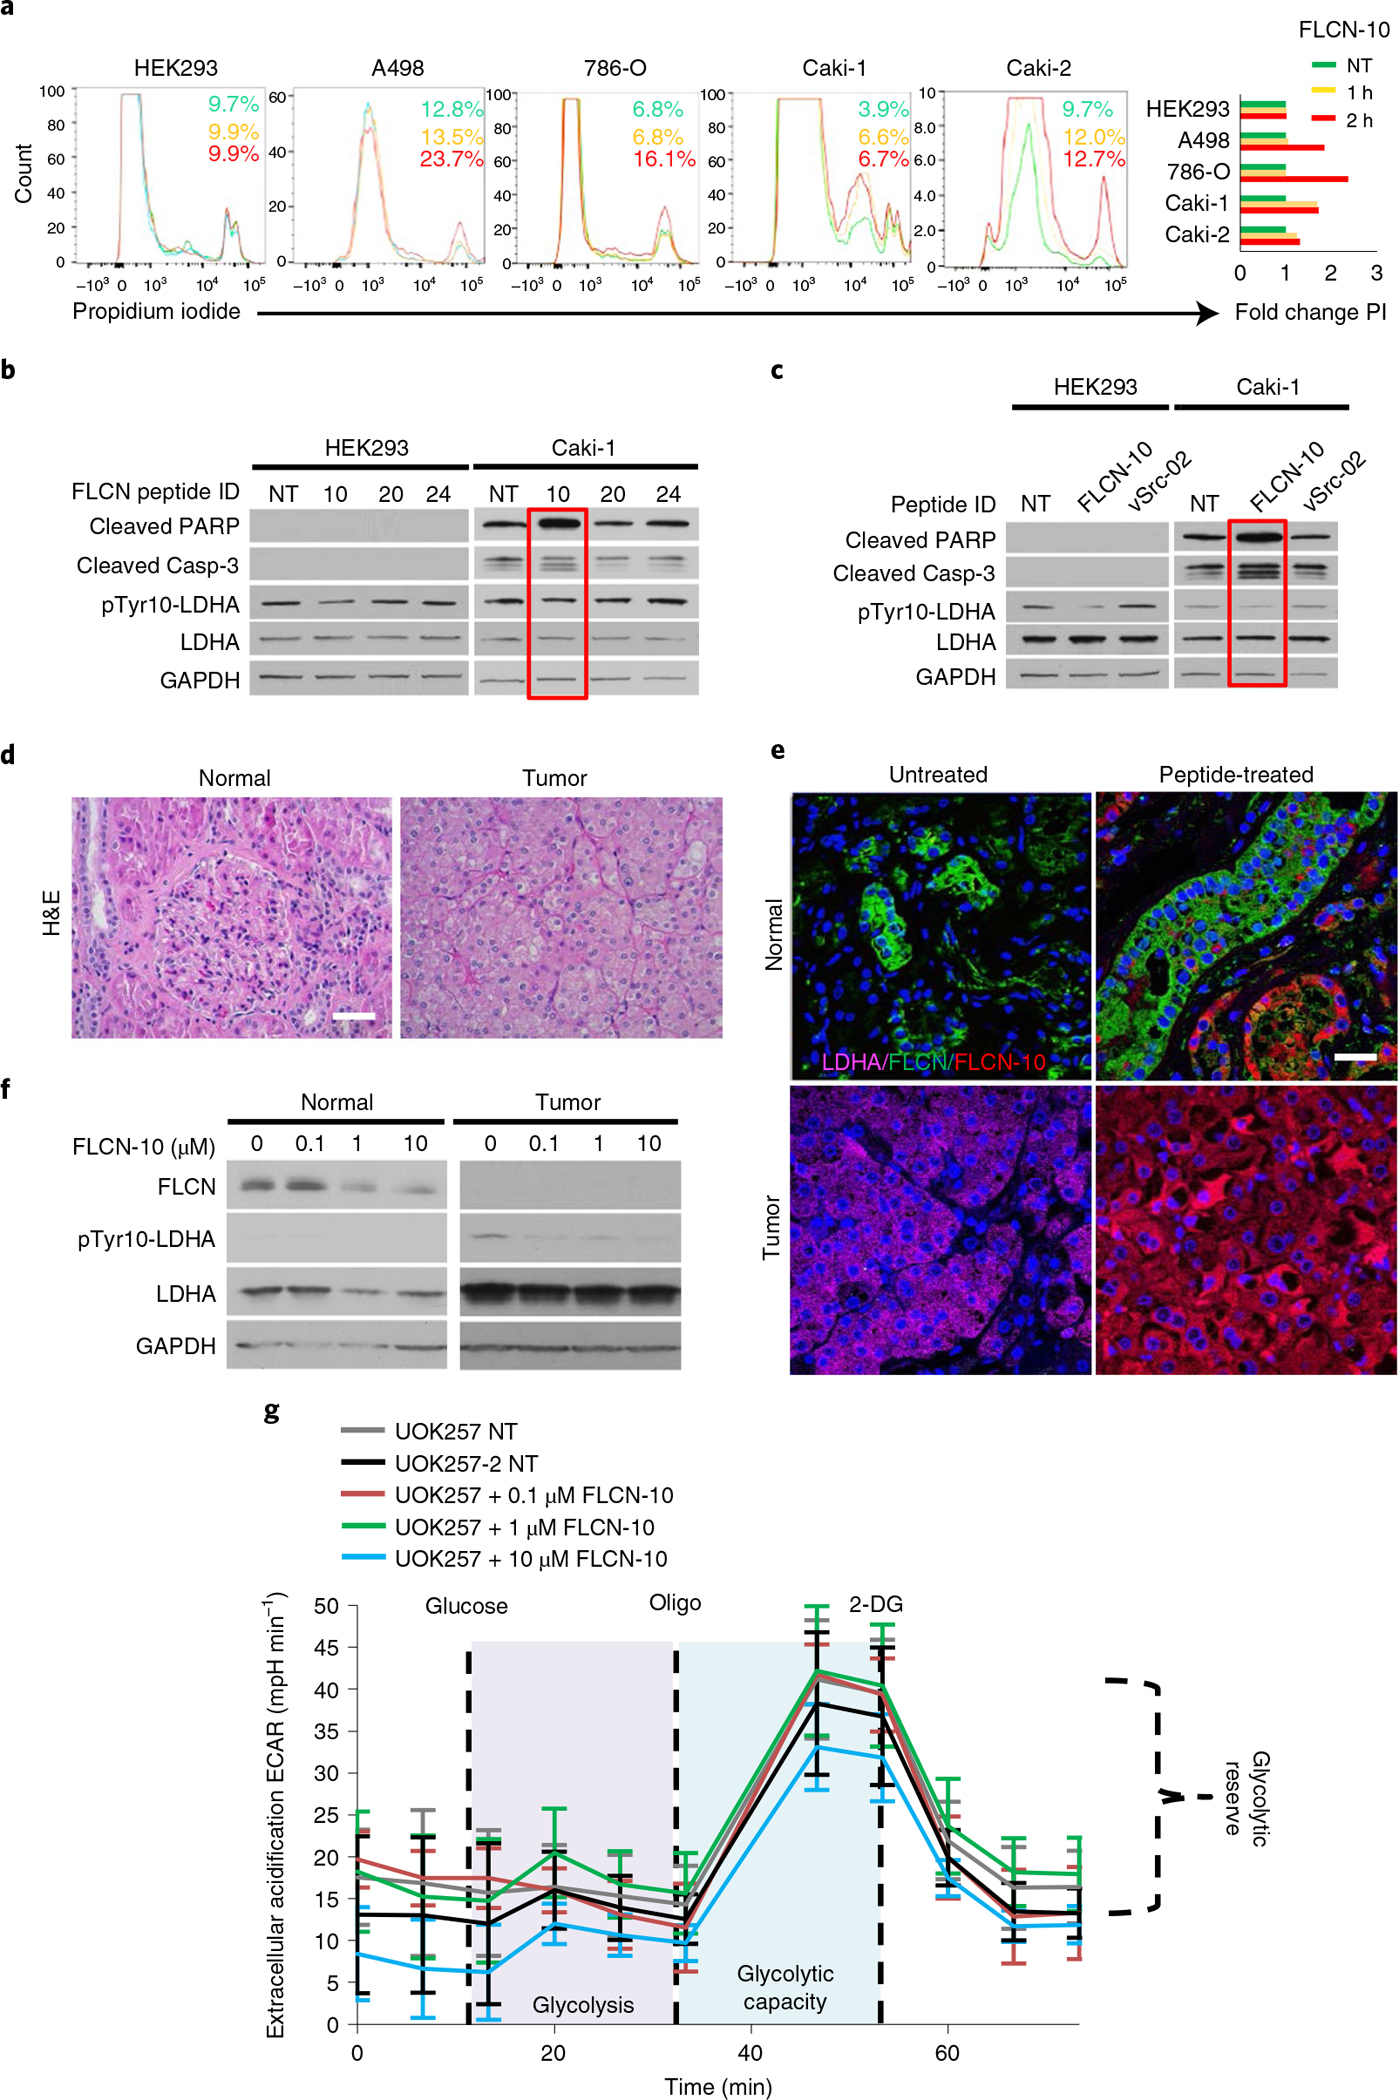
a, Flow-cytometric assessment of cell death in renal cell lines following treatment with 1 μM FLCN-10 for 1 h (yellow) or 2 h (red), as determined by propidium iodide staining. Green indicates no treatment (NT). A representative of three independent experiments is shown. b, Immunoblot of whole-cell lysates from HEK293 and Caki-1 cells following 1 μM treatment with the indicated FLCN peptides for 2 h. The blots are a representative example of three independent experiments. c, Immunoblot of whole-cell lysates from HEK293 and Caki-1 cells following 1 μM treatment with either FLCN-10 or vSrc-02 peptide for 2 h. d, Hematoxylin and eosin (H&E) staining of normal and tumor renal tissues from a patient with BHD. Scale bar, 40 μm. e, Fluorescence microscopy of normal and tumor renal tissues from a patient with BHD treated ex vivo with FLCN-10–rhodamine B and stained with anti-FLCN (green), anti-LDHA (pink) and DNA (Hoechst 33258; blue) Scale bar, 20 μm. f, Western blots of whole-cell lysates collected from e. g, Extracellular acidification rate of UOK257 cells treated with increasing amounts of FLCN-10 peptide for 2 h. Data are presented as mean ± s.d. (n = 4 independent samples). Source data for b, c, f and g are available online.
We then asked whether overexpression of full-length FLCN would cause apoptosis in ccRCC cells. Interestingly, although wild-type FLCN expression induced apoptosis in ccRCC cells, the M222A mutation, which confers greater binding and inhibition of LDHA, did not further increase apoptosis (Extended Data Fig. 9e). As expected, the FLCN-F226A mutant, which does not bind to LDHA, was unable to induce apoptosis in ccRCC, demonstrating that FLCN binding to and inhibition of LDHA is necessary to mediate this effect (Extended Data Fig. 9e). Surprisingly, the corresponding FLCN-M222A peptide (FLCN-10A) was cell impermeable and had no activity against LDHA in Caki-1 cells (Extended Data Fig. 9f,g).
FLCN-10 peptide is cell-permeable and can inhibit LDHA in vitro and in cells (Fig. 2d and Extended Data Figs. 8a and 9a,b). We therefore ex vivo-treated renal tumor tissue and adjacent normal kidney tissue from a patient with BHD harboring a pathogenic FLCN mutation with FLCN-10 peptide (Fig. 5d). Our data revealed that FLCN-10 peptide is able to penetrate both normal and tumor tissues (Fig. 5e) and effectively inhibit LDHA ex vivo, as evidenced by a reduction in phospho-Tyr10-LDHA (Fig. 5f).
To determine whether FLCN-10 peptide compensated for a lack of FLCN-mediated inhibition of LDHA, we returned to the FLCN-null patient-derived UOK257 cell model. A modest decrease in ECAR was observed following treatment with FLCN-10 peptide (Fig. 5g), suggesting FLCN-10 peptide can recapitulate FLCN function with regard to LDHA inhibition.
Despite this encouraging result, it is well known that linear peptides are notoriously unreliable as therapeutic effectors38. We therefore created a series of modified FLCN-10 peptides to confer protection from cellular proteases. Our data showed that the PEGylated, Retroinverse and heterocyclic FLCN-10 peptides were effective at inhibiting LDHA activity (Fig. 6a). However, the heterocyclic FLCN-10 peptide showed increased cell penetrance (Fig. 6b and Extended Data Fig. 10a), and treatment with this modified peptide induced cell death in ccRCC (Extended Data Fig. 10b,c), as well as a potent, dose-dependent decrease in ECAR (Fig. 6c). Taken together, cyclization is an effective modification for protecting FLCN-10 peptide while preserving its activity, suggesting potential therapeutic utility that warrants further investigation.
Fig. 6 |. Model of FLCN-mediated regulation of LDHA.
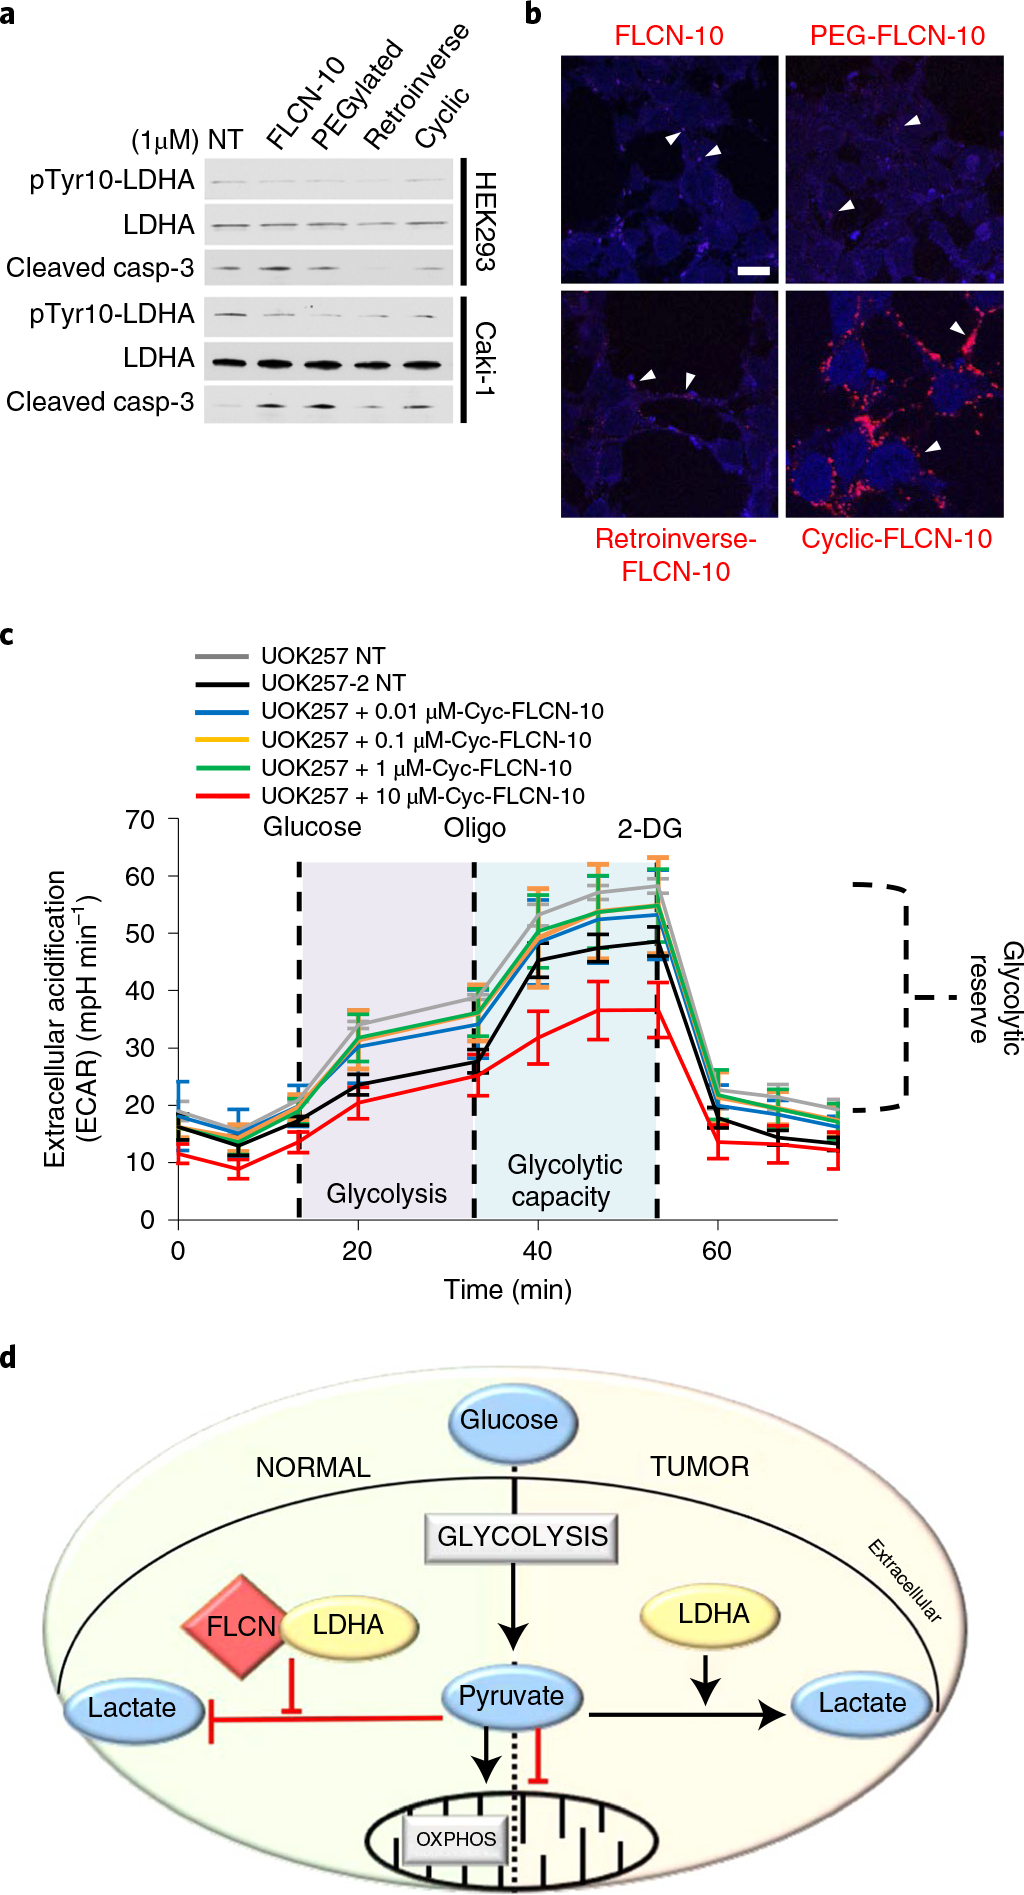
a, Western blot of pTyr10-LDHA and cleaved caspase-3 in HEK293 and Caki-1 cells following treatment with modified FLCN peptides. NT, no treatment. The blots are a representative example of three independent experiments. b, Fluorescence imaging of modified rhodamine B-labeled FLCN-10 peptides in HEK293 cells. White arrowheads denote examples of FLCN-10 localization. Scale bar, 10 μm. c, Extracellular acidification rate of UOK257 cells treated with increasing doses of cyclic-FLCN-10 peptide for 2 h. Data are presented as mean ± s.d. n = 6 independent samples. d, In normal cells, FLCN regulates the activity of LDHA. In cancer cells experiencing the Warburg effect, FLCN and LDHA have lost the ability to interact, leading to the hyperactivity of LDHA. Source data for a and c are available online.
In summary, we have characterized FLCN as a specific regulator of LDHA activity in normal cells (Fig. 6d). We subsequently identified a decapeptide within the amino domain of FLCN that is able to enter cancer cells and patient tumors and selectively inhibit LDHA activity, resulting in cell death.
Discussion
LDHA follows an ordered sequential mechanism whereby NADH binding to the co-factor-binding site precedes binding of pyruvate to the substrate-binding site. A subsequent conformational change in which the active-site loop closes over the active site provides a largely desolvated ternary complex. Our orthogonal approach has identified the tumor suppressor FLCN as a bona fide endogenous uncompetitive inhibitor of LDHA. Mechanistically, it appears that FLCN prefers binding to the less active LDHA dimer, compared to the hyperactive LDHA tetramer. A flexible loop within the amino terminus of FLCN controls movement of the LDHA active-site loop, which tightly regulates its enzyme activity and consequently metabolic homeostasis in normal cells. A protease-sensitive flexible antigenic loop within the substrate-binding domain of LDHA may also confer specificity of FLCN for LDHA.
Germline mutations in the tumor suppressor FLCN cause BHD syndrome, which predisposes affected individuals to develop kidney tumors. Previous works have shown that loss of FLCN causes dysregulation of LDHA and high lactate production in patient-derived cell lines10,11. Our data suggest that pathogenic mutation of FLCN enables LDHA hyperactivity as a result of a lack of direct LDHA inhibition by FLCN, leading to a metabolic shift in these tumors. FLCN is also unable to bind and inhibit LDHA in cancer cells that experience the Warburg effect. Interestingly, FLCN mutation rate is low across cancers39–43, suggesting a prevalent and robust epigenetic and/or post-translational inactivation. Although we do not know the signaling mechanisms that govern FLCN binding and/or dissociation from LDHA, we have managed to bypass this regulatory mechanism using a small FLCN-derived decapeptide that is cell-permeant and sufficient to efficiently inhibit LDHA activity. This decapeptide also has the ability to inhibit LDHA in a tumor derived from a patient with BHD.
LDHA is hyperactive in cancer cells experiencing the Warburg effect. Characteristically, LDHA is tetramerized in these cells, and binding to FLCN is less favorable in this state. However, the FLCN decapeptide has the ability to bind and inhibit LDHA in these cancer cells. Importantly, LDHA inhibitors have yet to see meaningful clinical advancement, in part due to a lack of isoform selectivity44. The inherent specificity of FLCN for LDHA over LDHB provides a conceptual advantage for future drug development efforts. Recapitulation of FLCN-mediated LDHA inhibition may be a new avenue for targeted therapy in these cancers.
online content
Any methods, additional references, Nature Research reporting summaries, source data, extended data, supplementary information, acknowledgements, peer review information; details of author contributions and competing interests; and statements of data and code availability are available at https://doi.org/10.1038/s41594-021-00633-2.
Methods
Mass spectrometry.
FLCN was immunoprecipitated from whole-cell lysate, subjected to SDS–PAGE and stained with Imperial Protein Stain (Thermo Fisher). Visible bands were digested in-gel with trypsin overnight at 37 °C, following reduction with DTT and alkylation with iodoacetamide. Mass spectrometry was performed at the Weill Cornell Medicine (WCM) Meyer Cancer Center Proteomics & Metabolomics Core Facility as described in previously published work45. The digests were vacuum-centrifuged to near dryness and desalted by C18 stage tips. A Thermo Fisher Scientific EASY-nLC 1000 system coupled online to a Fusion Lumos mass spectrometer (Thermo Fisher Scientific) was used. Buffer A (0.1% formic acid in water) and buffer B (0.1% FA in 100% acetonitrile (ACN)) were used as mobile phases for gradient separation. A 75 μm × 20 cm column (ReproSil-Pur C18-AQ, 3 μm, Dr. Maisch) was packed in house for peptide separation. Peptides were separated with a gradient of 3–32% buffer B over 50 min and 32–80% B over 10 min at a flow rate of 300 nl min−1. The Fusion Lumos mass spectrometer was operated in data-dependent mode. Full MS scans were acquired in an Orbitrap mass analyzer over a range of 300–1,500 m/z with a resolution of 60,000 at m/z 200. The top 15 most abundant precursors with charge states between 2 and 6 were selected with an isolation window of 1.4 thomsons and fragmented by higher-energy collisional dissociation with a normalized collision energy of 35. MS/MS scans were acquired in an Orbitrap mass analyzer with resolution of 15,000 at m/z 200. The automatic gain control target value was 1e6 for full scans and 5e4 for MS/MS scans, respectively, and the maximum ion injection time was 50 ms for both. The raw files were processed using the MaxQuant46 computational proteomics platform version 1.5.5.1 (Max Planck Institute) for protein identification. The fragmentation spectra were used to search the UniProt human protein database (downloaded 21 September 2017). Oxidation of methionine and protein N-terminal acetylation were used as variable modifications for database searching. The precursor and fragment mass tolerances were set to 7 and 20 ppm, respectively. Both peptide and protein identifications were filtered at a 1% false discovery rate based on a decoy search using a database with the protein sequences reversed.
Limited proteolysis mass spectrometry.
Limited proteolysis was achieved by exposing recombinant LDHA (10 ng μl−1) ± FLCN-10 peptide (10 μM) to 20 μg ml−1 trypsin in 25 mM ammonium bicarbonate solution. At intervals of 5, 10, 15, 30 and 60 min, 30 μl of the combined protein/trypsin solution was transferred to a second tube with 6 μl of SDS gel buffer and then boiled. The resulting partially proteolyzed mixture was then run on an SDS–PAGE gel and stained with Coomassie Brilliant Blue. The selected protein gel bands were excised and in-gel-digested with trypsin (0.6 μg) and the tryptic peptides were subjected to MALDI-MS on an in-house ABSCIEX TOF/TOF 5800 mass spectrometer. Positive-mode time of flight was used to identify peptides, and individual peptides were sequenced by MS/MS. All sequence and peptide fingerprint data were searched using the UniProt database and Mascot search engine.
Mammalian cell culture.
HAP1 cell lines were obtained from Horizon Discovery. UOK257 and UOK257-2 cell lines were provided by LSS. All other cell lines were obtained from the ATCC. Catalog numbers are listed in Supplementary Table 3. Cells were cultured at 37 °C in a CellQ incubator at 5% CO2. HEK293, Du145, J82, UMUC-3, MDA-MB-231, A549, UOK257 and UOK257-2 cells were grown in DMEM (Sigma-Aldrich), 786-O, PC3, SW780, LNCaP and H1299 cells in RPMI-1640 (Sigma-Aldrich), A498 cells in minimum essential medium (MEM; Sigma-Aldrich), Caki-1, Caki-2, HT29, T24 and RT4 cells in McCoy’s 5A medium (Sigma-Aldrich) and HAP1 cells in Isocove’s modified Dulbecco’s medium (IMDM; Gibco). Cell lines were tested for mycoplasma contamination at the early stages of the experiments.
Plasmids and transient transfection.
Cultured cells were transiently transfected using TransIT-2020 (Mirus Bio) transfection reagent according to the manufacturer’s protocol, incubated at 37 °C for 24 h (HEK293) or 48 h (UOK257, ccRCC cell lines) and subsequently prepared for protein extraction (next section). Control short interfering RNA (siRNA) or FLCN ON-TARGETplus siRNA (Dharmacon) (50 μM) was transiently transfected in LDHA knockout (KO) or LDHB KO HAP1 cells for 48 h using TransIT-2020. All mammalian expression experiments used genes cloned into the pcDNA3 vector backbone (Thermo Fisher). LDHA/LDHB chimeric constructs were synthesized by GeneWiz and subcloned into pcDNA3 (Thermo Fisher). Information about the DNA primer and siRNA sequences is provided in Supplementary Table 3.
Protein extraction, immunoprecipitation, pulldown and immunoblotting.
Protein extraction from mammalian cells was carried out using methods as previously described47. Tissues were homogenized with acid-washed glass beads and a mini-Beadbeater 8 cell disruptor (Biospec Products). Samples were agitated for 30 s at maximum speed followed by a 30-s incubation on ice. This procedure was repeated six times followed by a 10,000g, 5-min centrifugation to pellet the beads and unbroken cells. The supernatant was transferred to a new microtube and centrifuged (10,000g, 10 min) to pellet insoluble aggregates. The supernatant was then transferred to a fresh microtube. For IP, mammalian cell lysates were incubated with anti-FLAG or anti-HA antibody-conjugated agarose beads (Sigma) for 2 h at 4 °C or with anti-LDHA or anti-FLCN antibody for 1 h followed by protein G agarose for 2 h at 4 °C. For biotinylated peptide pulldown, lysates were incubated with biotinylated peptide for 1 h at 4 °C, followed by incubation with streptavidin agarose for 1 h at 4 °C. For Cibacron Blue pulldown, mammalian cell lysates were incubated with Cibacron Blue agarose for 1 h at 4 °C. Immunopellets were washed four times with fresh lysis buffer (20 mM Tris-HCl pH 7.4, 100 mM NaCl, 1 mM MgCl2, 0.1% NP40, cOmplete protease inhibitor cocktail (Millipore-Sigma) and PhosSTOP (Millipore-Sigma)) and eluted in 5× Laemmli buffer. Precipitated proteins were separated by SDS–PAGE and transferred to nitrocellulose membranes. Co-immunoprecipitated proteins were detected by immunoblotting with primary antibodies (anti-FLAG (Sigma), anti-GAPDH (1D4, Enzo Life Sciences), anti-LDHA (E-9, abcam), anti-HA (C29F4), anti-FLCN (D14G9), anti-LDHB, anti-phospho-Tyr10-LDHA, anti-cleaved caspase-3 (Asp175) (5A1E, Cell Signaling)) followed by secondary antibodies raised against mouse, rabbit and rat (Cell Signaling) at 1:4,000 dilution. Densitometry was performed using Image Studio Lite (LI-COR Biosciences). The catalog numbers of the commercially available antibodies used are provided in Supplementary Table 3.
Native polyacrylamide gel electrophoresis.
Proteins were extracted as above. The following 5× sample loading buffer was prepared: 250 mM Tris-HCl, pH 6.8, 30% glycerol, 0.05% bromophenol blue. Samples were incubated with sample buffer for 5 min at room temperature and loaded on a prepared Criterion Tris-HCl protein gel (Bio-Rad) in 1× native running buffer (25 mM Tris base, 192 mM glycine). Proteins were subjected to electrophoresis at 100 V for 2 h and transferred to a nitrocellulose membrane with an Ready-to-Assemble (RTA) transfer kit according to the manufacturer’s protocol (Bio-Rad) using the standard 30-min transfer protocol on a TransBlot Turbo system (Bio-Rad).
LDH activity assay.
LDH activity was measured according to the manufacturer’s protocol (MAK066, Sigma-Aldrich). In brief, 25 ng of recombinant LDHA was pre-incubated with either peptide or recombinant FLCN protein for 30 min on ice. Samples were then transferred to an optically clear 96-well plate and substrate mix was added to each well. Absorbance was measured at 450 nm every 5 min until saturation. For measurement of LDH activity in lysates, 1 μg of whole-cell lysate was diluted into 50 μl total volume with 1× assay buffer (included in MAK066) in a 96-well plate. Absorbance at 450 nm was measured every 5 min following addition of substrate mix. All experiments were performed using three biological replicates and measured in triplicate.
LDHA kinetics and inhibition assay.
The effect of FLCN, FLCN-10 peptide and FX11 (small-molecule inhibitor of LDHA control) on LDHA activity has been examined in previously published reactions48,49. The reaction contains 50 mM Tris-HCl buffer pH 7.0, 2 mM pyruvate, varied concentrations of NADH and 2 nM FLCN or 100 nM FLCN-10 peptide, or 60 μM FX11. All assays were carried out in triplicate, and at least two independent assays were performed. GraphPad Prism 6 was used to calculate half-maximum inhibitory concentrations (IC50). Microsoft Excel was used to calculate kinetic parameters with appropriate nonlinear regression models, including Michaelis–Mention and allosteric sigmoidal models for substrates and cofactors. Only reaction data in the linear range were used in computations, which typically occurred within a reaction time of 5 min. The inhibitor constants (Ki) for FLCN, FLCN-10 peptide and FX11 were calculated using the Lineweaver–Burk plot and a web-based tool (https://bioinfo-abcc.ncifcrf.gov/IC50_Ki_Converter/index.php) for converting IC50 values to Ki values for inhibitors of enzyme activity and ligand binding50.
Protein purification.
FLCN and LDHA were cloned into pRSET-A (Thermo Fisher) and expressed and purified from Escherichia coli strain BL21 (DE3). Transformed cells were grown at 37 °C in LB medium with 50 mg l−1 ampicillin until the optical density at 600 nm reached 0.6. The cultures were then cooled to 30 °C, induced with 1 mM IPTG and grown overnight. Cells were collected by centrifugation and lysed by sonication in fresh lysis buffer without detergent (20 mM Tris-HCl pH 7.4, 100 mM NaCl, 1 mM MgCl2, protease inhibitor cocktail (Millipore-Sigma) and PhosSTOP (Millipore-Sigma)). After sonication, Triton X-100 was added to a final concentration of 1% before pelleting insoluble debris by centrifugation. The supernatant was collected, and expression was assessed by immunoblotting. Isolation was accomplished by two sequential Ni-NTA agarose (Qiagen) pulldowns. The lysate was incubated with Ni-NTA agarose (Qiagen) for 2 h at 4 °C. Proteins bound to Ni-NTA agarose were washed three times with lysis buffer (as above) followed by two washes with 50 mM imidazole in lysis buffer. Proteins were then eluted in 500 mM imidazole in lysis buffer and concentrated in 10K Amicon Ultra centrifugal filters (Millipore). Concentrations were determined using the Micro BCA protein assay kit (Thermo Scientific) according to the manual protocol. Purified protein was run on an SDS–PAGE gel and Coomassie-stained to confirm purity before use in assays.
Ex vivo peptide treatment.
Tumor and adjacent normal renal tissue from the patient with BHD were obtained with written informed consent on an Institutional Review Board (IRB)-approved protocol from the Department of Urology at SUNY Upstate Medical University. This procedure was compliant with all relevant ethical regulations. At the time of partial nephrectomy, which was done with <15 min of renal ischemia, BHD tumors were dissected into 3- to 5-mm3 pieces and cultured on a presoaked gelatin sponge (Johnson & Johnson) in 24-well plates containing 2 ml of RPMI-1640 with 10% FBS and antibiotic/antimycotic solution. Tissues were cultured at 37 °C for 16 h, followed by addition of the indicated concentrations of FLCN-10–Rhod-B and further incubation at 37 °C for 2 h. Following treatment, tissues were either homogenized and lysed for immunoblotting (as above) or fixed in 10% formalin and embedded in paraffin. Thin sections were mounted on slides and stained with H&E or alternately with anti-FLCN and anti-LDHA for immunofluorescence (next section).
Fluorescence microscopy.
For peptide treatments, HEK293 cells were seeded on glass coverslips and grown overnight. The following day, cells were treated with rhodamine B-labeled peptide for 2 h, followed by fixation in 1% paraformaldehyde for 5 min, and mounted on slides using Prolong Gold Anti-fade reagent with 4′,6-diamidino-2-phenylindole (DAPI, Thermo Fisher). Images were obtained using a Leica SP8 Confocal Microscope using the LAS X software platform. Cells or thin tissue sections were fixed in 2% paraformaldehyde, permeabilized in 0.2% Triton X-100, and blocked for 2 h in 1% BSA at room temperature before staining. After three washes in 1× phosphate-buffered saline, slides were incubated with primary antibodies to LDHA (sc-137243, Santa Cruz, 1:50) and FLCN (NBP144995, Novus Biologicals, 1:30) overnight at 4 °C. Following several washes in 1× phosphate-buffered saline, tissues were incubated with secondary antibodies Alexa Fluor 594 and Alexa Fluor 488 (Life Technologies) diluted in 1% BSA for 45 min at room temperature. Nuclear staining was achieved using ProLong Gold antifade reagent with DAPI (Life Technologies). Representative images were captured on a Zeiss LSM710 confocal microscope.
Binding measurements.
LDHA at the indicated concentrations was incubated on ice in 50 mM Tris pH 7.2, 150 mM NaCl, 1 mM tris(2-carboxyethyl)phosphine (TCEP), 4 mM MgCl2 with 1 mM rhodamine B-labeled FLCN peptide for 30 min. Fluorescence anisotropy was measured in triplicate using a SpectraMax i3 system equipped with a rhodamine fluorescence polarization module (lex/lem, 535 nm/595 nm). Curve fitting was carried out in KaleidaGraph 4.0.
Seahorse metabolic assay.
UOK cells were transfected in 100-mm dishes at 50% confluency and incubated for 24 h. Subsequently, cells were seeded at 1 × 10⁵ per well 24 h before assay initiation in a 96-well plate, and treated for the indicated times immediately preceding measurements. A glycolytic stress test was then carried out on an Agilent Seahorse XF instrument according to the manufacturer’s protocol.
Flow cytometric analysis.
Fluorescence-activated cell sorting (FACS) analysis was performed according to the protocol in the Annexin V:FITC kit (Bio-Rad). In brief, cells were plated at 0.5 × 10⁶ and incubated at 37 °C for 16 h. Cells were subsequently treated with FLCN-10 peptide at the indicated concentrations for 1–2 h. Cells were trypsinized, collected and washed once with 1× binding buffer (included in the kit). Annexin V-FITC was added at 1:40 and incubated for 10 min at room temperature in the dark. Following one wash with 1× binding buffer, propidium iodide was added, then the cells were immediately run on a Becton Dickinson LSRFortessa instrument (BD Biosciences). Data were analyzed using FlowJo software v10.6.2 (Becton Dickinson).
Linear peptide synthesis.
Linear peptides (Fig. 2b) were synthesized and HPLC-purified to >95% purity by Life Technologies.
General procedures for peptide synthesis.
Resin loading.
Resin (0.5 mmol g−1 loading) was swollen in CH2Cl2 for 30 min then washed with dimethylformamide (DMF; 3 × 3 ml). A solution of entering Fmoc-amino acid, N,N′-diisopropylcarbodiimide (DIC) and oxyme (5:5, 5 equiv. over resin loading) and 5% 4-dimethylaminopyridine (DMAP) in DMF (3 ml) was added and the resin shaken at room temperature for 4 h. The resin was washed with DMF (2 × 3 ml) and capping was performed by treatment with acetic anhydrid e/N,N-diisopropylethylamine (DIEA) in DCM (1 × 30 m). The resin was then washed with DMF (2 × 3 ml), CH2Cl2 (2 × 3 ml) and DMF (2 × 3 ml). The resin was subsequently submitted to fully automated iterative peptide assembly solid-phase peptide synthesis (Fmoc-SPPS).
Peptide assembly via iterative fully automated microwave-assisted SPPS.
Peptides were assembled by stepwise microwave-assisted Fmoc-SPPS on a Biotage Alstra Initiator+ peptide synthesizer, operating in a 0.1 mmol scale. Activation of entering Fmoc-protected amino acids (0.3 M solution in DMF) was performed using 0.5 M ethyl cyanohydroxyiminoacetate (Oxyma, Sigma-Aldrich) in DMF/0.5 M DIC in DMF (1:1:1 molar ratio), with a 5 equiv. excess over the initial resin loading. Coupling steps were performed for 7 min at 75 °C. Fmoc-deprotection steps were performed by treatment with a 20% piperidine solution in DMF at room temperature (1 × 10 m). Following each coupling or deprotection step, peptidyl-resin was washed with DMF (4 × 3.5 ml). Upon complete chain assembly, the resin was washed with DCM (5 × 3.5 ml) and gently dried under a nitrogen flow.
Cleavage from the resin.
Resin-bound peptide was treated with a mixture of ice-cold trifluoroacetic acid (TFA), triisopropylsilane (TIS), water and thioanisole (90:5:2.5:2.5 vol/vol/vol/vol, 4 ml). After gently shaking the resin for 2 h at room temperature, the resin was filtered and washed with neat TFA (2 × 4 ml). The combined cleavage solutions were worked up as indicated in the next section.
Work-up and purification.
The cleavage mixture was concentrated under a nitrogen stream and then added dropwise to ice-cold diethyl ether (40 ml) to precipitate the crude peptide. The crude peptide was collected by centrifugation and washed with further cold diethyl ether to remove scavengers. Residual diethyl ether was removed by a gentle nitrogen flow and the crude peptide was purified by reverse-phase (RP)-HPLC and lyophilized.
Peptide cyclization.
Peptides for head-to-tail cyclization were detached from the resin using 25% 1,1,1,3,3,3-hexafluoro-2-propanol (HFP) in DCM (4 × 10 ml). Collected fractions were combined and dried under reduced pressure. The residue was then dissolved in dry DMF (1.25 mM) and hexafluorophosphate benzotriazole tetramethyl uronium/N,N-diisopropylethylamine (HBTU/DIEA) were added (1.1 and 2 equiv. respectively). The reaction was left overnight and then DMF evaporated. The dry residue was then treated with standard TFA-based cleavage solution to yield the fully unprotected, cyclic peptides.
Synthesis of fluorescein-labeled peptides.
Cysteine-bearing peptides were conjugated to bifunctional fluorescein-maleimide, 6-isomer (MAL-FAM), (Lumiprobe) as follows. Peptide (1 equiv.) was first dissolved in phosphate buffer (Na2HPO4 0.4 M, pH 7.8). The resulting solution was ice-cooled and mixed with MAL-FAM solution (1.2 equiv., 50:50 acetonitrile/water mixture). The reaction mixture was left to react under gentle shaking until full conversion of the reagents (monitored by RP-HPLC). At reaction completion, the conjugation products were isolated by preparative RP-HPLC and lyophilized.
Reverse-phase high-performance liquid chromatography analysis and purification.
Analytical RP-HPLC was performed on a Shimadzu Prominence HPLC instrument (Shimadzu) using a Shimadzu Shimpack GWS C18 column (5 μm, 4.6 mm inner diameter (i.d.) × 150 mm). Analytes were eluted using a binary gradient of mobile phase A (100% water, 0.1% TFA) and mobile phase B (30% water, 70% acetonitrile, 0.1% TFA) using the following chromatographic method: 10% B to 100% B in 14 min; flow rate, 1 ml min−1. Preparative RP-HPLC was performed on a Shimadzu HPLC system using a Shimadzu C18 column (10 μm, 21.2-mm (i.d.) × 250 mm) using the following chromatographic method: 0% B to 100% B in 45 min; flow rate, 14 ml min−1. Pure RP-HPLC fractions (>95%) were combined and lyophilized.
Electro-spray ionization mass spectrometry.
Electro-spray ionization mass spectrometry was performed using a Bruker Esquire 3000+ instrument equipped with an electro-spray ionization source and a quadrupole ion trap detector (QITD).
Quantification, statistical analysis and reproducibility.
The data presented are representative of three biological replicates, unless otherwise specified. All statistics were performed using GraphPad Prism version 7.00 for Windows (GraphPad Software, https://www.graphpad.com). Statistical significance was ascertained between individual samples using a parametric unpaired t-test. Significance is denoted by asterisks in each figure: *P < 0.05; **P < 0.01; ***P < 0.001; ****P < 0.0001. Error bars represent the standard deviation for three independent experiments, unless otherwise indicated.
No statistical methods or criteria were used to include or exclude samples. All immunoblots and microscopy in Figs. 1b,c, 3c, 4a–c, 5b–d and 6a,b and Extended Data Figs. 1b,c, 2a–c,e, 3c, 5a–d, 6g, 7a–d, 8a and 9a,b,e,f were repeated at least twice independently, with similar results.
Reporting Summary.
Further information on research design is available in the Nature Research Reporting Summary linked to this Article.
Data availability
The MS proteomics data have been deposited to the ProteomeXchange Consortium via the PRIDE51 partner repository with the dataset identifier PXD018410 (www.ebi.ac.uk/pride/). Source data are provided with this paper.
Extended Data
Extended Data Fig. 1 |. The tumor suppressor FLCN mediated binding and inhibition of LDHA.
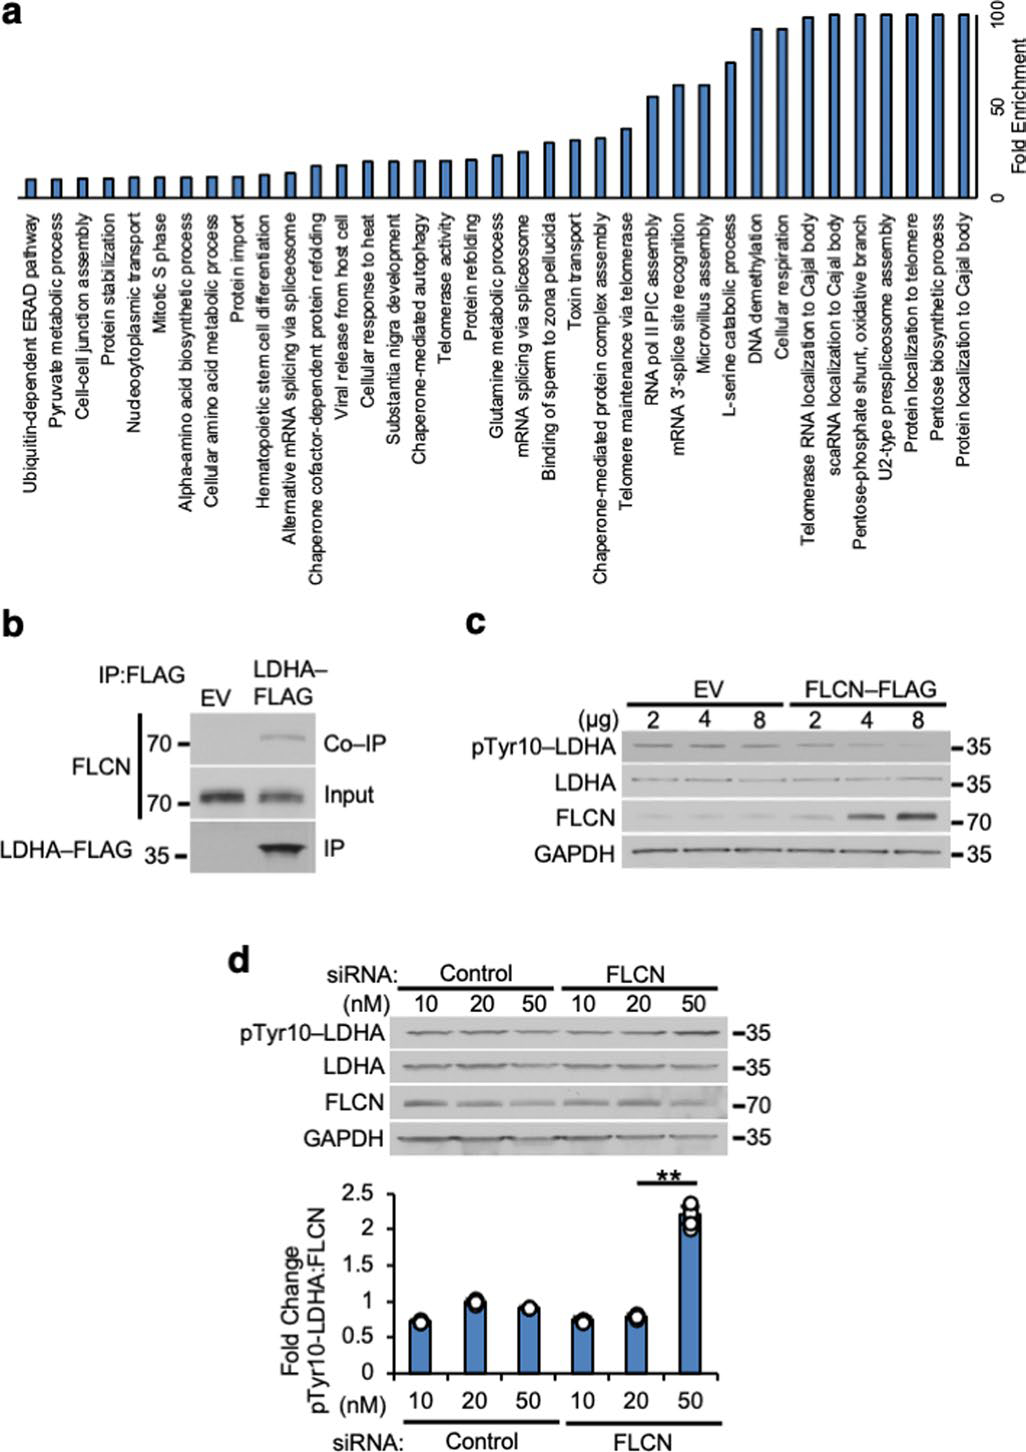
a) Gene Ontology term analysis of FLCN proteomic data using Panther v15.0 (pantherdb.org). b) LDHA-FLAG IP from HEK293 cells immunoblotted with anti-FLCN antibody. c) Titration of FLCN-FLAG expression in HEK293 cells immunoblotted with anti-pTyr10-LDHA antibody. d) Titration of siRNA targeting FLCN in HEK293 cells immunoblotted with anti-pTyr10-LDHA antibody. Bar chart contains densitometry of pTyr10-LDHA:FLCN ratio. Unpaired Student’s t-test, (p < 2.9×10⁻¹⁰, n=3). Data shown as mean ± s.d.
Extended Data Fig. 2 |. inherent specificity of FLCN for binding to dimeric LDHA.
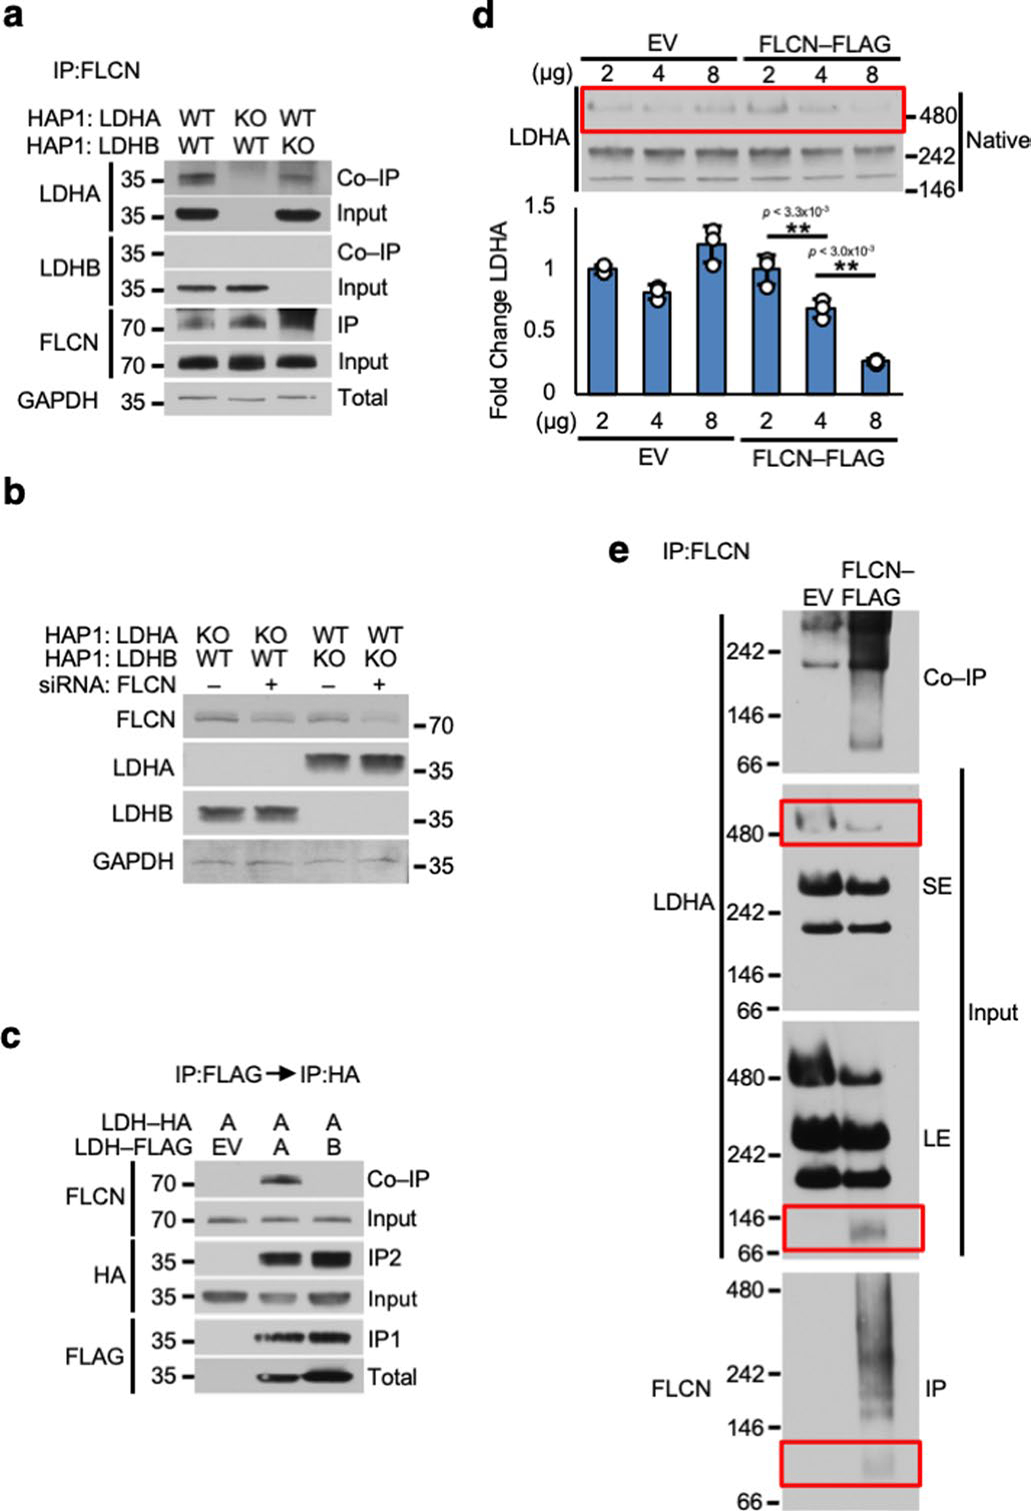
a) IP of endogenous FLCN from whole cell lysates of LDHA or LDHB knockout HAP1 cells. Immunoblotted with anti-FLCN antibody. b) Western blot of siRNA knockdown of FLCN in Fig. 1d. c) Tagged LDHA and LDHB subunits were consecutively immunoprecipitated and immunoblotted with anti-FLCN. d) Lysates from Extended Data Fig. 1c subjected to Native PAGE. Bar chart contains ratio of densitometry of largest LDHA oligomer:GAPDH (see Extended Data Fig. 1c; Unpaired Student’s t-test, n=3). Data shown as mean ± s.d. e) IP of FLCN from HEK293 cells subjected to Native PAGE. SE = short exposure of immunoblot, LE = long exposure of immunoblot.
Extended Data Fig. 3 |. The tumor suppressor FLCN specifically binds to the amino and carboxy domain of LDHA.
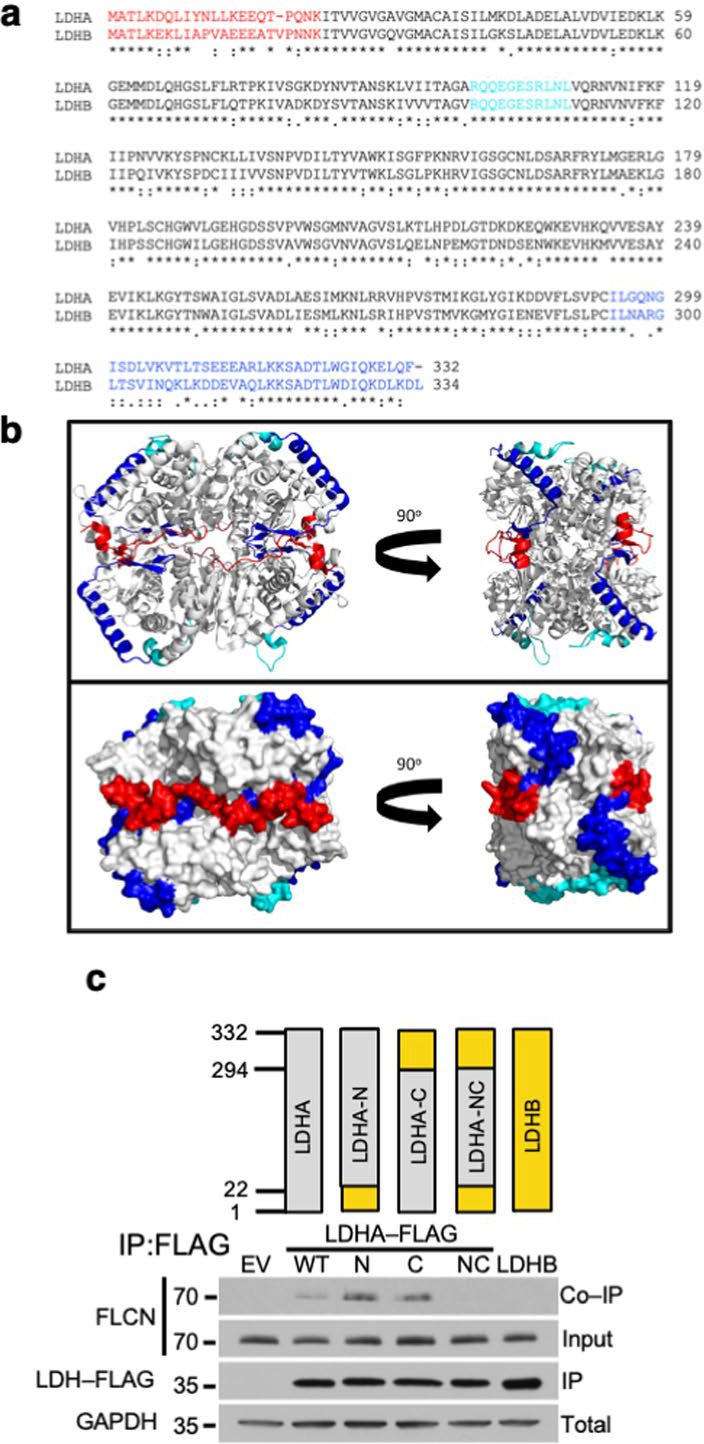
a) Sequence alignment of human LDHA and human LDHB using https://clustalw.ddbj.nig.ac.jp/. The red N- and blue C-terminal residues that were swapped to generate the N, C and NC chimeric constructs used in Extended Data Fig. 2c are highlighted. The active site loop (99–110) is colored cyan. b) LDHA tetramer (PDB ID: 1i10) in ribbon (top) and surface (bottom) models represented in the standard view (left) and 90° rotated view (right). The N-terminus (residues 1–22) is highlighted in red and the C-terminus (residues 294–332) is highlighted in blue. Note the proximity of the C-terminal helix (blue) to the active site loop (residues 99–110; cyan) within each subunit. In the tetrameric arrangement, the N- and C-terminal residues of adjacent subunits form a continuous surface. Structure rendered using PyMOL 2.3. c) LDHA/LDHB chimeric constructs were transfected into HEK293 cells and immunoprecipitated. Co-IP of FLCN was detected by immunoblot.
Extended Data Fig. 4 |. FLCN interference with cofactor binding to LDHA.
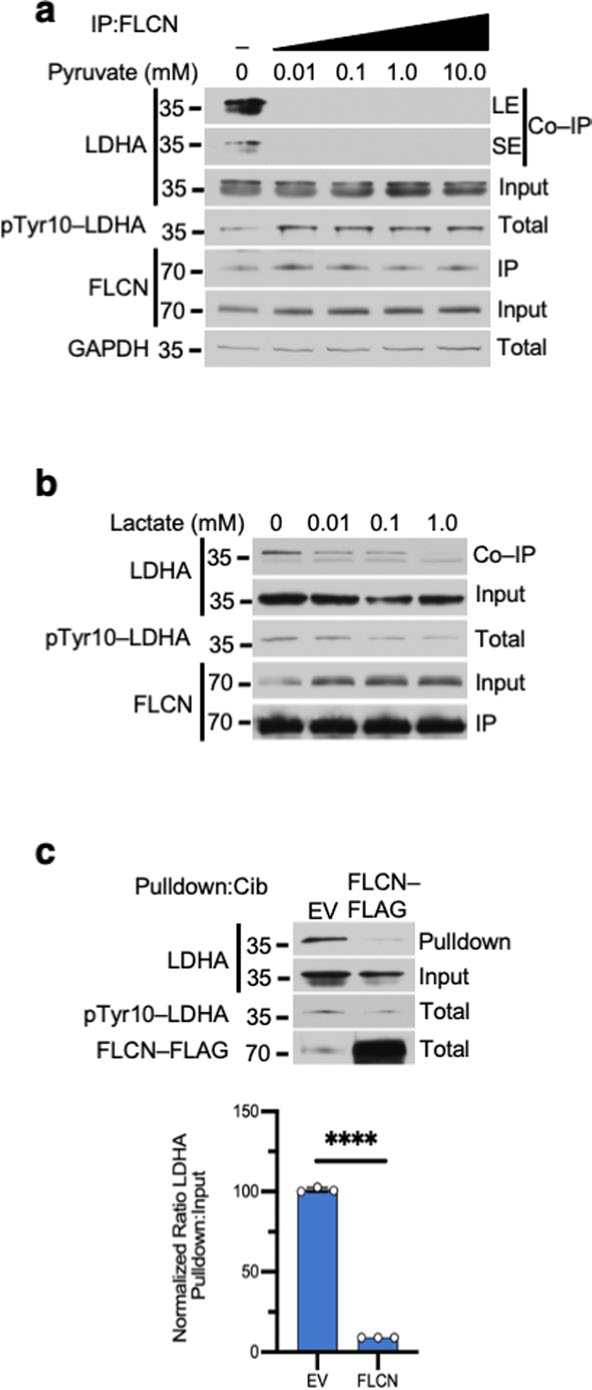
a) Immunoblot of anti-FLCN IPs and whole cell extracts following exogenous addition of pyruvate to HEK293s (6 h treatment duration; n=3). SE = short exposure of immunoblot, LE = long exposure of immunoblot. b) Immunoblot of anti-FLCN IPs and whole cell extracts following exogenous addition of lactate to HEK293s (6 h treatment durations; n=3). c) Pulldown of LDHA from cell lysate expressing EV or FLCN-FLAG using Cibacron blue agarose was evaluated by immunoblot. Bar chart represents the ratio of Pulldown:Input normalized to EV. Unpaired Student’s t-test, (p < 3.3×10⁻⁸; n=3). Data shown as mean ± s.d.
Extended Data Fig. 5 |. FLCN-10 peptide is able to effectively inhibit dimeric but not tetrameric LDHA.
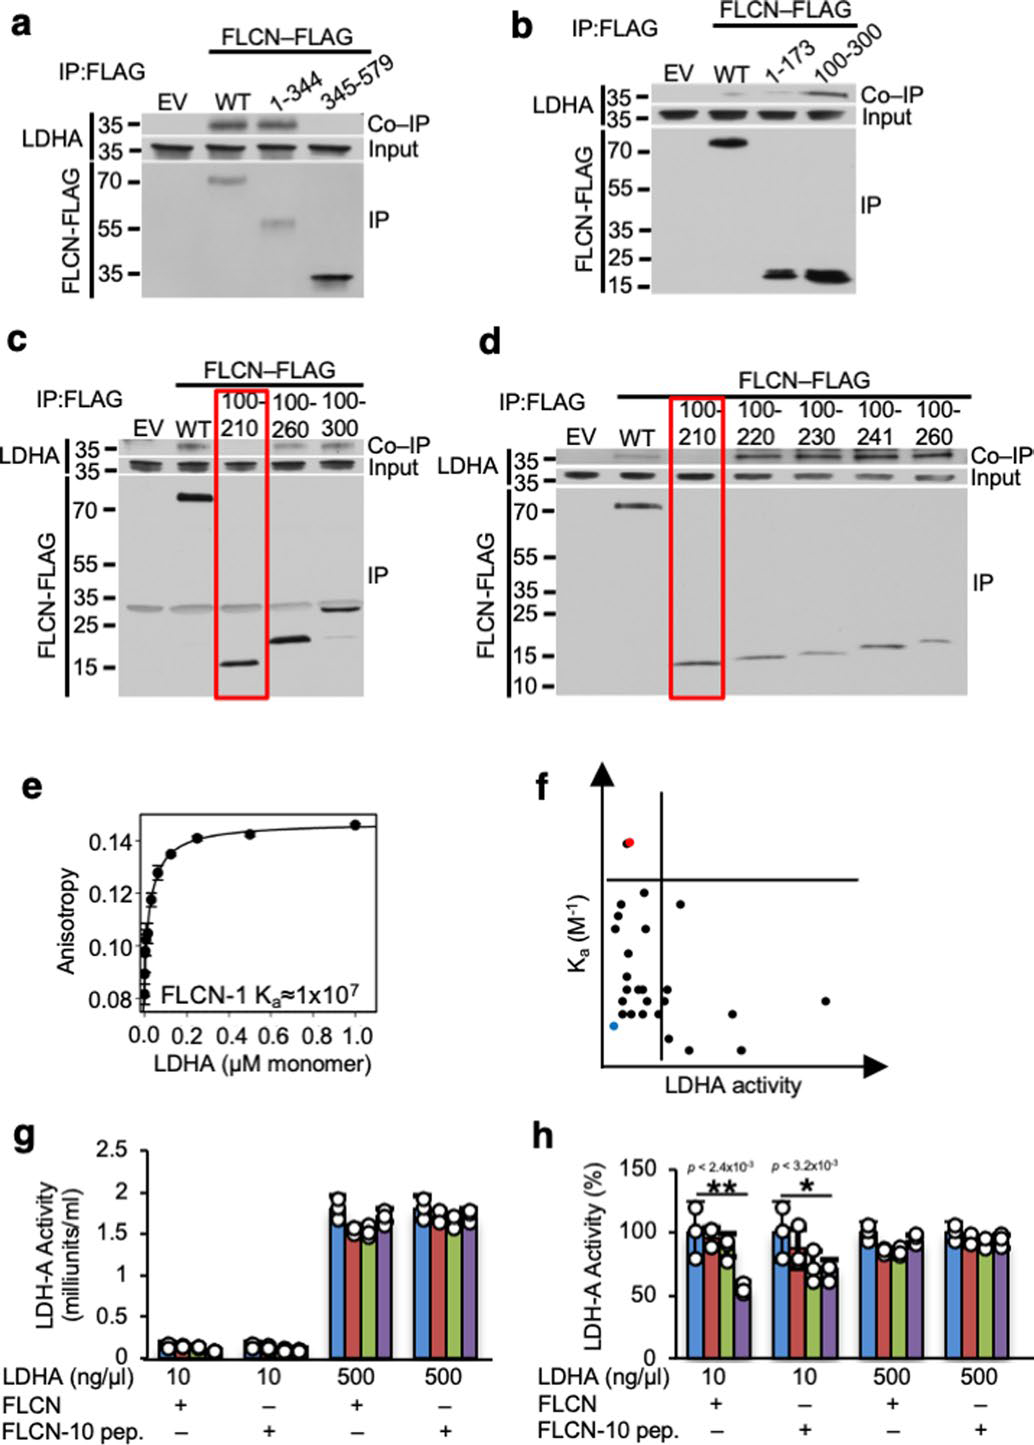
a–d) Immunoprecipitation of transiently expressed short segments of FLCN-FLAG protein implies the critical interacting region with LDHA. e) Ka of LDHA with FLCN-1 peptide (See Fig. 2c), measured by fluorescence polarization anisotropy (n=3). f) Ka plotted against LDHA activity in the presence of peptides. FLCN-1 peptide (blue) and FLCN-10 peptide (red) are highlighted. g) LDHA activity at 10 ng/μl (predominantly dimeric) and 500 ng/μl (predominantly tetrameric) in the presence of increasing amounts of recombinant FLCN protein or FLCN-10 peptide (n=3). Data shown as mean ± s.d. h) Data from Extended Data Fig. 5g presented as percent activity. Unpaired Student’s t-test, n=3. Data shown as mean ± s.d.
Extended Data Fig. 6 |. FLCN-10 peptide uncompetitively inhibits LDHA.
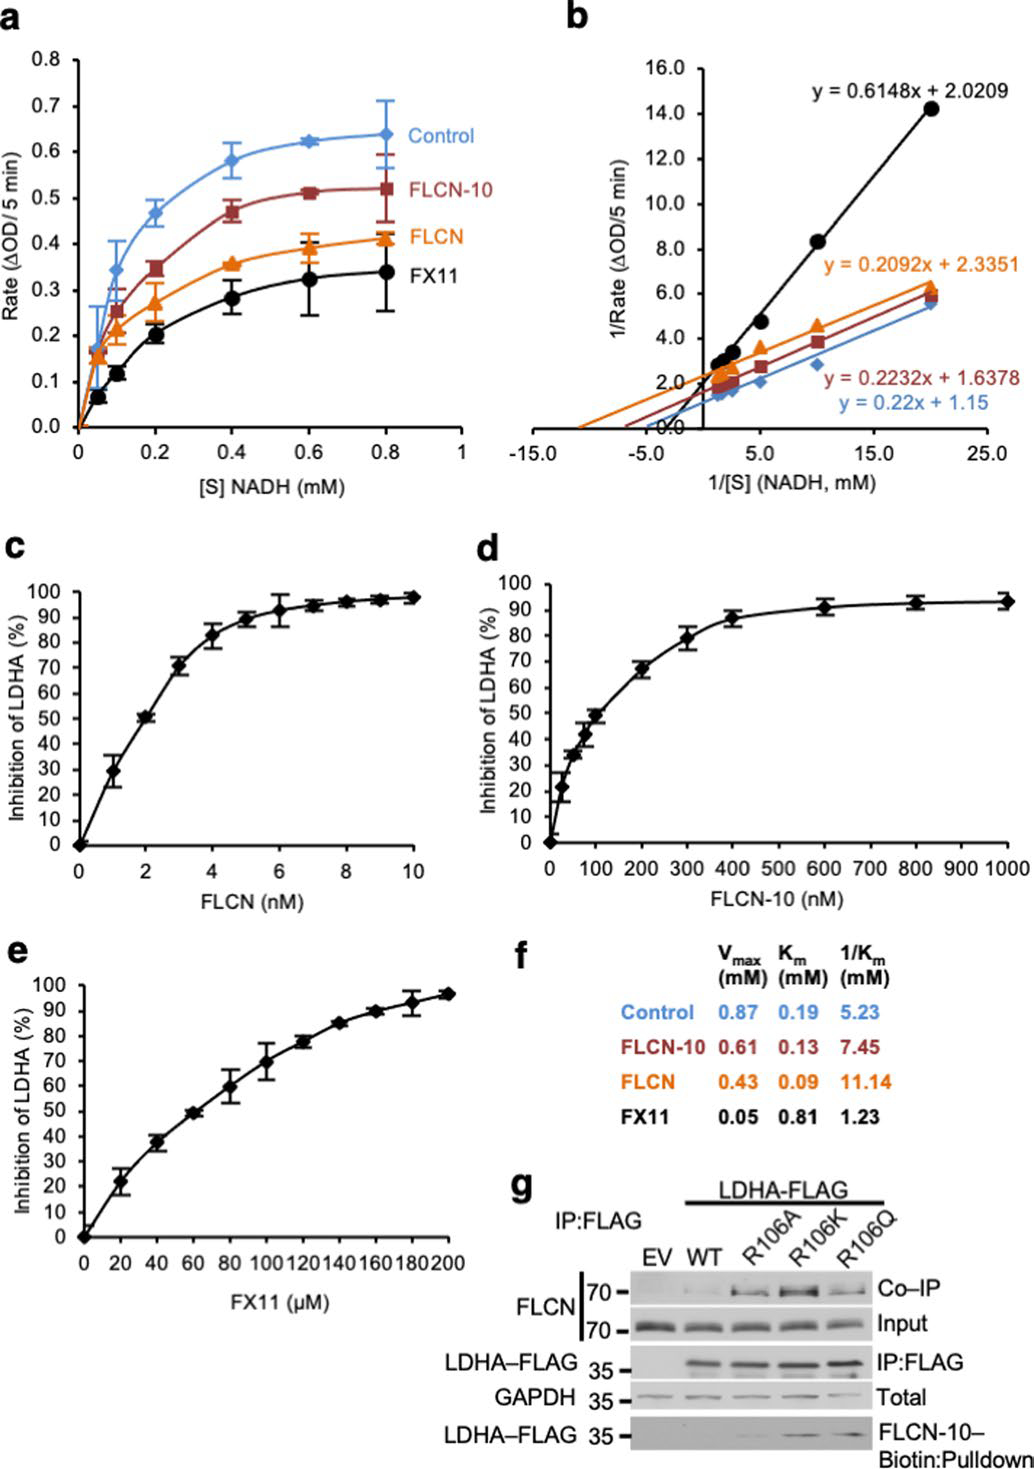
a) Michaelis-Menten kinetics of LDHA in the presence of FLCN protein, FLCN-10 peptide, or FX11 (n=3). Data shown as mean ± s.d. b) FLCN-10 is an uncompetitive inhibitor of LDHA based on Lineweaver-Burke plot (n=3). c–e) IC50 measurements for LDHA in the presence of FLCN protein, FLCN-10 peptide, or FX-11 (n=3). Data shown as mean ± s.d. f) Summary of LDHA enzyme kinetics. g) LDHA-R106-FLAG mutants were transiently transfected and immunoprecipitated from HEK293 cells. FLCN interaction assessed by immunoblotting. Binding to FLCN-10-Biotin peptide was assessed by Streptavidin pulldown.
Extended Data Fig. 7 |. inhibitory function of FLCN toward LDHA and its physiological outcome.
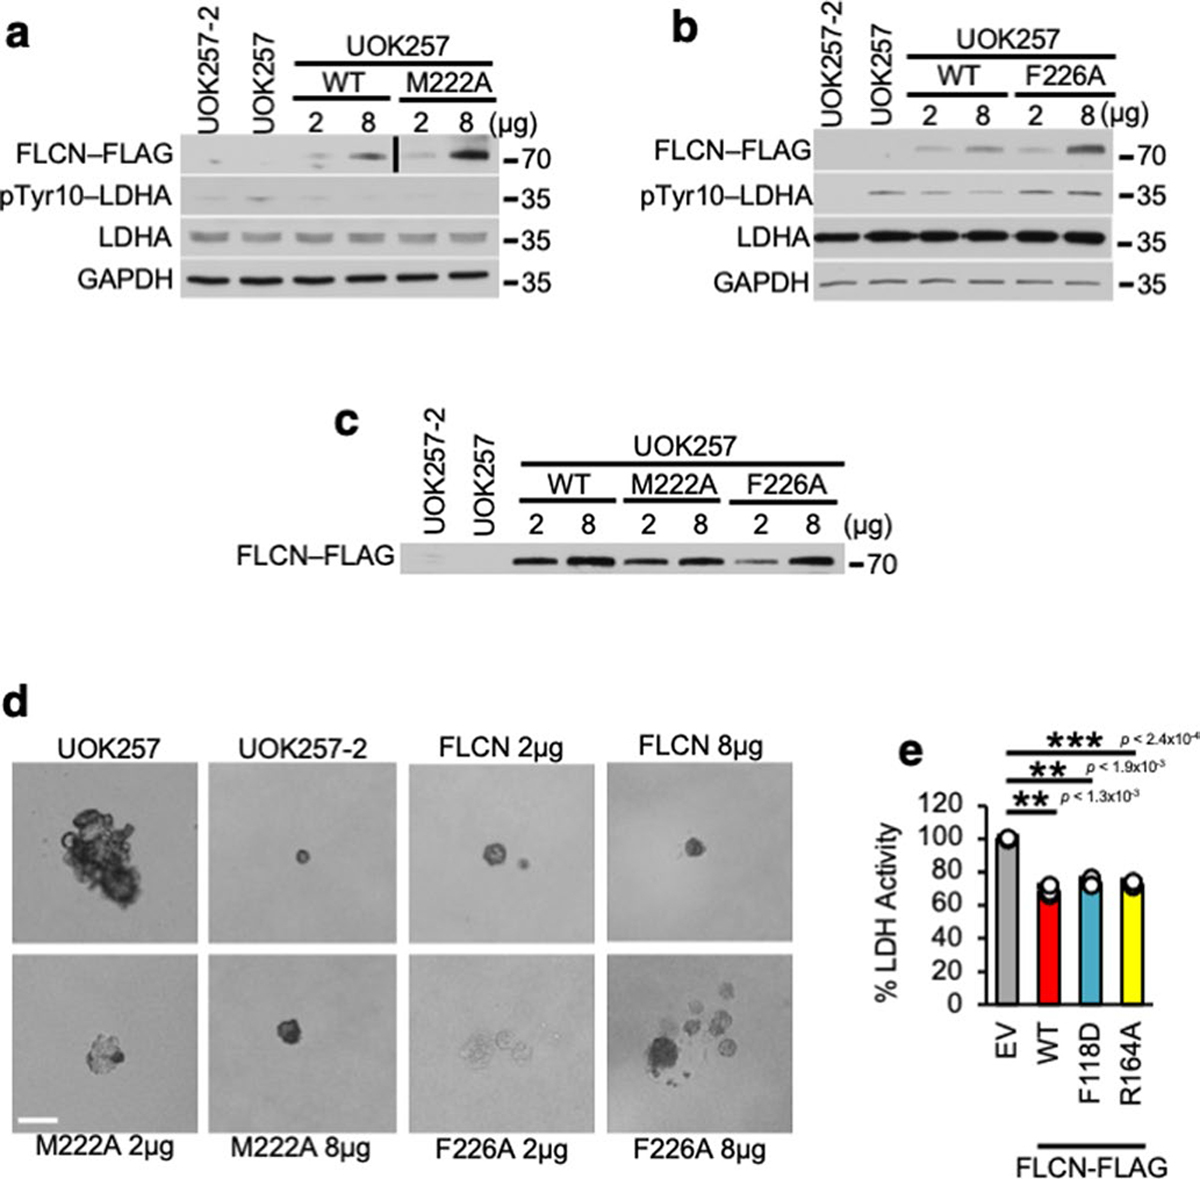
a) Western blot confirming transfection of FLCN-WT-FLAG and FLCN-M222A-FLAG or b) FLCN-WT-FLAG and FLCN-F226A-FLAG in UOK257 cells in Fig. 3d. c) Western blot confirming transfection of FLCN-WT-FLAG, FLCN-M222A-FLAG, or FLCN-F226A-FLAG in Fig. 3f. d) Representative images of UOK257 colonies in soft agar from Fig. 3f. Scale bar = 100 μM. e) LDHA activity in UOK257 cells transfected with EV, WT FLCN, FLCN-F118D-FLAG and FLCN-R164A-FLAG. Unpaired Student’s t-test, n=3. Data shown as mean ± s.d. *P < 0.05, **P < 0.005, ***P < 0.001.
Extended Data Fig. 8 |. FLCN-10 peptide is cell-permeable and inhibits LDHA.
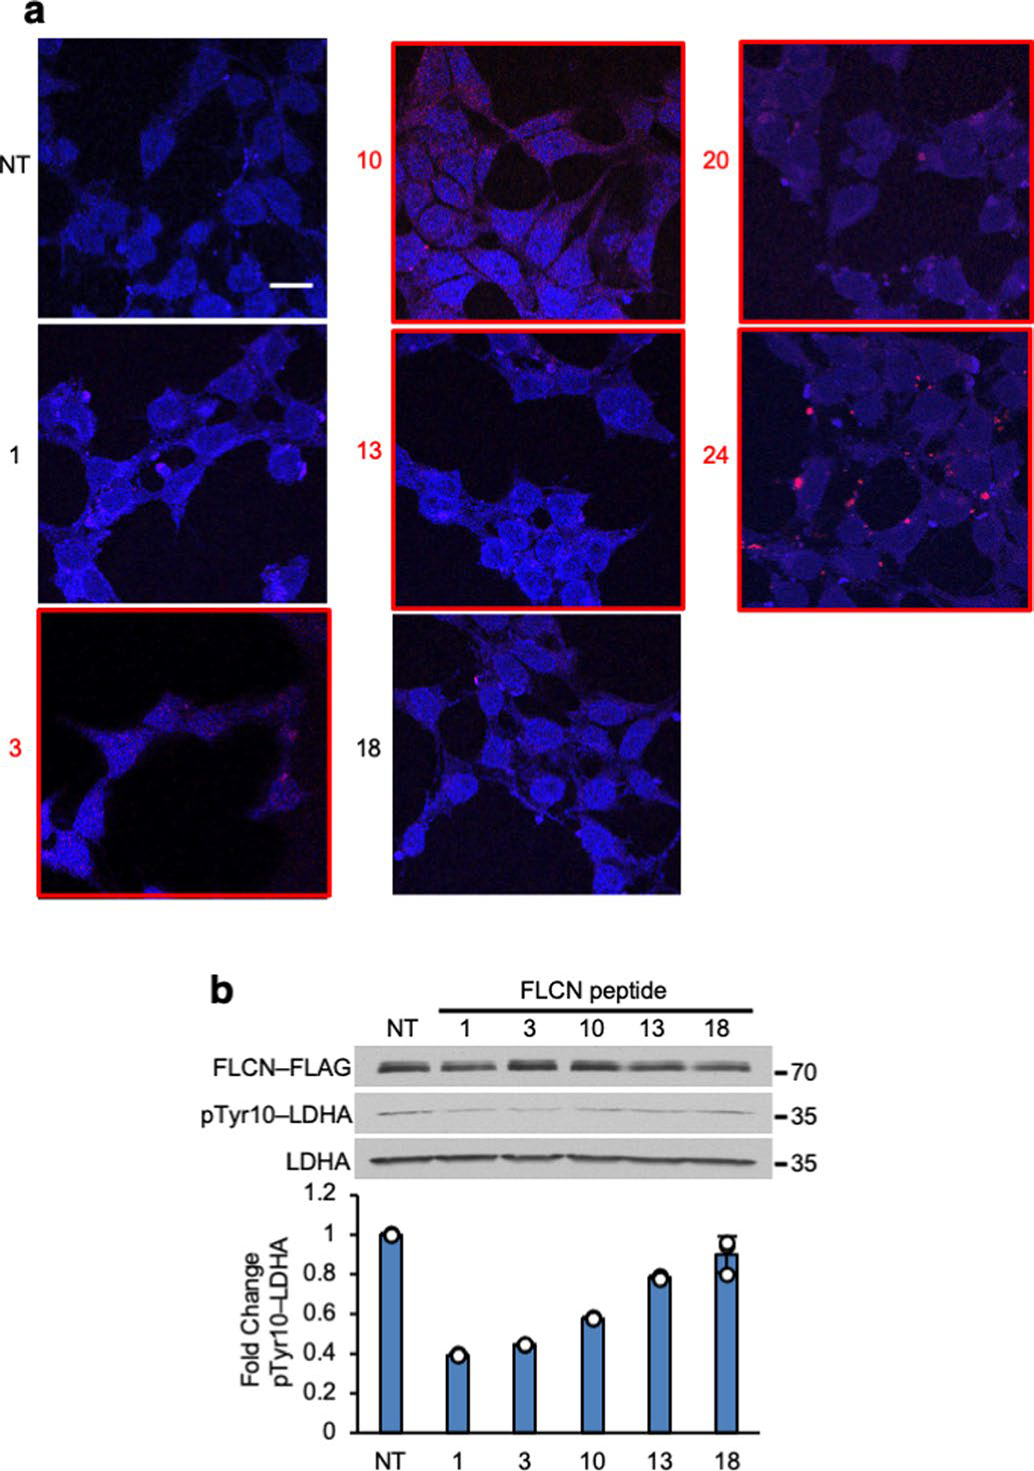
a) Fluorescence microscopy of HEK293 cells treated with 1 μM Rhodamine B-labeled peptides from Fig. 2b. Peptides that are resident after two hours treatment have been denoted with a red number and box. NT = No treatment. Scale bar = 10 μM. b) HEK293 cells treated with peptides from Extended Data Fig. 8a. Bar chart represents fold change of pTyr10-LDHA normalized to NT. Data shown as mean ± s.d. (n=3).
Extended Data Fig. 9 |. FLCN-10 peptide inhibits LDHA activity and induces cell death in ccRCC cell lines.
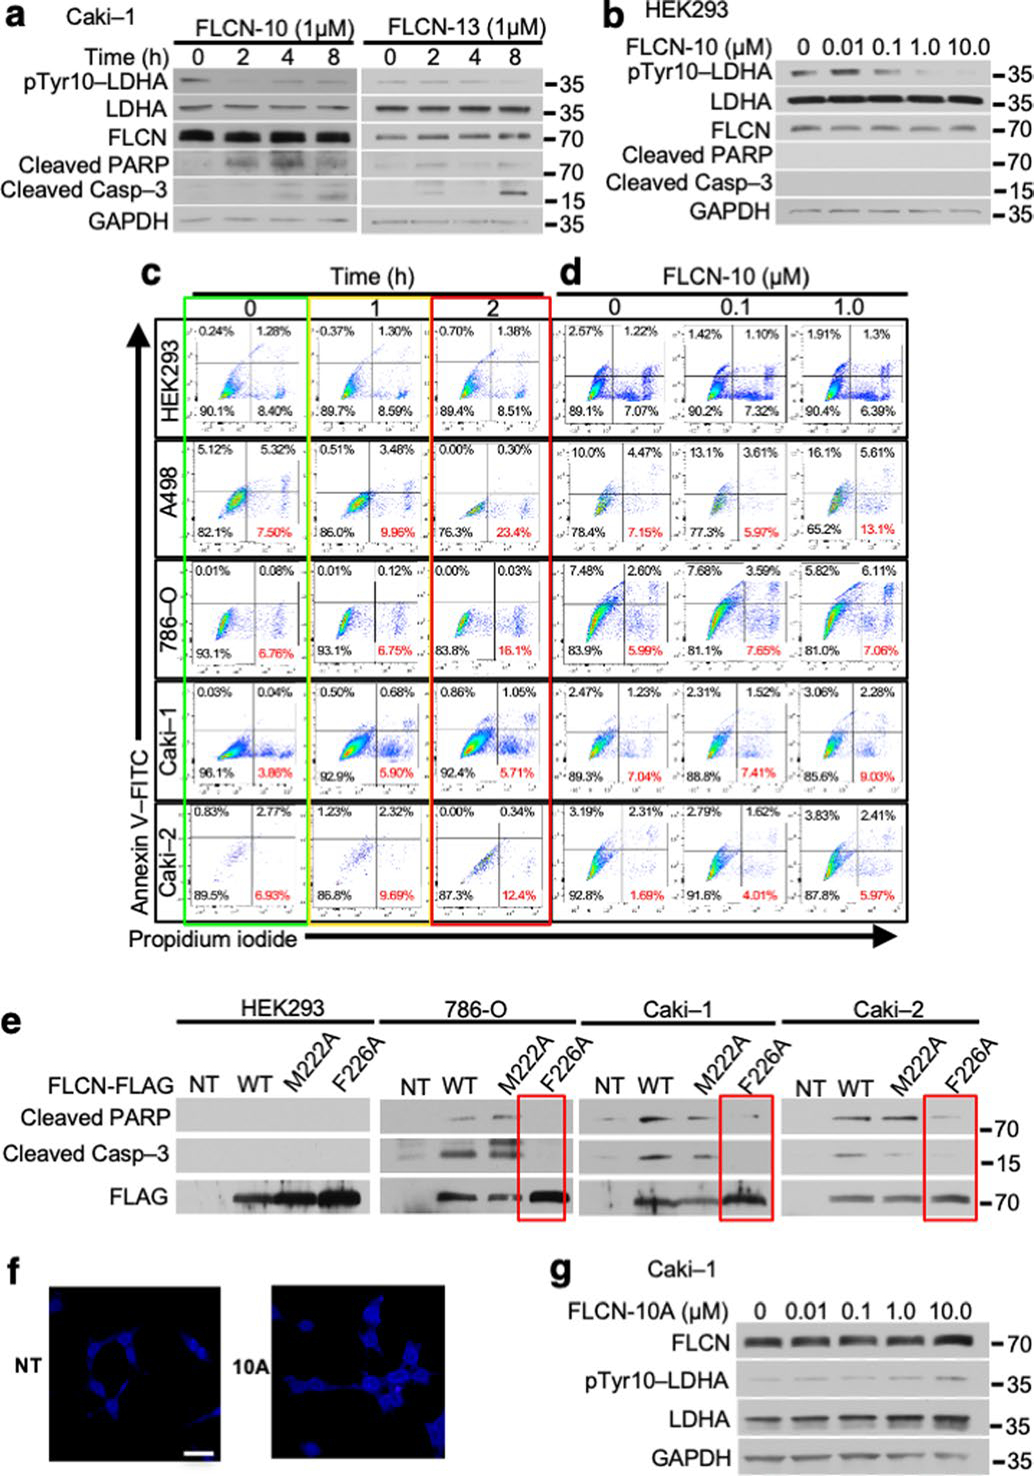
a) Caki-1 cells treated for 2 h with FLCN-10 or FLCN-13 were blotted using anti-cleaved caspase-3 and anti-pTyr10-LDHA. b) LDHA activity in HEK293 cells following 2 h treatment with FLCN-10 peptide. c) d) Flow cytometric assessment of cell death in renal cell lines following 1 μM FLCN-10 for 1 or 2 h (Extended Data Fig. 9c) or 0.1 μM or 1 μM FLCN-10 treatment for 2 h (Extended Data Fig. 9d) as determined by Annexin V/Propidium iodide staining. Representative of three independent experiments. e) Immunoblot of whole cell lysates following overexpression of FLAG-tagged FLCN-WT, FLCN-M222A, or FLCN-F226A in normal HEK293 cells or the ccRCC cell lines 786-O, Caki-1 and Caki-2. f) HEK293 cells were treated with and without 1 μM Rhodamine B-labeled FLCN-10A. Scale bar = 20 μM. g) LDHA activity in Caki-1 cells following 2 h treatment with FLCN-10A peptide.
Extended Data Fig. 10 |. Heterocyclic FLCN-10 peptide induces cell death in ccRCC cells.
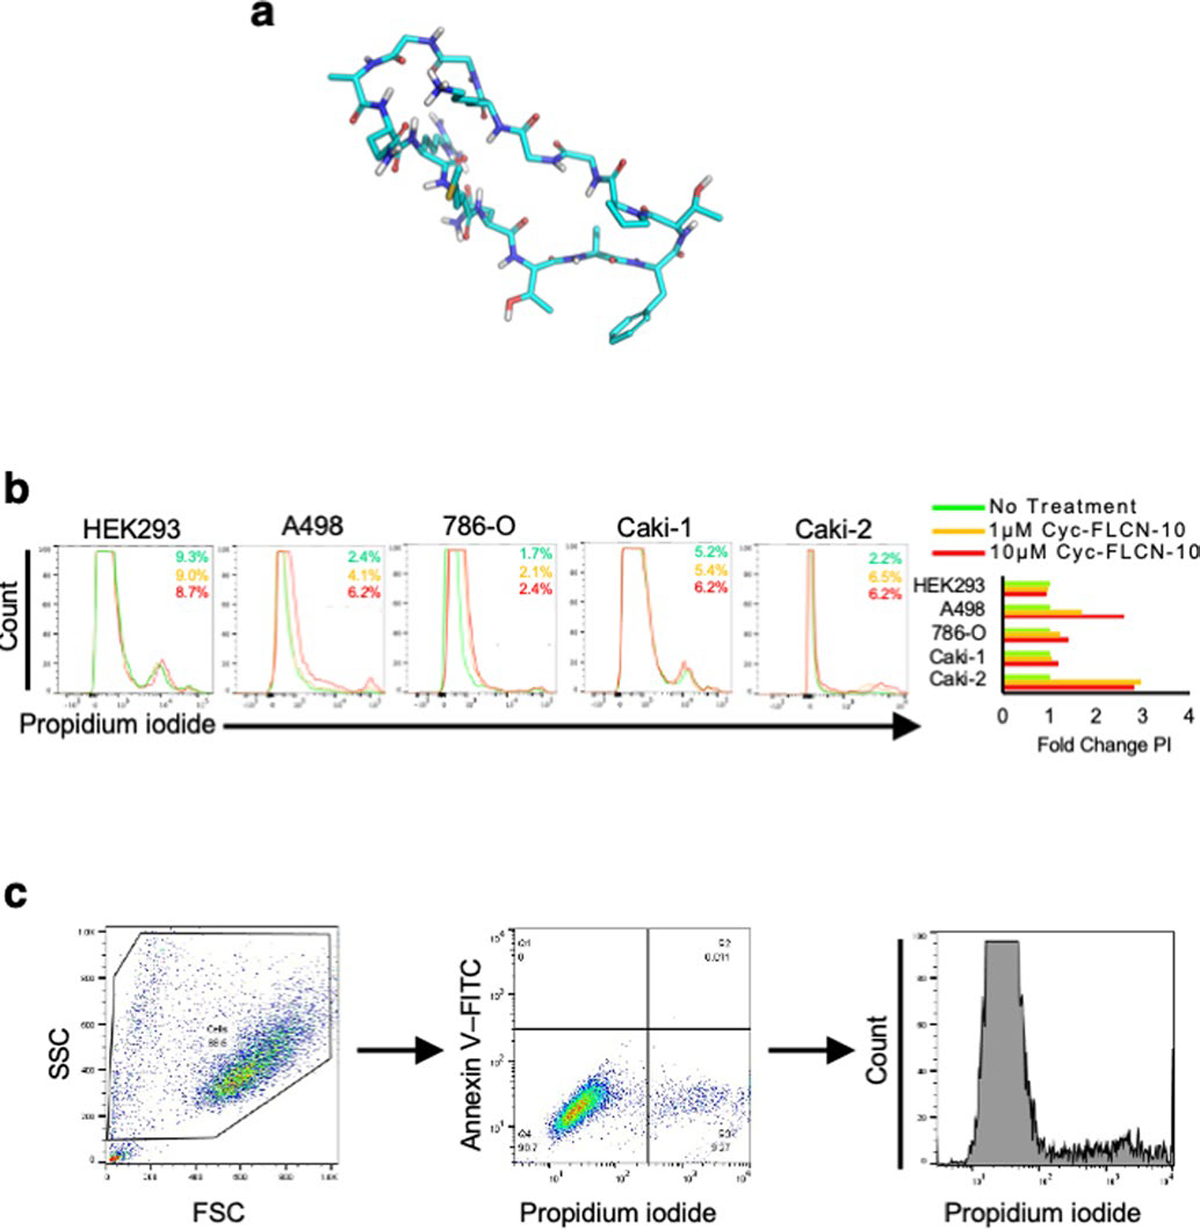
a) Structural representation of head-to-tail cyclic-FLCN-10 peptide, created using MAESTRO (Schrodinger.com). b) Flow cytometric assessment of cell death in renal cell lines following 1 μM or 10 μM cyclic-FLCN-10 treatment as determined by propidium iodide staining. Representative of three independent experiments. c) Representative flow cytometry gating strategy. Cells were first stratified by size, followed by staining intensity with Annexin V-FITC and Propidium Iodide (Extended Data Fig. 9c, d). The PI intensity signal was converted into a histogram for presentation in Fig. 5a and Extended Data Fig. 10b.
Supplementary Material
Acknowledgements
We thank B. A. Knutson, R. A. Oot, S. Wilkens and L. Neckers for assistance and scientific discussions as well as D. E. Post of the Upstate Cancer Center Biorepository. This work was partly supported with federal funds from the Frederick National Laboratory for Cancer Research, National Institutes of Health, under contract no. HHSN26120080001E (L.S.S.) and with funds from SUNY Upstate Medical University, Upstate Cancer Center and the Upstate Foundation (M.M.).
Footnotes
Competing interests
The authors declare no competing interests.
Additional information
Extended data is available for this paper at https://doi.org/10.1038/s41594-021-00633-2.
Supplementary information The online version contains supplementary material available at https://doi.org/10.1038/s41594-021-00633-2.
Peer review information Nature Structural & Molecular Biology thanks Filippo Minutolo and the other, anonymous, reviewer(s) for their contribution to the peer review of this work.
Reprints and permissions information is available at www.nature.com/reprints.
Publisher’s note Springer Nature remains neutral with regard to jurisdictional claims in published maps and institutional affiliations.
References
- 1.Hanahan D & Weinberg RA Hallmarks of cancer: the next generation. Cell 144, 646–674 (2011). [DOI] [PubMed] [Google Scholar]
- 2.Epstein T, Gatenby RA & Brown JS The Warburg effect as an adaptation of cancer cells to rapid fluctuations in energy demand. PLoS ONE 12, e0185085 (2017). [DOI] [PMC free article] [PubMed] [Google Scholar]
- 3.Warburg O, Wind F & Negelein E The metabolism of tumors in the body. J. Gen. Physiol. 8, 519–530 (1927). [DOI] [PMC free article] [PubMed] [Google Scholar]
- 4.Le A et al. Inhibition of lactate dehydrogenase A induces oxidative stress and inhibits tumor progression. Proc. Natl Acad. Sci. USA 107, 2037–2042 (2010). [DOI] [PMC free article] [PubMed] [Google Scholar]
- 5.Fantin VR, St-Pierre J & Leder P Attenuation of LDH-A expression uncovers a link between glycolysis, mitochondrial physiology and tumor maintenance. Cancer Cell 9, 425–434 (2006). [DOI] [PubMed] [Google Scholar]
- 6.Birt AR, Hogg GR & Dubé WJ Hereditary multiple fibrofolliculomas with trichodiscomas and acrochordons. Arch. Dermatol. 113, 1674–1677 (1977). [PubMed] [Google Scholar]
- 7.Schmidt LS & Linehan WM FLCN: the causative gene for Birt–Hogg–Dubé syndrome. Gene 640, 28–42 (2018). [DOI] [PMC free article] [PubMed] [Google Scholar]
- 8.Lawrence RE et al. Structural mechanism of a Rag GTPase activation checkpoint by the lysosomal folliculin complex. Science 366, 971–977 (2019). [DOI] [PMC free article] [PubMed] [Google Scholar]
- 9.Napolitano G et al. A substrate-specific mTORC1 pathway underlies Birt–Hogg–Dubé syndrome. Nature 585, 597–602 (2020). [DOI] [PMC free article] [PubMed] [Google Scholar]
- 10.Preston RS et al. Absence of the Birt–Hogg–Dubé gene product is associated with increased hypoxia-inducible factor transcriptional activity and a loss of metabolic flexibility. Oncogene 30, 1159–1173 (2011). [DOI] [PMC free article] [PubMed] [Google Scholar]
- 11.Yan M et al. The tumor suppressor folliculin regulates AMPK-dependent metabolic transformation. J. Clin. Invest. 124, 2640–2650 (2014). [DOI] [PMC free article] [PubMed] [Google Scholar]
- 12.Tsun ZY et al. The Folliculin tumor suppressor is a GAP for the RagC/D GTPases that signal amino acid levels to mTORC1. Mol. Cell 52, 495–505 (2013). [DOI] [PMC free article] [PubMed] [Google Scholar]
- 13.Petit CS, Roczniak-Ferguson A & Ferguson SM Recruitment of folliculin to lysosomes supports the amino acid-dependent activation of Rag GTPases. J. Cell Biol. 202, 1107–1122 (2013). [DOI] [PMC free article] [PubMed] [Google Scholar]
- 14.Fan J et al. Tyrosine phosphorylation of lactate dehydrogenase A is important for NADH/NAD+ redox homeostasis in cancer cells. Mol. Cell Biol. 31, 4938–4950 (2011). [DOI] [PMC free article] [PubMed] [Google Scholar]
- 15.Jin L et al. Phosphorylation-mediated activation of LDHA promotes cancer cell invasion and tumour metastasis. Oncogene 36, 3797–3806 (2017). [DOI] [PMC free article] [PubMed] [Google Scholar]
- 16.Read JA, Winter VJ, Eszes CM, Sessions RB & Brady RL Structural basis for altered activity of M- and H-isoenzyme forms of human lactate dehydrogenase. Proteins 43, 175–185 (2001). [DOI] [PubMed] [Google Scholar]
- 17.Yamamoto S & Storey KB Dissociation–association of lactate dehydrogenase isozymes: influences on the formation of tetramers versus dimers of M4-LDH and H4-LDH. Int. J. Biochem. 20, 1261–1265 (1988). [DOI] [PubMed] [Google Scholar]
- 18.Zheng Y, Guo S, Guo Z & Wang X Effects of N-terminal deletion mutation on rabbit muscle lactate dehydrogenase. Biochemistry (Mosc.) 69, 401–406 (2004). [DOI] [PubMed] [Google Scholar]
- 19.Unkles SE et al. Physiological and biochemical characterization of AnNitA, the Aspergillus nidulans high-affinity nitrite transporter. Eukaryot. Cell 10, 1724–1732 (2011). [DOI] [PMC free article] [PubMed] [Google Scholar]
- 20.Yamamoto S & Storey KB Dissociation–association of lactate dehydrogenase isozymes: influences on the formation of tetramers versus dimers of M4-LDH and H4-LDH. Int. J. Biochem. 20, 1261–1265 (1988). [DOI] [PubMed] [Google Scholar]
- 21.Valvona CJ, Fillmore HL, Nunn PB & Pilkington GJ The regulation and function of lactate dehydrogenase A: therapeutic potential in brain tumor. Brain Pathol. 26, 3–17 (2016). [DOI] [PMC free article] [PubMed] [Google Scholar]
- 22.Tarmy EM & Kaplan NO Kinetics of Escherichia coli B D-lactate dehydrogenase and evidence for pyruvate-controlled change in conformation. J. Biol. Chem. 243, 2587–2596 (1968). [PubMed] [Google Scholar]
- 23.Jiang GR, Nikolova S & Clark DP Regulation of the ldhA gene, encoding the fermentative lactate dehydrogenase of Escherichia coli. Microbiology 147, 2437–2446 (2001). [DOI] [PubMed] [Google Scholar]
- 24.Yamamoto S & Storey KB Influence of glycerol on the activity and tetramer–dimer state of lactate dehydrogenase isozymes. Int. J. Biochem. 20, 1267–1271 (1988). [DOI] [PubMed] [Google Scholar]
- 25.Boháčová V, Dočolomanský P, Breier A, Gemeiner P & Ziegelhöffer A Interaction of lactate dehydrogenase with anthraquinone dyes: characterization of ligands for dye–ligand chromatography. J. Chromatogr. B Biomed. Sci. Appl. 715, 273–281 (1998). [DOI] [PubMed] [Google Scholar]
- 26.Cahn RD, Zwilling E, Kaplan NO & Levine L Nature and development of lactic dehydrogenases: the two major types of this enzyme form molecular hybrids which change in makeup during development. Science 136, 962–969 (1962). [DOI] [PubMed] [Google Scholar]
- 27.Shen K et al. Cryo-EM structure of the human FLCN-FNIP2–Rag–Ragulator complex. Cell 179, 1319–1329 (2019). [DOI] [PMC free article] [PubMed] [Google Scholar]
- 28.Schopper S et al. Measuring protein structural changes on a proteome-wide scale using limited proteolysis-coupled mass spectrometry. Nat. Protoc. 12, 2391–2410 (2017). [DOI] [PubMed] [Google Scholar]
- 29.Woodford MR, Chen VZ, Backe SJ, Bratslavsky G & Mollapour M Structural and functional regulation of lactate dehydrogenase-A in cancer. Future Med. Chem. 12, 439–455 (2020). [DOI] [PubMed] [Google Scholar]
- 30.el Hawrani AS, Moreton KM, Sessions RB, Clarke AR & Holbrook JJ Engineering surface loops of proteins—a preferred strategy for obtaining new enzyme function. Trends Biotechnol. 12, 207–211 (1994). [DOI] [PubMed] [Google Scholar]
- 31.Clarke AR et al. Site-directed mutagenesis reveals role of mobile arginine residue in lactate dehydrogenase catalysis. Nature 324, 699–702 (1986). [DOI] [PubMed] [Google Scholar]
- 32.Nookala RK et al. Crystal structure of folliculin reveals a hidDENN function in genetically inherited renal cancer. Open Biol. 2, 120071 (2012). [DOI] [PMC free article] [PubMed] [Google Scholar]
- 33.Nickerson ML et al. Mutations in a novel gene lead to kidney tumors, lung wall defects, and benign tumors of the hair follicle in patients with the Birt–Hogg–Dubé syndrome. Cancer Cell 2, 157–164 (2002). [DOI] [PubMed] [Google Scholar]
- 34.Yang Y et al. The UOK 257 cell line: a novel model for studies of the human Birt–Hogg–Dubé gene pathway. Cancer Genet. Cytogenet. 180, 100–109 (2008). [DOI] [PMC free article] [PubMed] [Google Scholar]
- 35.Linehan WM et al. The metabolic basis of kidney cancer. Cancer Discov. 9, 1006–1021 (2019). [DOI] [PubMed] [Google Scholar]
- 36.Rai G et al. Pyrazole-based lactate dehydrogenase inhibitors with optimized cell activity and pharmacokinetic properties. J. Med. Chem. 63, 10984–11011 (2020). [DOI] [PMC free article] [PubMed] [Google Scholar]
- 37.Paladino A et al. Chemical perturbation of oncogenic protein folding: from the prediction of locally unstable structures to the design of disruptors of Hsp90-client interactions. Chemistry 26, 9459–9465 (2020). [DOI] [PMC free article] [PubMed] [Google Scholar]
- 38.Fosgerau K & Hoffmann T Peptide therapeutics: current status and future directions. Drug Discov. Today 20, 122–128 (2015). [DOI] [PubMed] [Google Scholar]
- 39.da Silva NF et al. Analysis of the Birt–Hogg–Dubé (BHD) tumour suppressor gene in sporadic renal cell carcinoma and colorectal cancer. J. Med. Genet. 40, 820–824 (2003). [DOI] [PMC free article] [PubMed] [Google Scholar]
- 40.Khoo SK et al. Inactivation of BHD in sporadic renal tumors. Cancer Res. 63, 4583–4587 (2003). [PubMed] [Google Scholar]
- 41.Kahnoski K et al. Alterations of the Birt–Hogg–Dubé gene (BHD) in sporadic colorectal tumours. J. Med. Genet. 40, 511–515 (2003). [DOI] [PMC free article] [PubMed] [Google Scholar]
- 42.Nagy A, Zoubakov D, Stupar Z & Kovacs G Lack of mutation of the folliculin gene in sporadic chromophobe renal cell carcinoma and renal oncocytoma. Int. J. Cancer 109, 472–475 (2004). [DOI] [PubMed] [Google Scholar]
- 43.Gad S et al. Mutations in BHD and TP53 genes, but not in HNF1β gene, in a large series of sporadic chromophobe renal cell carcinoma. Br. J. Cancer 96, 336–340 (2007). [DOI] [PMC free article] [PubMed] [Google Scholar]
- 44.Rai G et al. Discovery and optimization of potent, cell-active pyrazole-based inhibitors of lactate dehydrogenase (LDH). J. Med. Chem. 60, 9184–9204 (2017). [DOI] [PMC free article] [PubMed] [Google Scholar]
- 45.Wang Y et al. Fascin inhibitor increases intratumoral dendritic cell activation and anti-cancer immunity. Cell Rep. 35, 108948 (2021). [DOI] [PMC free article] [PubMed] [Google Scholar]
- 46.Cox J & Mann M MaxQuant enables high peptide identification rates, individualized p.p.b.-range mass accuracies and proteome-wide protein quantification. Nat. Biotechnol. 26, 1367–1372 (2008). [DOI] [PubMed] [Google Scholar]
- 47.Woodford MR et al. The FNIP co-chaperones decelerate the Hsp90 chaperone cycle and enhance drug binding. Nat. Commun. 7, 12037 (2016). [DOI] [PMC free article] [PubMed] [Google Scholar]
- 48.Gay RJ, McComb RB & Bowers GN Jr Optimum reaction conditions for human lactate dehydrogenase isoenzymes as they affect total lactate dehydrogenase activity. Clin. Chem. 14, 740–753 (1968). [PubMed] [Google Scholar]
- 49.Powers JL, Kiesman NE, Tran CM, Brown JH & Bevilacqua VLH Lactate dehydrogenase kinetics and inhibition using a microplate reader. Biochem. Mol. Biol. Educ. 35, 287–292 (2007). [DOI] [PubMed] [Google Scholar]
- 50.Cer RZ, Mudunuri U, Stephens R & Lebeda FJ IC50-to-Ki: a web-based tool for converting IC50 to Ki values for inhibitors of enzyme activity and ligand binding. Nucleic Acids Res. 37, W441–W445 (2009). [DOI] [PMC free article] [PubMed] [Google Scholar]
- 51.Vizcaino JA et al. 2016 update of the PRIDE database and its related tools. Nucleic Acids Res. 44, D447–D456 (2016). [DOI] [PMC free article] [PubMed] [Google Scholar]
Associated Data
This section collects any data citations, data availability statements, or supplementary materials included in this article.
Supplementary Materials
Data Availability Statement
The MS proteomics data have been deposited to the ProteomeXchange Consortium via the PRIDE51 partner repository with the dataset identifier PXD018410 (www.ebi.ac.uk/pride/). Source data are provided with this paper.


