Abstract
Although Cryo-electron microscopy (cryo-EM) has been successfully used to derive atomic structures for many proteins, it is still challenging to derive atomic structure when the resolution of cryo-EM density maps is in the medium range, e.g., 5-10 Å. Studies have attempted to utilize machine learning methods, especially deep neural networks to build predictive models for the detection of protein secondary structures from cryo-EM images, which ultimately helps to derive the atomic structure of proteins. However, the large variation in data quality makes it challenging to train a deep neural network with high prediction accuracy. Curriculum learning has been shown as an effective learning paradigm in machine learning. In this paper, we present a study using curriculum learning as a more effective way to utilize cryo-EM density maps with varying quality. We investigated three distinct training curricula that differ in whether/how images used for training in past are reused while the network was continually trained using new images. A total of 1,382 3-dimensional cryo-EM images were extracted from density maps of Electron Microscopy Data Bank in our study. Our results indicate learning with curriculum significantly improves the performance of the final trained network when the forgetting problem is properly addressed.
Keywords: Deep learning, curriculum, pattern recognition, protein structure, cryo-electron microscopy, image, secondary structure
1. INTRODUCTION
A cryo-electron microscopy (cryo-EM) density map is a 3-dimenisonal (3D) molecular image. For density maps of a medium resolution, such as 5-10 Å, it is hard to distinguish details of molecular features. However, it has been demonstrated that it is possible to detect the location of secondary structures of proteins from such 3D images through pattern recognition [1-8]. For example, a helix with longer than three turns often appears as a cylinder, and a β-sheet between 3 and 7 strands often appear as a twisted layer of density. The location of protein secondary structures in the cryo-EM density map provides important constraints for deriving the atomic structure. When secondary structure location in the density map is combined with the protein sequence, it is possible to derive the overall topology of the secondary structure elements and subsequently, the backbone of the protein [9-11].
Recent effort using machine learning, especially deep learning approaches in detection of protein secondary structures has seen both potential and limitations [5, 12, 13]. Li et al. proposed the first Convolutional Neural Network (CNN) with inception and residual learning [12] that was predominately tested in simulated 3D density images.
Subramaniya et al. used a U-net architecture with an additional phase of processing in training of cryo-EM density maps [14]. In spite of the potential of deep learning approaches in the secondary structure detection problem, the complexity of the image data limits the success of training. Yet another bottleneck is the varying quality of density maps at medium resolutions [15]. As such, an effective learning method is needed to fully utilize the density data.
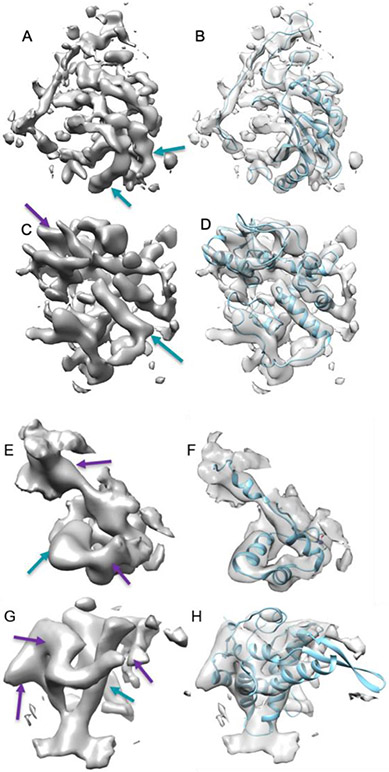
As of June 10, 2020, the Electron Microscopy Data Bank (EMDB) archives 891 entries of medium-resolution cryo-EM density maps that have corresponding atomic models. Most of the entries contain multiple unique chains, as cryo-EM is particularly effective in imaging large molecular complexes. Although this resource makes it possible to conduct deep learning studies, the complexity of the data makes it challenging to learn accurately. First, secondary structures – and in particular, β-sheets – do not have uniform patterns, since it is often affected by various local factors. Due to experimental and/or computational conditions, certain portions of a secondary structure may be missing, mis-aligned, or hard to be distinguished from surrounding structures. For example, some helix regions (arrows in Figure 1 (A)) appear as approximate cylinders, but other helix regions (purple arrows in Figure 1 (E, G)) do not follow the cylindrical shape that is expected in the atomic structure of a helix. In order to quantify the quality of the density maps, we previously developed a quick measure for the similarity between 3D images and their corresponding atomic structures at helix regions [16]. Using this measure, we observed various levels of disagreement (large variation) in the quality of the images. Presumably, it would be more difficult to train a neural network that is generalizable for the detection of protein secondary structures by using low-quality images as training examples rather than high-quality images.
Figure 1. Four samples of cryo-EM density maps at specific chain regions with different quality.
The surface representation of a cryo-EM density map at a specific chain region (left column) and its atomic model (right column, blue ribbon) is shown for each sample. (A, B) High-quality bin: EMD-4041, chain C of 5LDX (PDB ID); (C, D) Medium-high quality bin: EMD-1657, chain AD of 4V5H (PDB ID); (E, F) Low-quality bin: EMD-8737, chain J of 5VVS (PDB ID); (G, H) Poor-quality bin: EMD-5327, chain T of 3JO0 (PDB ID). Blue arrows (better) and purple arrows point to density regions of helices with varying quality of the map.
Given the large heterogeneity in the data, we explore curriculum learning in the training of deep neural network, specially a variant of U-net [17] for the detection of protein secondary structures from the medium resolution Cryo-EM images. Curriculum learning is a learning paradigm that has long been used in human learning of complicated tasks. It is analogous to when a teacher uses a curriculum beginning with an easy example followed by increases in difficulty of the task at hand to teach students a complicated procedure [18]. Such a training strategy has recently been employed to train deep neural networks with varying architectures for various prediction tasks, such as medical image segmentation [19], speech recognition [20] and short computer program evaluation [21].
Besides the most straightforward strategy where the network was trained continuously with examples of increasing difficulty, we developed and studied two other strategies, aiming to address the forgetting problem in the continual learning process. One is similar to the strategy used in [22], in which the training set starts with only easy cases, then is expanded to include all examples in two separate steps, first moderately difficult cases followed by difficult cases. The second is implemented using gradient Episodic Memory (GEM) method recently proposed for continual learning [23]. In this strategy, to avoid forgetfulness we make sure each update does not harm the performance of the learning algorithm on already learned examples while learning from those with increased difficulty. We report, in this paper, the design of the training curricula and results obtained using a dataset consisting of a total 1,382 cryo-EM density images to evaluate all the training strategies. Our results show that comparing to the baseline where the network was trained in the standard way (i.e., with no curriculum being involved), networks trained with curriculum have better performance when the issue of forgetfulness is effectively addressed. Our study is the first successful attempt to utilize a fast estimation of cryo-EM image quality for enhanced protein secondary structure detection via curriculum learning.
2. METHOD
2.1. Data
The data set contains 1382 pairs of data, each consisting of an atomic model and its corresponding regions of cryo-EM density map at 5-10 Å resolution. Atomic models were downloaded from Protein Data Bank (PDB), and cryo-EM density maps were downloaded from EMDB. Since most entries of cryo-EM density maps contain multiple copies of the same protein chains, we eliminated repetitive chains in the data set and isolated cryo-EM density map regions corresponding to unique chains. The quality of cryo-EM images was evaluated using our previously developed program based on the similarity between the image and the atomic structure at a helix region [24]. The 1382 images were divided into three bins, using the quality score – high-quality bin, medium-high-quality bin, and low-quality bin (Table 1). Since each chain contains multiple helices, the quality score of each chain is an average score of all helices of the chain weighted by the length of each helix. A chain is assigned to a specific quality bin based on the similarity score of the chain and the average difference between the precision and recall of all helices in the chain.
Table 1 – The division of cryo-EM image data into three bins of different quality.
HighBin: High-quality bin, MHighBin: Medium-high-quality bin, LowBin: Low-quality bin.
| CL | Overall | HighBin | MHighBin | LowBin |
|---|---|---|---|---|
| Training | 1216 | 200 | 569 | 447 |
| Validation | 101 | 30 | 30 | 41 |
| Testing | 65 | 10 | 30 | 25 |
2.2. Training curricula
We divided the training process into three consecutive phases, Phase 1 to Phase 3, in order to send data of different quality using a curriculum. At each training stage, we trained the network until there was no improvement in its performance (as evaluated by the validation loss) calculated on a separate dataset that is independent from the training set. We investigated three learning curricula that differs in whether/how examples in the early training phase are used in the later phase. At all phases, we trained the network using stochastic gradient descent with mini-batch.
NoRevisit: Curriculum without revisit (CL-NoRevisit)
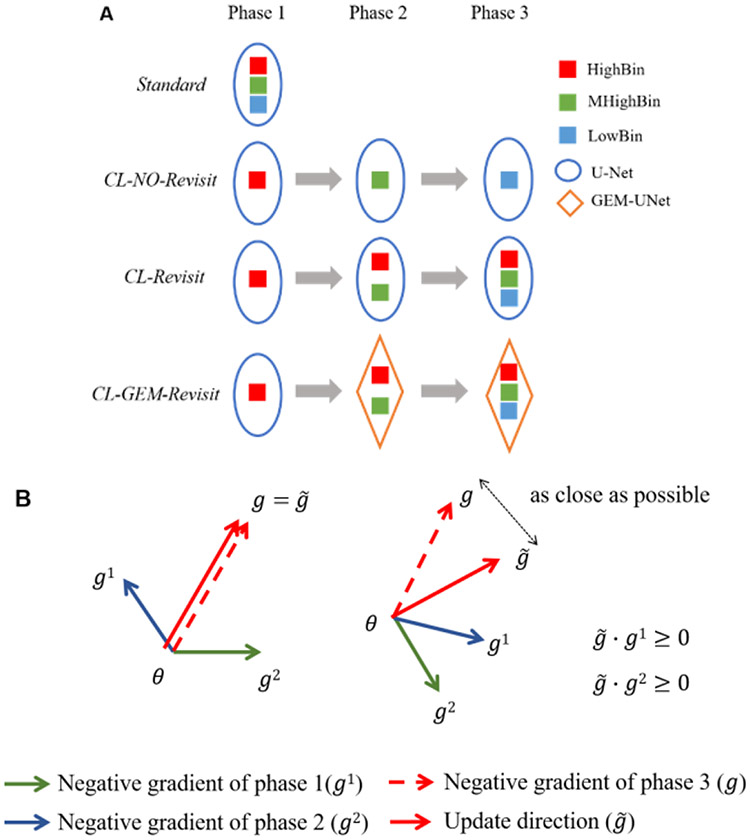
The first studied curriculum is the most basic, in which the network was trained by simply showing examples from the three bins consecutively (Figure 2 (A)). More precisely, the network was trained using examples from high-quality bin at Phase1, followed by medium-high-quality bin at Phase2 and lastly low-quality bin at Phase3. It is obvious that with this curriculum examples used at the early training phase were not revisited at subsequent phases. Though this curriculum lends itself to fast learning, since no revisiting previous examples while learning from new cases, the network may experience forgetfulness (i.e., forgetting what has been learned from early cases), a phenomenon commonly appearing and addressed in transfer learning [25] as well as continual learning [23].
Figure 2.
Training curricula (A) and the gradient control in GEM (B).
SimRevisit: Curriculum with simple revisit (CL-Revisit)
To combat the likely forgetting in the network trained by above curriculum, i.e., NoRevisit, we developed a curriculum similar to the one used in [22]. Under this curriculum (Figure 2(A)), the network was still trained with only examples from high quality bin at Phase1 as in NoRevisit. However, at Phase2 examples from both high-quality bin and medium-high-quality bin were used and examples from all three bins were used at the subsequent Phase3. Note that here all examples included in the training set at each training phase were equality weighted, i.e., with equal chance to be picked in a mini-batch for training. In other words, we did not treat the examples differently according to whether they were newly added or have been used already at previous phases.
GEMRevisit: Curriculum with revisit via gradient of episodic memory (CL-GEM-Revisit)
To better address the forgetting problem and potentially improve the performance of the trained network further, we implemented a third curriculum by leveraging a technique recently proposed for avoiding forgetting in the setting of continual learning. This technique is referred as gradient of episodic memory (GEM) first proposed by Lopez-Paz et al. [23]. The main idea of this method is to maintain a subset of previously learned examples as a “memory” while training a learning agent (in our case a neural network) on new examples. During each update in the optimization using stochastic gradient descent (Figure 2 (B)), the gradient, denoted by g, was first computed over the chosen mini-batch of new examples. Then, the closest projection of g, represented by , was obtained by solving a quadratic problem (note the uniqueness of the solution is obtained by requiring that has an acute angle with the gradient associated with the examples in the memory). Please refer to the original paper for the formulation of the quadratic problem and the algorithm to solve it. Subsequently, was used to update the weights in the network. Because has acute angle with that from previous examples, any update made to the network is guaranteed to do no harm to the network's performance for past examples (or at least for those stored in the memory). In our study, the training set is relatively small. Hence, the limit in the memory capacity commonly seen in continual learning is less of a concern in our case. Here, our primary goal is to obtain a network that has the best prediction accuracy. Therefore, we implemented the GEM in a slightly different way than that in the original paper [23]. Specially, at each later training phase, all examples in earlier phases were hold in the memory. For each update in a gradient step, we randomly selected five of past examples to use in finding the closest projection of gradient from new examples. In particular, we used examples from high-quality bin, medium-high-quality bin and low-quality bin as new training cases, respectively at Phase1-3 in a sequence. Examples from high-quality bin were used as past training cases at Phase2; and examples from both high-quality bin and medium-high-quality bin were used as past cases at Phase3. There was no past case involved at Phase1.
2.3. Network architecture and implementation
Networks with a same architecture were used in all our experiments, for all three curriculum learning strategies and a baseline without any curriculum being involved (see Results section). This architecture consisting of total five blocks of layers was adapted from the 3D U-Net, including a down-sampling path and an up-sampling path. In all settings, we trained the network to optimize an objective that is a combination of weighted cross-entropy E, and dice coefficient, D (1).
| (1) |
where λd is a hyper-parameter, and represent the true and predicted labels, respectively, of training examples.
We implemented and trained the network using PyTorch, a popular machine learning library in deep learning research. To train the network, we partitioned the entire dataset of a total 1,382 cryo-EM images into three disjoint subsets for training, validation and testing, respectively. Each subset maintains roughly the same distribution of the three quality bins (discussed in section 2.1) as in the entire dataset. The detailed distribution of the examples across the three subsets as well as the three bins is provided in Table 1. Adam optimizer [26] was used to optimize the weights in the network with weight decay. We set the initial learning rate to 0.001 and used grid search for optimizing the step parameter in weight decay. The dropout rate was also optimized using grid search. The representation capacity of the network is expected to increase while the training moves along the phases. Hence, at each training phase after phase 1 we only tested dropout rate that is no more than the optimal one found at the previous phase. The specification of other hyper-parameters are as follows: λδ = 0.3, λu = 0.7, λd = 0.3, and batch size: 1. The optimal setting of all hyper-parameters in the search was determined based on the validation set. All networks were trained until there was no improvement that can be seen on the validation set.
3. Results
3.1. Pattern recognition of helices and β-sheets using three curriculum training methods
To demonstrate any potential advantage of training with curriculum, the exact same architecture was used without curriculum (Standard) as a comparison baseline. During this training, hyper-parameters were searched and set similarly as in training with curriculum as described in section 2.5. The best performing model obtained with each training method was used to compare (Table 2).
Table 2 –
Performance of four training methods for detection of helices and β-sheets.
| F1 Helix |
F1 Sheet |
|
|---|---|---|
| Standard | 0.553 | 0.425 |
| CL-Revisit | 0.571 | 0.437 |
| CL-GEM-Revisit | 0.560 | 0.450 |
| CL_NO_Revisit | 0.546 | 0.396 |
The F1 score is a commonly used performance indicator that considers precision and recall. We calculated the F1 score of detected helix voxels and β-sheet voxels. Using the curriculum in training enhances F1 score for both helix and β-sheet detection (Table 2). Two methods using curricula, CL-Revisit and CL-GEM-Revisit, have F1 score of 0.571 and 0.560 respectively for detection of helix voxels, which are higher than the standard training method of 0.553 (Table 2). Improvement is also shown for the detection of β-sheet voxels, with F1 score of 0.437 and 0.450 for using curriculum, as oppose to 0.425 without using curriculum. Also, note that when the forgetting phenomenon is not effectively addressed (CL-NoRevisit), the performance of the network trained with curriculum is in fact worse than that using standard training without a curriculum (Table 2).
GEM was implemented in CL-GEM-Revisit training [23]. In comparison with CL-Revisit, we observed that using GEM has overall more accurate performance. Although the F1 score of CL-GEM-Revisit is slightly lower than that of CL-Revisit for helix detection, it has better detection of β-sheets (Table 2). Using GEM, gradient updates are controlled to limit the “forgetting problem” (details in 3.3). In particular, a small number of random samples from the previous phase were used in calculating gradient update. For example, five random gradients of phase 1 were used to estimate each gradient update in phase 2. This process results in more computation but with slightly better accuracy.
3.2. Visualization of detected secondary structures of proteins
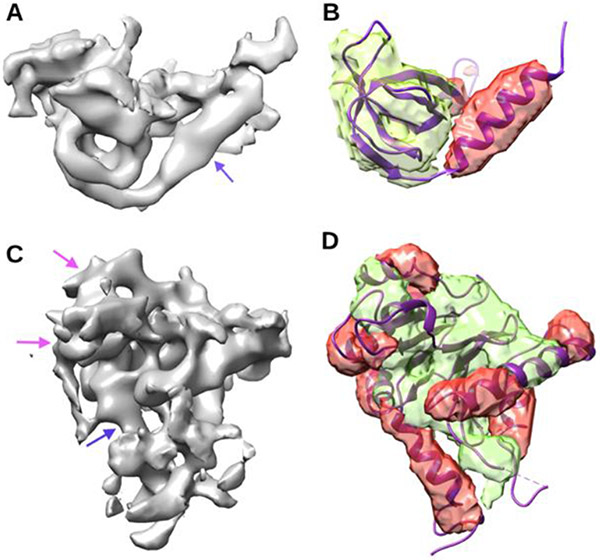
The detected helices and β-sheet voxels are shown in two test cases. One is in the high-quality bin (Fig. 3 (B)) and the other is in the low-quality bin (Figure 3 (D)). The best CL-Revisit model was applied to the cryo-EM image (Figure 3 (A)) that corresponds to Chain Q of atomic structure 5lmp. It is noticeable that this chain has one helix and five β-strands, and that the cylindrical character of a helix is more obvious than that in the cryo-EM image of EMD-8335 (Figure 3(C)). In this case, most of the helix and β-sheet was detected correctly, as seen with the reference of the atomic model (Figure 3 (B)). The F1 scores of helix and β-sheet detection are 0.696 and 0.665 respectively. For the cryo-EM image in the low-quality bin (Figure 3 (C)), we observed more error in the detection with F1 scores being 0.58 and 0.48 for helix and β-sheet respectively. The lower F1 score reflects the error in both mis-detected helix regions and wrongly detected β-sheet regions (a purple arrow in Figure 3 (C), and (D)).
Figure 3. Cryo-EM density maps of various quality and detected voxels of helices and β-sheets using curriculum training CL-Revisit.
(A) Cryo-EM density map (EMD-4075) was downloaded from EMDB. The density area (gray) corresponding to chain Q of atomic structure 5lmp (PDB ID) was isolated from the entire cryo-EM density map. (B) Detected helix voxels (red) and β-sheet voxels (green) are superimposed with the atomic structure (ribbon) of chain Q of protein 5lmp. (C) and (D) are annotated similarly as in (A) and (B) for the area of cryo-EM density map (EMD-8335) that corresponds to chain K of protein 5t0h (PDB ID). The cryo-EM density area in (A) is in the high-quality bin, and that in (C) is in the low-quality bin. Blue arrows (better) and purple arrows point to density regions of helices with varying quality of the map.
3.3. Validation loss during multiple phases for multiple quality bins
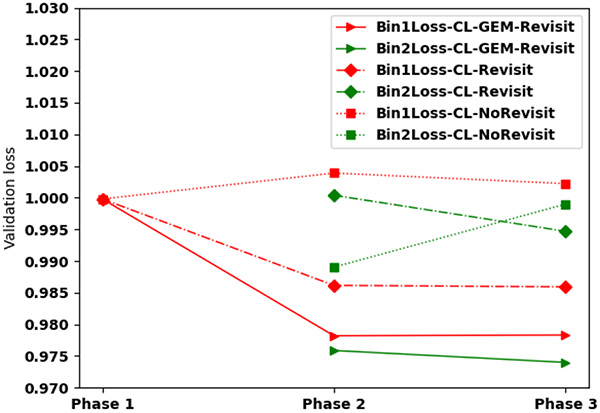
In order to understand how curriculum training enriches standard training process, we monitored validation loss of the best adopted model at each phase for the three curriculum training methods performing in different quality bins of images. In our curriculum training methods, images in the high-quality bin was used in phase 1. We explored using the same model obtained in phase 1 for the initial model of phase 2 for three training methods – CL-NoRevisit, CL-Revisit, and CL-GEM-Revisit. Curriculum training without revisit (CL-NoRevisit) uses one bin in each phase rather than using data of the previous bin/phase in the current phase, “forgetfulness” was observed. As an example, the validation loss of the same images in Phase 1, when only high-quality bin was used, is already 0.9998 at the end of phase 1(starting red point in Figure 4), but it increases to 1.0038 at the end of phase 2, and then reduces a little to 1.0022 at the end of phase 3 (red squares in Figure 4). The validation loss at the end of phase 3 is higher than that at the end of phase 1, suggesting that the later training forgot what was learned in earlier training. Similar forgetfulness was also observed for Bin2 (medium-high quality bin) when no revisit was used (green squares in Figure 4).
Figure 4. Validation loss at three phases for three curriculum training methods:
The validation loss for Bin 1 (the high-quality image bin shown in red), Bin 2 (the medium-high quality image bin, shown in green) is shown for four different training methods CL-NoRevisit, CL-Revisit, CL-GEM-Revisit. The same model was used as the initial model of phase 2.
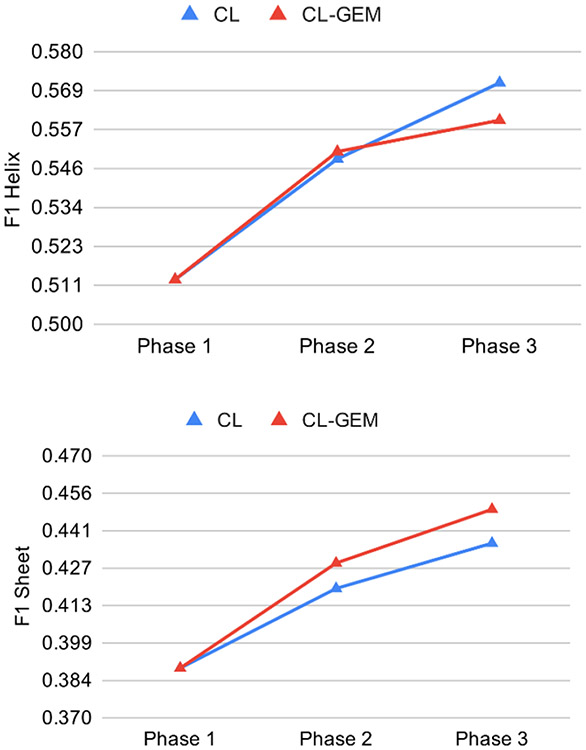
Revisit in curriculum training is important. We observed decreased loss in both CL-Revisit and CL-GEM-Revisit methods from one phase to the next (diamonds and triangle respectively in Figure 4). This suggests that the training is moving towards the right direction for both data in the high-quality bin, even though they were introduced early in the training phase. GEM shows the most overall decrease of validation loss when revisit was applied. To visualize the effect of curriculum training across three phases, we monitored the F1 scores of all the 65 test cases that include all three quality bins (Figure 5). Both CL-Revisit and CL-GEM-Revisit see enhanced F1 scores for helix and β-sheet detection from phase 1 to phase 3.
Figure 5. Effect of training curricula over different phases for the accuracy of 65 test cases in detection of helices (upper) and β-sheets(lower).
Blue triangles: CL-Revisit; Red triangles: CL-GEM-Revisit.
4. CONCLUSION
Detecting secondary structures from medium-resolution cryo-EM density maps is challenging. The shape characters of secondary structures vary significantly due to the size of the secondary structures, the surrounding environment, experimental defects, and the resolution of the density maps. We established a U-net architecture and investigated three curriculum learning methods utilizing quantitative measurement of quality for density maps. Compared to standard training that uses all training data at once, we demonstrated that the curricula to train at three phases that introduce lower-quality data gradually while simultaneously revisiting data of earlier phases enhances the detection of both helices and β-sheets. CL-GEM-Revisit is the most accurate training method of the three investigated, most likely because of the control in gradient update using a small number of random samples of an earlier phase. Although the enhanced performance is not dramatic, our investigation provided a valuable understanding of the learning process of CNN. Such understanding is pivotal in designing effective learning strategies that mimic human learning.
5. ACKNOWLEDGMENTS
The work in this paper is supported by NIH R01-GM062968.
6. REFERENCES
- [1].Jiang W, Baker ML, Ludtke SJ and Chiu W Bridging the information gap: computational tools for intermediate resolution structure interpretation. Journal of molecular biology, 308, 5 (May 18 2001), 1033–1044. [DOI] [PubMed] [Google Scholar]
- [2].Kong Y and Ma J A structural-informatics approach for mining beta-sheets: locating sheets in intermediate-resolution density maps. Journal of molecular biology, 332, 2 (Sep 12 2003), 399–413. [DOI] [PubMed] [Google Scholar]
- [3].Dal Palu A, He J, Pontelli E and Lu Y Identification of Alpha-Helices from Low Resolution Protein Density Maps. Proceeding of Computational Systems Bioinformatics Conference(CSB) (2006), 89–98. [PubMed] [Google Scholar]
- [4].Baker ML, Ju T and Chiu W Identification of secondary structure elements in intermediate-resolution density maps. Structure, 15, 1 (Jan 2007), 7–19. [DOI] [PMC free article] [PubMed] [Google Scholar]
- [5].Si D, Ji S, Nasr KA and He J A Machine Learning Approach for the Identification of Protein Secondary Structure Elements from Electron Cryo-Microscopy Density Maps. Biopolymers, 97, 9 (2012), 698–708. [DOI] [PubMed] [Google Scholar]
- [6].Rusu M and Wriggers W Evolutionary bidirectional expansion for the tracing of alpha helices in cryo-electron microscopy reconstructions. Journal of structural biology, 177, 2 (Feb 2012), 410–419. [DOI] [PMC free article] [PubMed] [Google Scholar]
- [7].Si D and He J Beta-sheet Detection and Representation from Medium Resolution Cryo-EM Density Maps. Proceedings of the International Conference on Bioinformatics, Computational Biology and Biomedical Informatics (2013), 764–770. [Google Scholar]
- [8].Si D and He J Tracing Beta Strands Using StrandTwister from Cryo-EM Density Maps at Medium Resolutions. Structure, 22, 11 (2014/November/04/ 2014), 1665–1676. [DOI] [PubMed] [Google Scholar]
- [9].Nasr KA, Chen L, Si D, Ranjan D, Zubair M and He J Building the initial chain of the proteins through de novo modeling of the cryo-electron microscopy volume data at the medium resolutions. In Proceedings of the Proceedings of the ACM Conference on Bioinformatics, Computational Biology and Biomedicine (2012), 490–497. [Google Scholar]
- [10].Al-Nasr K, Ranjan D, Zubair M and He J Ranking Valid Topologies of the Secondary Structure Elements Using a Constraint Graph. J. Bioinformatics and Computational Biology, 9, 3 (2011), 415–430. [DOI] [PubMed] [Google Scholar]
- [11].Nasr KA, Ranjan D, Zubair M, Chen L and He J Solving the Secondary Structure Matching Problem in Cryo-EM De Novo Modeling Using a Constrained $K$-Shortest Path Graph Algorithm. IEEE/ACM transactions on computational biology and bioinformatics, 11, 2 (2014), 419–430. [DOI] [PubMed] [Google Scholar]
- [12].Li R, Si D, Zeng T, Ji S and He J Deep convolutional neural networks for detecting secondary structures in protein density maps from cryo-electron microscopy. 2016 IEEE International Conference on Bioinformatics and Biomedicine (BIBM) (15-18 Dec. 2016. 2016), 41–46. [DOI] [PMC free article] [PubMed] [Google Scholar]
- [13].Haslam D, Zeng T, Li R and He J Exploratory Studies Detecting Secondary Structures in Medium Resolution 3D Cryo-EM Images Using Deep Convolutional Neural Networks. In Proceedings of the 2018 ACM International Conference on Bioinformatics, Computational Biology, and Health Informatics (2018), 628–632. [DOI] [PMC free article] [PubMed] [Google Scholar]
- [14].Maddhuri SVS, Terashi G and Kihara D Protein secondary structure detection in intermediate-resolution cryo-EM maps using deep learning. Nature methods, 16, 9 (2019), 911–917. [DOI] [PMC free article] [PubMed] [Google Scholar]
- [15].Wriggers W and He J Numerical geometry of map and model assessment. Journal of structural biology, 192, 2 (2015/November/01/ 2015), 255–261. [DOI] [PMC free article] [PubMed] [Google Scholar]
- [16].Sazzed S, Scheible P, Alshammari M, Wriggers W and He J Cylindrical Similarity Measurement for Helices in Medium-Resolution Cryo-Electron Microscopy Density Maps. Journal of Chemical Information and Modeling, 60, 5 (2020/May/26 2020), 2644–2650. [DOI] [PMC free article] [PubMed] [Google Scholar]
- [17].Ronneberger O, Fischer P and Brox T U-Net: Convolutional Networks for Biomedical Image Segmentation. CoRR, abs/1505.04597 (2015). [Google Scholar]
- [18].Avrahami J, Kareev Y, Bogot Y, Caspi R, Dunaevsky S and Lerner S Teaching by examples: Implications for the process of category acquisition. The Quarterly Journal of Experimental Psychology Section A, 50, 3 (1997), 586–606. [Google Scholar]
- [19].Jesson A, Guizard N, Ghalehjegh SH, Goblot D, Soudan F and Chapados N CASED: curriculum adaptive sampling for extreme data imbalance. In International Conference on Medical Image Computing and Computer-Assisted Intervention (2017), 639–646. [Google Scholar]
- [20].Amodei D, Ananthanarayanan S, Anubhai R, Bai J, Battenberg E, Case C, Casper J, Catanzaro B, Cheng Q and Chen G Deep speech 2: End-to-end speech recognition in english and mandarin. International conference on machine learning (2016), 173–182. [Google Scholar]
- [21].Zaremba W and Sutskever I Learning to execute. arXiv preprint arXiv:1410.4615 (2014). [Google Scholar]
- [22].Hacohen G and Weinshall D On the power of curriculum learning in training deep networks. arXiv preprint arXiv:1904.03626 (2019). [Google Scholar]
- [23].Lopez-Paz D and Ranzato MA Gradient episodic memory for continual learning. Advances in neural information processing systems (2017), 6467–6476. [Google Scholar]
- [24].Sazzed S, Scheible P, Alshammari M, Wriggers W and He J Cylindrical Similarity Measurement for Helices in Medium-Resolution Cryo-Electron Microscopy Density Maps. Journal of Chemical Information and Modeling (2020). [DOI] [PMC free article] [PubMed] [Google Scholar]
- [25].Serrà J, Suris D, Miron M and Karatzoglou A Overcoming catastrophic forgetting with hard attention to the task. arXiv preprint arXiv:1801.01423 (2018). [Google Scholar]
- [26].Kingma DP and Ba J Adam: A method for stochastic optimization. arXiv preprint arXiv:1412.6980 (2014). [Google Scholar]


