Abstract
Cryo-electron microscopy (cryo-EM) is an emerging biophysical technique for structural determination of protein complexes. However, accurate detection of secondary structures is still challenging when cryo-EM density maps are at medium resolutions (5–10 Å). Most of existing methods are image processing methods that do not fully utilize available images in the cryo-EM database. In this paper, we present a deep learning approach to segment secondary structure elements as helices and β-sheets from medium-resolution density maps. The proposed 3D convolutional neural network is shown to detect secondary structure locations with an F1 score between 0.79 and 0.88 for six simulated test cases. The architecture was also applied to an experimentally-derived cryo-EM density map with good accuracy.
Keywords: Deep Learning, Neural Networks, Fully Convolutional, Protein, Secondary Structure, Cryo-electron Microscopy
1. INTRODUCTION
Proteins are imperative to living cells. The three-dimensional (3D) structure of a protein determines the function of the protein. Cryo-electron microscopy (cryo-EM) is an important technique in molecular structure determination. Using cryo-EM, a growing number of large molecular complexes have been resolved to atomic resolutions [1, 2]. However, for cryo-EM density maps with a medium resolution (5–10 Å), it is much more challenging to recognize detailed molecular features. In most cases, it is not possible to derive atomic structures from these medium resolution images without the knowledge of known atomic structures as templates. When a template structure is available, fitting is used to derive atomic structure [3, 5]. When no suitable template structures are available, matching secondary structures that are detected from the 3D image and those predicted from the sequence of the protein may suggest possible topologies of secondary structures [6–10].
The most common secondary structure elements (SSEs) in a medium-resolution density map are α-helices and β-sheets. The major difficulty of detecting secondary structures in such density maps is that the patterns of the SSEs can be indistinguishable from their narrowly located neighbors. Many methods have been developed to detect SSEs at medium resolutions. These approaches are mostly based on image-processing techniques. A helix is often identified using cylinder-like templates or carefully-designed cylinder-like features. A β-sheet is identified using plane-like templates or features. The drawbacks of these methods include carefully selected parameters and under-utilizing large amount of existing density maps in the database. If SSEs could be more accurately detected, this would be an important step to automatically resolve protein structures from cryo-EM images at medium resolutions [11–17].
Generally, long α-helices, such as those with more than 20 amino acids, can be detected by a variety of methods. On the other hand, short α-helices can be easily confused with turns/loops. Similarly, large β-sheets show unique characteristics while small β-sheets might be confused with an α-helix. Due to the small spacing of β-strands at about 4.5Å, these strands are often not visible in a medium-resolution density map. Several methods have been proposed to predict traces of β- strands from segmented β-sheet regions [18, 19]. As machine learning methods continue to show their merit in image processing tasks, several approaches have been taken to solve the problem presented. The authors of [20] used nested K nearest neighbors classifiers to detect α-helices. In addition, methods using support vector machines (SVM) have also been employed to identify α- helices and β-sheets [21]. However, empirically-derived features may not be representative enough to obtain state of the art accuracy. Most recently, Li et al. has shown potential of convolutional neural networks (CNNs) achieving good performance [22].
Convolutional neural networks utilize arranged layers to learn complex features. CNNs have been shown to produce state of the art performance in a variety of image related applications [23–28]. More recently, CNNs have been extended to tasks involving image segmentation with good accuracy [29–31]. CNNs are appealing due to their ability to learn features with trainable parameters in tasks that require nonlinear relationships. Due to these advantages, we explore CNNs to segment secondary structures from cryo-EM 3D density maps.
2. METHODS
2.1. Architecture and Parameters
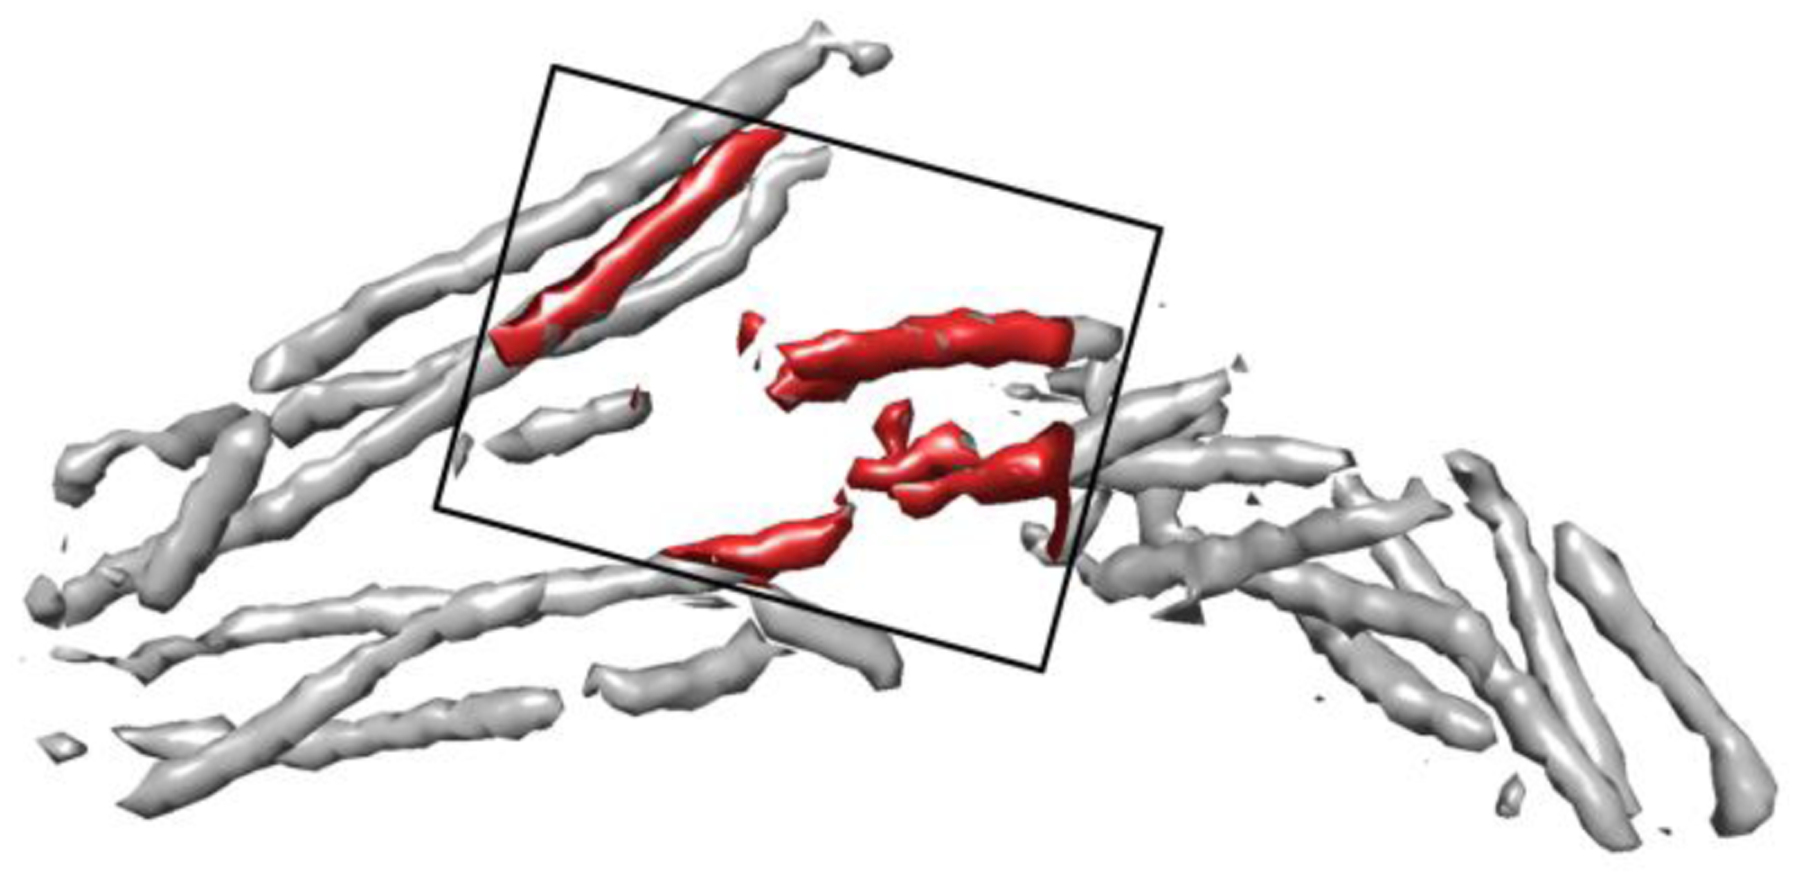
Several challenges are presented when attempting to segment secondary structures from a cryo-EM density map. One of these challenges is the large diversity of proteins in the database. The architecture used to segment these SSEs must be able to learn features from multiple scales. A second challenge existing is the varying sizes of proteins with in the database. In order to overcome this problem, we train and test with patches of size 48×48×48. A visualization of the patch can be seen in Figure 1. We attempted to find a size that would be small enough to eliminate the need for padding the 3D images, while still being large enough to hold important information when the receptive field is reduced to its smallest window.
Figure 1. An example of the patch size in training and testing.

The density within a patch (red) is superimposed on the entire 3D image simulated using the atomic structure of protein 2XS1 (PDB ID).
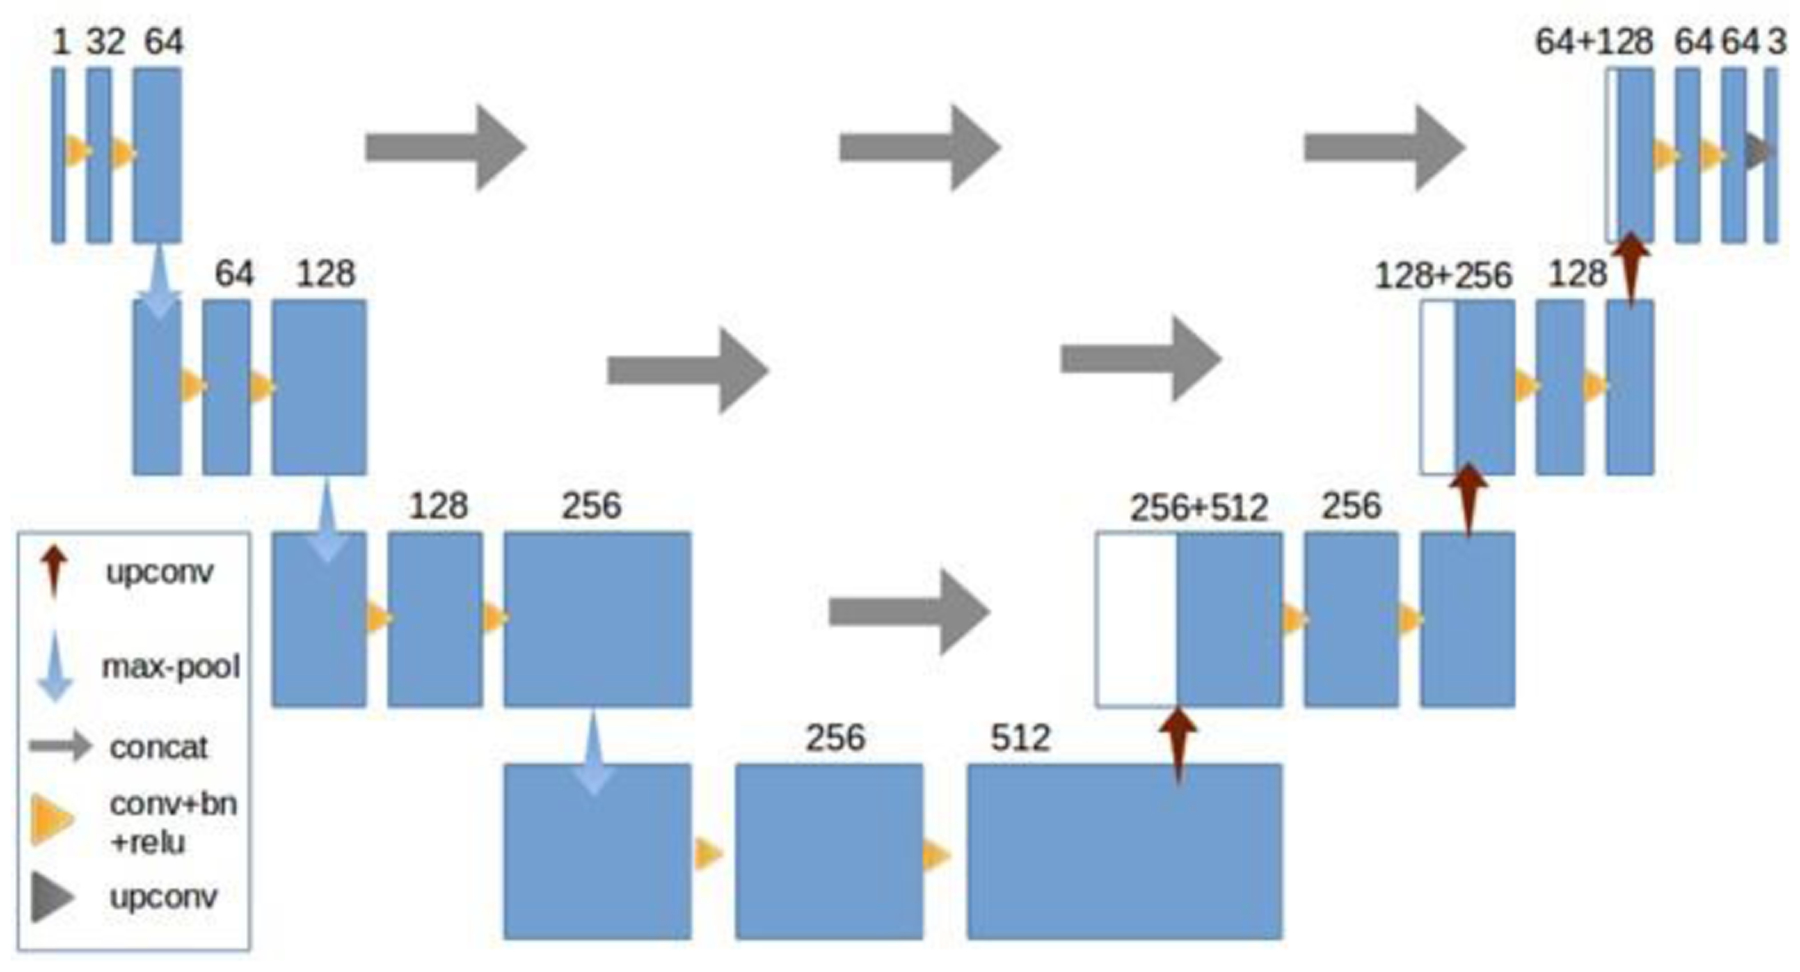
Inspired by 3D-UNET [32], we implemented a similar model. This model consists of an analysis path and a synthesis path. In the analysis path, each layer consists of two 3×3×3 convolutions, both followed by a batch normalization and a relu operation. Each layer in the analysis path is ended by a 3×3×3 max pool with a stride of two. By using a stride of two, we reduced the receptive field by a factor of two at the end of each layer in this path. After three layers that use increasingly more features, the analysis path has ended. The receptive field at the end of the analysis path is now eight times smaller than the original input. The synthesis path is very similar except each layer is ended with a transposed convolution increasing the receptive field by a factor of two. We also concatenate the results of each layer in the analysis path with the results of each synthesis layer. In the last layer we use a 1×1×1 convolution to decrease the amount of output channels to three labels. A more detailed description of the architecture can be seen in Figure 2.
Figure 2.

The 3D U-net architecture.
Small batches of four images and a dropout rate of 50% were used during training. Unlike the previous work using a CNN architecture [22], no post-processing was performed, yet the model produces equivalent results as those using post-processing in the previous CNN architecture. Naturally, we used softmax with cross entropy to measure loss. In order to optimize this loss function, we employ an Adam optimizer with a 1e-4 training rate.
2.2. Data
We have used the presented architecture to test six simulated 3D images and one experimentally-derived cryo-EM density map. After collecting 31 atomic protein structures from the Protein Data Bank (PDB), we simulated each to 9Å resolution with a 1Å voxel size using UCSF Chimera [33]. Among the 31 3D images, 25 images were used for training, and the remaining six were used for testing. In order to fully utilize the simulated 3D images, each image was rotated around the X, Y, and Z axes with a random angle to produce 35 3D images as additional samples. Conversely, when using experimental data, we have downloaded each cryo-EM density map from Electron Microscopy Data Bank (EMDB) and the corresponding atomic structures from the PDB. Although there is a large number of cryo-EM maps with annotated resolution between 5–10Å, only those with visually good quality were used for training. When evaluating our model on experimental data, we used 42 cryo-EM maps with a total of 67 chains for training. Much of the training data is unique, but there are a few chains in the set that are similar. The experimental data used for training and testing have voxel sizes between 0.82 Å/voxel and 1.86 Å/voxel. We expect the network to learn the characteristics of SSEs even when the voxel size might be different.
3. RESULTS
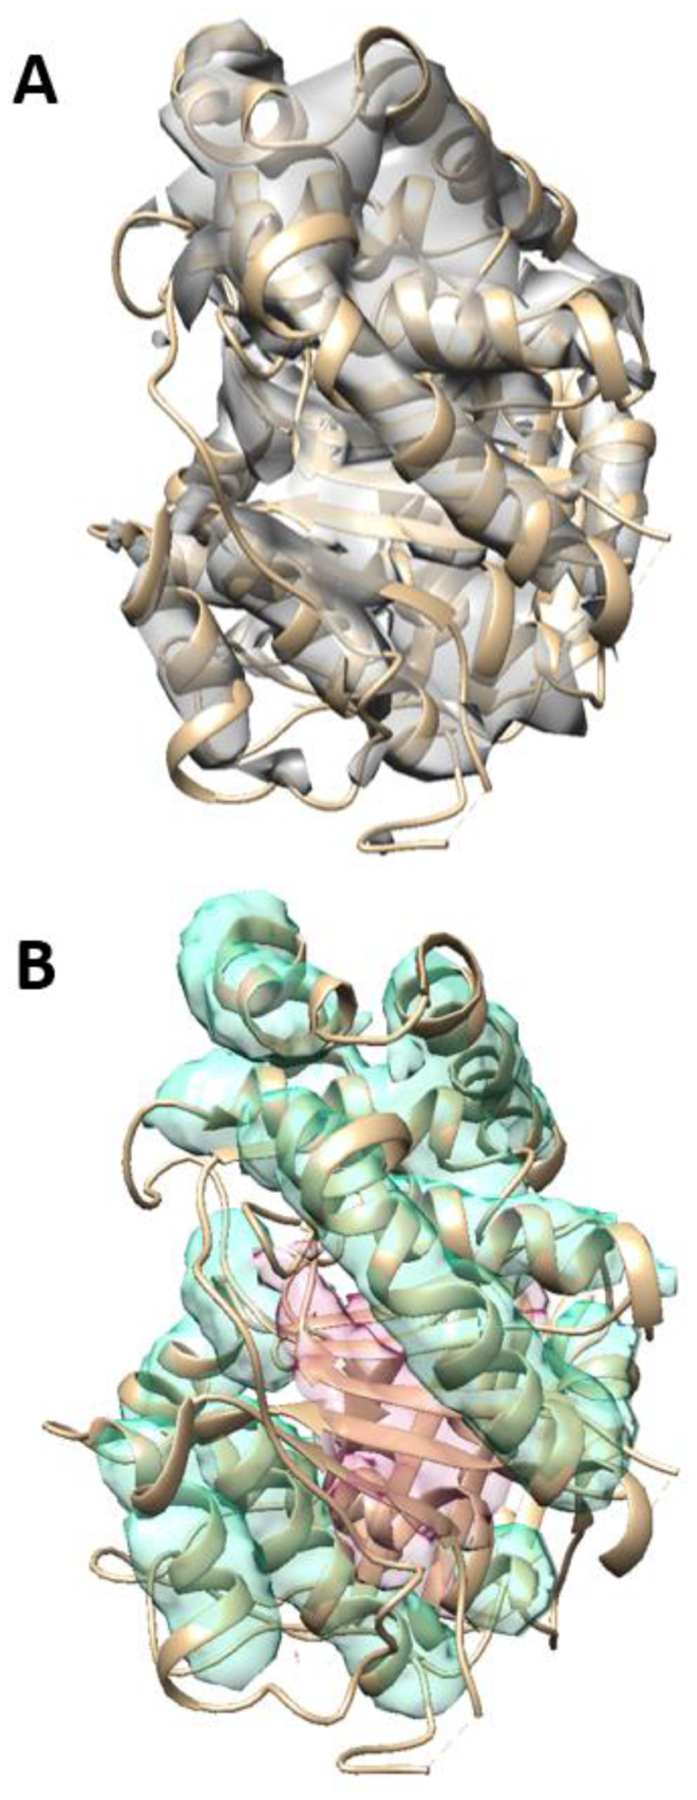
An example of secondary structures segmented from a simulated 3D image is shown in Figure 3. This protein 3j7i_a (PDB ID) has 17 helices and nine β-strands (Table 1). Visual inspection shows that both the helix regions and the β-sheet regions were identified correctly using the proposed CNN architecture. When testing, we also use patches of 48×48×48. As an example for 3j7i_a, nine patches of 48×48×48 were randomly selected from the entire density map. The accuracy of detected helix voxels was quantified for each patch using the F1 score. We observed that the F1 scores of different patches in a protein are similar. The averaged F1 score of nine patches in 3j7i_a is 0.806 for helix detection (Table 1). The average F1 score of helix, β-sheet, and background is 0.789 for all nine patches in protein 3j7i_a. The F1 scores for helix detection are between 0.734 and 0.872 for the six test cases (Table 1). The F1 scores for β-sheet detection are from 0.749 to 0.999. The three cases with the highest F1 scores of β-sheets have small β-sheets with two strands only. The overall 3-class average of F1 scores are between 0.795 and 0.883 for the six simulated test cases.
Figure 3. An example of secondary structure segmentation using the CNN architecture.

(A) A 3D image simulated using the atomic structure of protein 3j7i_a (PDB ID) (shown in ribbon). (B) The detected helix regions (cyan), and β-sheet regions (pink) are superimposed with the atomic structure (ribbon).
Table 1.
Detection accuracy of three classes (helix, β-sheet, and background). Row 2 to row 7 are simulated test cases using atomic structures of PDB. Row 8 involves an experimentally-derived test case with its EMDB ID indicated in parentheses.
| PDB ID | Patch Number | Helix Number | Strand Number | F1-Helix | F1-Sheet | F1-Background | F1-Avg |
|---|---|---|---|---|---|---|---|
| 3j7i_a | 9 | 17 | 9 | 0.806 | 0.749 | 0.812 | 0.789 |
| 1T79 | 10 | 12 | 4 | 0.872 | 0.766 | 0.861 | 0.883 |
| 1cv1 | 8 | 7 | 3 | 0.734 | 0.878 | 0.774 | 0.795 |
| 2XS1 | 8 | 26 | 2 | 0.81 | 0.998 | 0.802 | 0.87 |
| 3MK4 | 7 | 15 | 2 | 0.8 | 0.999 | 0.794 | 0.864 |
| 4P1T | 7 | 25 | 2 | 0.822 | 0.998 | 0.812 | 0.877 |
| 3C92 (1740) | 14 | 182 | 307 | 0.819 | 0.853 | 0.828 | 0.833 |
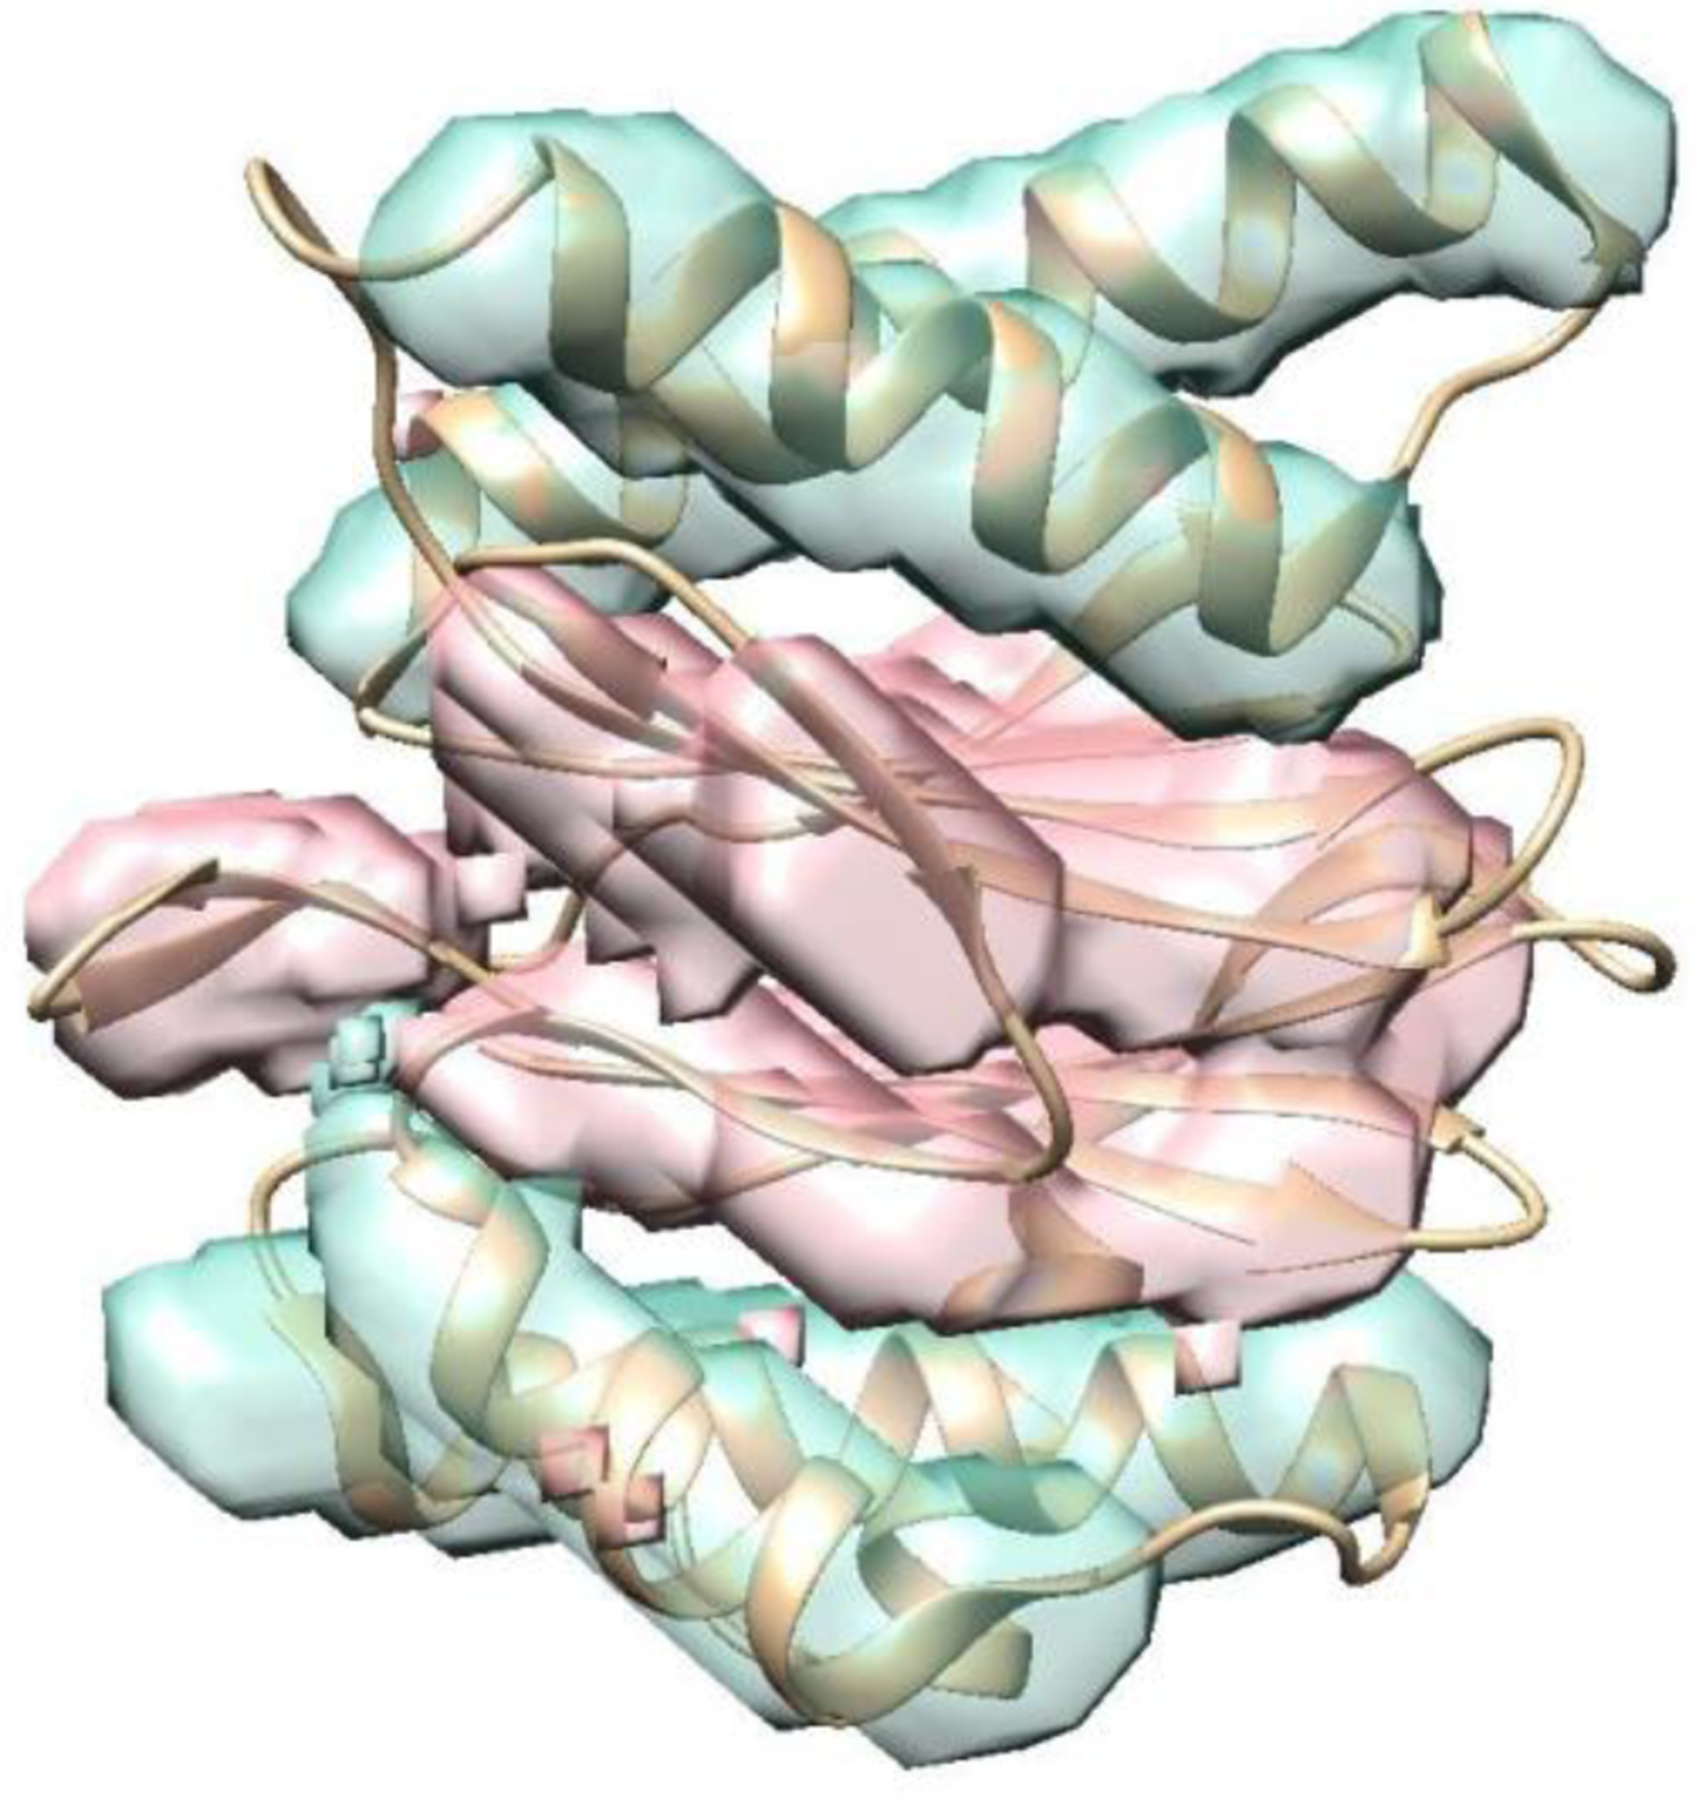
Due to large amount of noise found in experimentally-derived cryo-EM density maps, it is much more challenging to identify secondary structures in such images. An example of segmented helices and β-sheets is shown for cryo-EM density map EMD-1740 with 6.2 Å resolution (Figure 4). A chain of the protein 3c92 (PDB ID) was used as an envelope to extract the density region that corresponds to the chain in EMD-1740. This chain consists of five helices and three β-sheets, all of which appear to be segmented correctly (Figure 4). In this case, the average F1 score for 14 patches is 0.819 for helix detection, and 0.853 for β-sheet detection. The accuracy for cryo-EM case is comparable, with an overall F1 score of 0.828, to the accuracy of the simulated cases. We plan to expand the amount of training data in future and develop a standard dataset for training. With a larger amount of training data, the model is likely to be more accurate.
Figure 4. Detected helices and β-sheets from an experimentally-derived cryo-EM density map 1740 (EMDB ID).

The corresponding atomic structure of protein 3c92(PDB ID) (ribbon) is superimposed.
4. CONCLUSIONS
Deriving atomic structures from medium-resolution cryo-EM density maps is challenging. An important step to derive the atomic structure automatically is detecting the location of secondary structures within the density map. We have presented a 3D convolutional neural network for segmentation of secondary structure elements from cryo-EM images. Although CNN has been shown as a powerful image processing method, there is limited work developing CNN architectures that are effective in 3D segmentation problems for protein secondary structure detection from cryo-EM density maps. Using 3D UNET as a guide [32], we have created an encoder decoder architecture employing 3D convolutions to capture features along three dimensions. We show that this version of 3D U-Net can achieve good accuracy in a test of six simulated density maps and one experimentally-derived cryo-EM map. We plan to improve this model and to perform a large-scale test using more cryo-EM density maps.
CCS CONCEPTS.
Computer vision → Computer vision problems → Image segmentation;
Applied computing → Life and medical sciences → Computational biology → Imaging
ACKNOWLEDGMENTS
The work in this paper is supported by NSF DBI-1356621 and NIH R01-GM062968. DH, TZ, and JH participated in methodology design. DH implemented and tested the method. DH and JH wrote the paper. RL provided initial support.
Contributor Information
Devin Haslam, Department of Computer Science, Old Dominion University, Norfolk, VA, 23529.
Tao Zeng, Department of Computer Science, Washington State University, Pullman, WA 99164.
Rongjian Li, KeyBank, Cleveland, OH 44114.
Jing He, Department of Computer Science, Old Dominion University, Norfolk, VA, 23529.
REFERENCES
- [1].Liu Zheng, Guo Fei, Wang Feng, Li Tian-Cheng, and Jiang Wen. 2016. 2.9 Å Resolution Cryo-EM 3-D Reconstruction of Close-packed Virus Particles. Structure (London, England : 1993) 24, 2 (February 2016), 319–328. DOI: 10.1016/j.str.2015.12.006 [DOI] [PMC free article] [PubMed] [Google Scholar]
- [2].Bai Xiao-chen, Fernandez Israel S, McMullan Greg, and Scheres Sjors HW. 2013. Ribosome structures to near-atomic resolution from thirty thousand cryo-EM particles. eLife 2, (February 2013). DOI: 10.7554/eLife.00461 [DOI] [PMC free article] [PubMed] [Google Scholar]
- [3].Chan Kwok-Yan, Trabuco Leonardo G., Schreiner Eduard, and Schulten Klaus. 2012. Cryo- Electron Microscopy Modeling by the Molecular Dynamics Flexible Fitting Method. Biopolymers 97, 9 (September 2012), 678–686. DOI: 10.1002/bip.22042 [DOI] [PMC free article] [PubMed] [Google Scholar]
- [4].Schröder Gunnar F., Brunger Axel T., and Levitt Michael. 2007. Combining Efficient Conformational Sampling with a Deformable Elastic Network Model Facilitates Structure Refinement at Low Resolution. Structure 15, 12 (December 2007), 1630–1641. DOI: 10.1016/j.str.2007.09.021 [DOI] [PMC free article] [PubMed] [Google Scholar]
- [5].Wriggers Willy and Birmanns Stefan. 2001. Using Situs for Flexible and Rigid-Body Fitting of Multiresolution Single-Molecule Data. Journal of Structural Biology 133, 2–3 (February 2001), 193–202. DOI: 10.1006/jsbi.2000.4350 [DOI] [PubMed] [Google Scholar]
- [6].Nasr Kamal Al, Chen Lin, Si Dong, Ranjan Desh, Zubair Mohammad, and He Jing. 2012. Building the initial chain of the proteins through de novo modeling of the cryo-electron microscopy volume data at the medium resolutions. In Proceedings of the ACM Conference on Bioinformatics. 490–497. DOI: 10.1145/2382936.2382999 [DOI] [Google Scholar]
- [7].Nasr Kamal Al, Ranjan Desh, Zubair Mohammad, Chen Lin, and He Jing. 2014. Solving the Secondary Structure Matching Problem in Cryo-EM De Novo Modeling Using a Constrained $K$- Shortest Path Graph Algorithm. IEEE/ACM Transactions on Computational Biology and Bioinformatics 11, 2 (March 2014), 419–430. DOI: 10.1109/TCBB.2014.2302803 [DOI] [PubMed] [Google Scholar]
- [8].Nasr Kamal Al, Ranjan Desh, Zubair Mohammad, and He Jing. 2011. Ranking valid topologies of the secondary structure elements using a constraint graph. J Bioinform Comput Biol 9, 3 (June 2011), 415–430. [DOI] [PubMed] [Google Scholar]
- [9].Haslam Devin, Zubair Mohammad, Ranjan Desh, Biswas Abhishek, and He Jing. 2016. Challenges in matching secondary structures in cryo-EM: An exploration. In Proceeedings of the IEEE International Conference on Bioinformatics and Biomedicine. 1714–1719. DOI: 10.1109/BIBM.2016.7822776 [DOI] [PMC free article] [PubMed] [Google Scholar]
- [10].Abeysinghe Sasakthi, Ju Tao, Baker Matthew, Chiu Wah.. 2008. Shape Modeling and Matching in Identifying 3D Protein Structures. Computer-Aided Design 40, 6 (June 2008), 708–720. DOI: 10.1016/j.cad.2008.01.013. [DOI] [Google Scholar]
- [11].Baker Matthew L., Ju Tao, and Chiu Wah. 2007. Identification of Secondary Structure Elements in Intermediate-Resolution Density Maps. Structure 15, 1 (January 2007), 7–19. DOI: 10.1016/j.str.2006.11.008 [DOI] [PMC free article] [PubMed] [Google Scholar]
- [12].Dal Palù A, He J, Pontelli E, and Lu Y. 2006. Identification of alpha-helices from low resolution protein density maps. Comput Syst Bioinformatics Conf (2006), 89–98. [PubMed] [Google Scholar]
- [13].Jiang Wen, Baker Matthew L., Ludtke Steven J., and Chiu Wah. 2001. Bridging the information gap: computational tools for intermediate resolution structure interpretation. Journal of Molecular Biology 308, 5 (May 2001), 1033–1044. DOI: 10.1006/jmbi.2001.4633 [DOI] [PubMed] [Google Scholar]
- [14].Kong Yifei and Ma Jianpeng. 2003. A Structural-informatics Approach for Mining β-Sheets: Locating Sheets in Intermediate-resolution Density Maps. Journal of Molecular Biology 332, 2 (September 2003), 399–413. DOI: 10.1016/S0022-2836(03)00859-3 [DOI] [PubMed] [Google Scholar]
- [15].Rusu Mirabela and Wriggers Willy. 2012. Evolutionary bidirectional expansion for the tracing of alpha helices in cryo-electron microscopy reconstructions. Journal of Structural Biology 177, 2 (February 2012), 410–419. DOI: 10.1016/j.jsb.2011.11.029 [DOI] [PMC free article] [PubMed] [Google Scholar]
- [16].Si Dong and He Jing. 2013. Beta-sheet Detection and Representation from Medium Resolution Cryo-EM Density Maps. In Proceedings of the International Conference on Bioinformatics, Computational Biology and Biomedical Informatics. 764–770. DOI: 10.1145/2506583.2506707 [DOI] [Google Scholar]
- [17].Yu Zeyun and Bajaj Chandrajit. 2008. Computational Approaches for Automatic Structural Analysis of Large Biomolecular Complexes. IEEE/ACM Transactions on Computational Biology and Bioinformatics 5, 4 (October 2008), 568–582. DOI: 10.1109/TCBB.2007.70226 [DOI] [PubMed] [Google Scholar]
- [18].Si Dong and He Jing. 2017. Modeling Beta-Traces for Beta-Barrels from Cryo-EM Density Maps. BioMed Research International 2017, (2017), 1–9. DOI: 10.1155/2017/1793213 [DOI] [PMC free article] [PubMed] [Google Scholar]
- [19].Si Dong and He Jing. 2014.Tracing beta strands using StrandTwister from cryo-EM density maps at medium resolutions. Structure 22, 11, 1665–76. [DOI] [PubMed] [Google Scholar]
- [20].Lingyu Ma, Reisert M, and Burkhardt H. 2012. RENNSH: A Novel alpha-Helix Identification Approach for Intermediate Resolution Electron Density Maps. IEEE/ACM Transactions on Computational Biology and Bioinformatics 9, 1 (January 2012), 228–239. DOI: 10.1109/TCBB.2011.52 [DOI] [PubMed] [Google Scholar]
- [21].Si Dong, Ji Shuiwang, Nasr Kamal Al, and He Jing. 2012. A Machine Learning Approach for the Identification of Protein Secondary Structure Elements from Electron Cryo-Microscopy Density Maps. Biopolymers 97, 9 (September 2012), 698–708. DOI: 10.1002/bip.22063 [DOI] [PubMed] [Google Scholar]
- [22].Li Rongjian, Si Dong, Zeng Tao, Ji Shuiwang, and He Jing. 2016. Deep convolutional neural networks for detecting secondary structures in protein density maps from cryo-electron microscopy. In Proceeedings of the IEEE International Conference on Bioinformatics and Biomedicine. 41–46. DOI: 10.1109/BIBM.2016.7822490 [DOI] [PMC free article] [PubMed] [Google Scholar]
- [23].Ji Shuiwang, Xu Wei, Yang Ming, and Yu Kai. 2013. 3D Convolutional Neural Networks for Human Action Recognition. IEEE Transactions on Pattern Analysis and Machine Intelligence 35, 1 (January 2013), 221–231. DOI: 10.1109/TPAMI.2012.59 [DOI] [PubMed] [Google Scholar]
- [24].Krizhevsky Alex, Sutskever Ilya, and Hinton Geoffrey E.. 2017. ImageNet classification with deep convolutional neural networks. Communications of the ACM 60, 6 (May 2017), 84–90. DOI: 10.1145/3065386 [DOI] [Google Scholar]
- [25].Zeng Tao, Li Rongjian, Mukkamala Ravi, Ye Jieping, and Ji Shuiwang. 2015. Deep convolutional neural networks for annotating gene expression patterns in the mouse brain. BMC Bioinformatics 16, 1 (December 2015). DOI: 10.1186/s12859-015-0553-9 [DOI] [PMC free article] [PubMed] [Google Scholar]
- [26].Zhang Wenlu, Li Rongjian, Deng Houtao, Wang Li, Lin Weili, Ji Shuiwang, and Shen Dinggang. 2015. Deep convolutional neural networks for multi-modality isointense infant brain image segmentation. NeuroImage 108, (March 2015), 214–224. DOI: 10.1016/j.neuroimage.2014.12.061 [DOI] [PMC free article] [PubMed] [Google Scholar]
- [27].Cireşan Dan C., Giusti Alessandro, Gambardella Luca M., and Schmidhuber Jürgen. 2013. Mitosis Detection in Breast Cancer Histology Images with Deep Neural Networks. In Medical Image Computing and Computer-Assisted Intervention – MICCAI 2013, Mori Kensaku, Sakuma Ichiro, Sato Yoshinobu, Barillot Christian and Navab Nassir (eds.). Springer Berlin Heidelberg, Berlin, Heidelberg, 411–418. DOI: 10.1007/978-3-642-40763-5_51 [DOI] [PubMed] [Google Scholar]
- [28].LeCun Y, Huang Fu Jie, and Bottou L. 2004. Learning methods for generic object recognition with invariance to pose and lighting. In Proceedings of the 2004 IEEE Computer Society Conference on Computer Vision and Pattern Recognition. 97–104. DOI: 10.1109/CVPR.2004.1315150 [DOI] [Google Scholar]
- [29].Jain Viren and Seung Sebastian. 2009. Natural Image Denoising with Convolutional Networks. In Advances in Neural Information Processing Systems 21, Koller D, Schuurmans D, Bengio Y and Bottou L (eds.). Curran Associates, Inc., 769–776. Retrieved from http://papers.nips.cc/paper/3506-naturalimage-denoising-with-convolutional-networks.pdf [Google Scholar]
- [30].Turaga Srinivas C., Murray Joseph F., Jain Viren, Roth Fabian, Helmstaedter Moritz, Briggman Kevin, Denk Winfried, and Seung H. Sebastian. 2010. Convolutional Networks Can Learn to Generate Affinity Graphs for Image Segmentation. Neural Computation 22, 2 (February 2010), 511–538. DOI: 10.1162/neco.2009.10-08-881 [DOI] [PubMed] [Google Scholar]
- [31].Zeng Tao, Li Rongjian, Mukkamala Ravi, Ye Jieping, and Ji Shuiwang. 2015. Deep convolutional neural networks for annotating gene expression patterns in the mouse brain. BMC Bioinformatics 16, 1 (December 2015). DOI: 10.1186/s12859-015-0553-9 [DOI] [PMC free article] [PubMed] [Google Scholar]
- [32].Özgün Çiçek Ahmed Abdulkadir, Lienkamp Soeren S., Brox Thomas, and Ronneberger Olaf. 2016. 3D U-Net: Learning Dense Volumetric Segmentation from Sparse Annotation. CoRR. (October 2016), 424–432. 10.1007/978-3-319-46723-8_49 [DOI] [Google Scholar]
- [33].Pettersen Eric F., Goddard Thomas D., Huang Conrad C., Couch Gregory S., Greenblatt Daniel M., Meng Elaine C., and Ferrin Thomas E.. 2004. UCSF Chimera - A visualization system for exploratory research and analysis. Journal of Computational Chemistry 25, 13 (October 2004), 1605–1612. DOI: 10.1002/jcc.20084 [DOI] [PubMed] [Google Scholar]


