Abstract
Extreme weather conditions associated with climate change affect many aspects of plant and animal life, including the response to infectious diseases. Production of salicylic acid (SA), a central plant defence hormone1–3, is particularly vulnerable to suppression by short periods of hot weather above the normal plant growth temperature range via an unknown mechanism4–7. Here we show that suppression of SA production in Arabidopsis thaliana at 28 °C is independent of PHYTOCHROME B8,9 (phyB) and EARLY FLOWERING 310 (ELF3), which regulate thermo-responsive plant growth and development. Instead, we found that formation of GUANYLATE BINDING PROTEIN-LIKE 3 (GBPL3) defence-activated biomolecular condensates11 (GDACs) was reduced at the higher growth temperature. The altered GDAC formation in vivo is linked to impaired recruitment of GBPL3 and SA-associated Mediator subunits to the promoters of CBP60g and SARD1, which encode master immune transcription factors. Unlike many other SA signalling components, including the SA receptor and biosynthetic genes, optimized CBP60g expression was sufficient to broadly restore SA production, basal immunity and effector-triggered immunity at the elevated growth temperature without significant growth trade-offs. CBP60g family transcription factors are widely conserved in plants12. These results have implications for safeguarding the plant immune system as well as understanding the concept of the plant–pathogen–environment disease triangle and the emergence of new disease epidemics in a warming climate.
Subject terms: Plant hormones, Plant immunity, Climate-change impacts, Biotic
Suppression of salicylic acid production in Arabidopsis thaliana at high temperature is caused by decreased recruitment of GUANYLATE BINDING PROTEIN-LIKE 3 defence-associated condensates on promoter sites of master immune regulatory genes.
Main
Previous studies have shown that basal13,14 and pathogen-induced15–17 SA production are negatively affected by higher temperatures within the optimal plant growth range13,14 or short periods of heat waves above the optimal range15–17. The temperature sensitivity appears to be unique to the SA pathway, as other stress hormone pathways, such as jasmonate and abscisic acid, are upregulated at higher temperature15,18. The mechanisms underlying selective suppression of the SA pathway during heat waves above the optimal temperature range is unclear and remains controversial15,16, leaving a significant gap in our understanding of how a warming climate with frequent and extreme heat waves would influence the effectiveness of the plant immune system. This knowledge gap presents a major obstacle to developing climate-resilient plants in which SA-mediated defences operate effectively, a key concern for future agricultural productivity, ecosystem preservation and the emergence of new plant disease pandemics4,5,19,20.
Temperature vulnerability of the SA pathway
The model plant A. thaliana accession Col-0 becomes hypersusceptible to the virulent pathogen Pseudomonas syringae pv. tomato (Pst) DC3000 during a short period of growth at elevated temperature15 (Fig. 1a). Elevated temperature also suppressed the expression of ISOCHORISMATE SYNTHASE 115 (ICS1) (Fig. 1b), a key SA biosynthetic gene21, leading to reduced SA accumulation at 28 °C versus 23 °C (Fig. 1c). Although elevated temperature does not affect MAP kinase activation during the early stages of pattern-triggered immunity (PTI) in response to bacterial flagellin-derived flg22 peptide22, downstream SA accumulation is significantly reduced (Extended Data Fig. 1a). Furthermore, consistent with previous studies showing suppressed effector-triggered immunity (ETI) at elevated temperature22–25, we found that SA accumulation in Arabidopsis Col-0 plants is suppressed at 28 °C after infection with an ETI-activating P. syringae strain (Extended Data Fig. 1b). Finally, elevated temperature downregulated the expression of SA-response genes in both dicot (rapeseed, tobacco and tomato) and monocot (rice) crop plants, after pathogen infection and/or pathogen-independent elicitation with benzothiadiazole (BTH), a synthetic SA analogue (Extended Data Fig. 1c–g). Together, these results suggest that the temperature vulnerability of the SA pathway is probably a common feature in plants and has pervasive effects on basal immunity, PTI and ETI.
Fig. 1. Temperature vulnerability of CBP60g gene expression and the SA transcriptome.
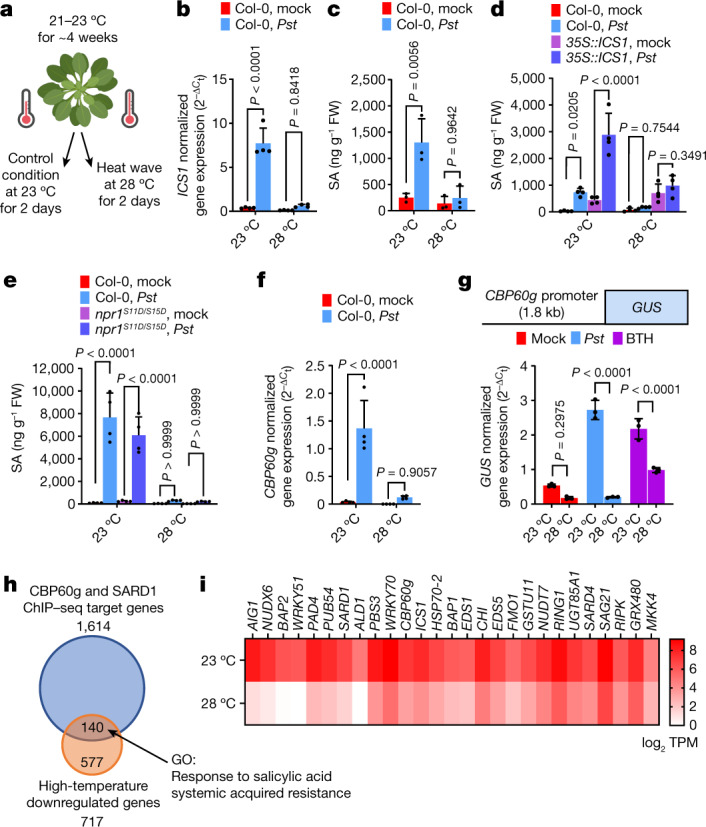
Leaves of 4- to 5-week-old Arabidopsis plants were syringe-infiltrated with mock (0.25 mM MgCl2), Pst DC3000 (106 colony forming units (CFU) per ml−1 suspension) or BTH solution and then incubated at 23 °C or 28 °C. Hormone analysis, RNA sequencing (RNA-seq), and quantitative PCR with reverse transcription (RT–qPCR) were performed 24 h after treatment (that is, 1 day post-inoculation (dpi)). a, A schematic diagram of the experimental protocol. b,c, ICS1 transcript (b) and SA (c) levels in mock- and Pst DC3000-infiltrated Col-0 plants at 1 dpi. FW, fresh weight. d,e, SA levels in mock- and Pst DC3000-inoculated Col-0 (d,e) and 35S::ICS1 (d) or npr1S11D/S15D (e) plants at 1 dpi. f, Endogenous CBP60g transcript level of samples in b at 1 dpi. g, Top, schematic of the GUS reporter gene. Bottom, GUS reporter gene expression in mock-, Pst DC3000- and BTH-treated pCBP60g::GUS plants one day after treatment. h, Gene Ontology (GO) analysis of Pst DC3000-induced genes that are differentially regulated at elevated temperature and their overlap with the SARD1 and CBP60g ChIP–sequencing dataset31. i, Representative RNA-seq reads after Pst DC3000 infection of defence-related CBP60g target genes for plants in h. TPM, transcripts per million mapped reads. Data in b–g,i are mean ± s.d. (n = 3 (c,g,i) or 4 (b,d–f) biological replicates) from one representative experiment analysed with two-way ANOVA with Tukey’s honest significant difference (HSD) for significance. Experiments were independently performed three times, except for i, with two experiments. Exact P-values for all comparisons are shown in the Source Data.
Extended Data Fig. 1. The SA pathway is downregulated at elevated temperatures in different plant species examined.
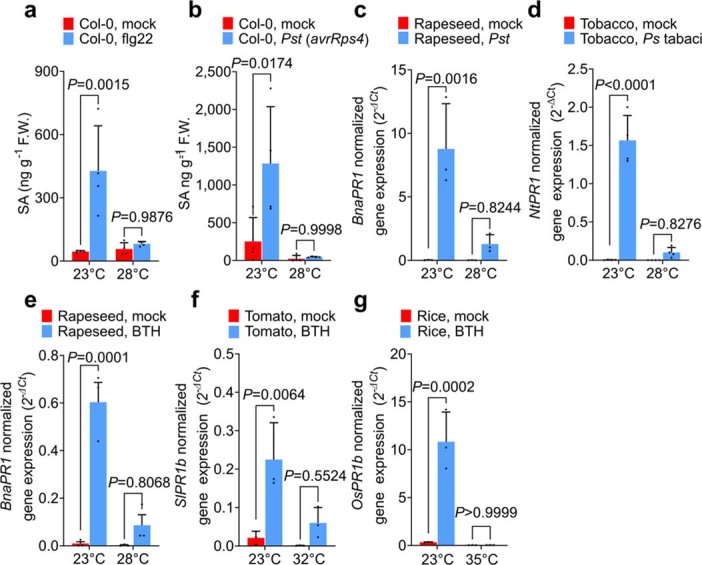
a–b, SA levels in 4-week-old Col-0 plants at 24 h after treatment [i.e., 1 day post-inoculation (dpi)] with flg22 peptide treatment (a) or Pst DC3000(avrRps4) inoculation [1.0 x 10⁸ Colony Forming Units (CFU) mL−1] (b) at 23 °C and 28 °C. c–d, Transcript levels of BnaPR1 in leaves of 4-week-old rapeseed Westar plants infiltrated with mock (0.25 mM MgCl2) or Pst DC3000 [1.0 x 10⁵ Colony Forming Units (CFU) mL−1] (c) and NtPR1 in leaves of 4-week-old tobacco plants infiltrated with mock (0.25 mM MgCl2) or Ps tabaci 11528 [1.0 x 10⁶ Colony Forming Units (CFU) mL−1] (d) at 24 h post-inoculation (1 dpi) at 23 °C and 28 °C. e, BnaPR1 expression levels in leaves of 4-week-old rapeseed Westar plants 1 day after mock (0.1% DMSO) or 50 µM BTH treatment at 23 °C and 28 °C f, SA marker gene (SlPR1b) expression levels in 4-week-old Castlemart tomato plants 1 day after mock (0.1% DMSO) or 100 µM BTH treatment at 23 °C and 32 °C. g, SA marker gene (OsPR1b) expression levels in 5-week-old rice plants 1 day after mock (0.1% DMSO) or 200 µM BTH treatment at 28 °C and 35 °C. Results show the means ± S.D. [n = 3 (c, e–g) or 4 (a, b, d) biological replicates] from one representative experiment (of three independent experiments) analyzed with two-way ANOVA with Tukey’s HSD for significance. Exact P-values for all comparisons are detailed in the Source Data files
Independence from phyB and ELF3 thermosensors
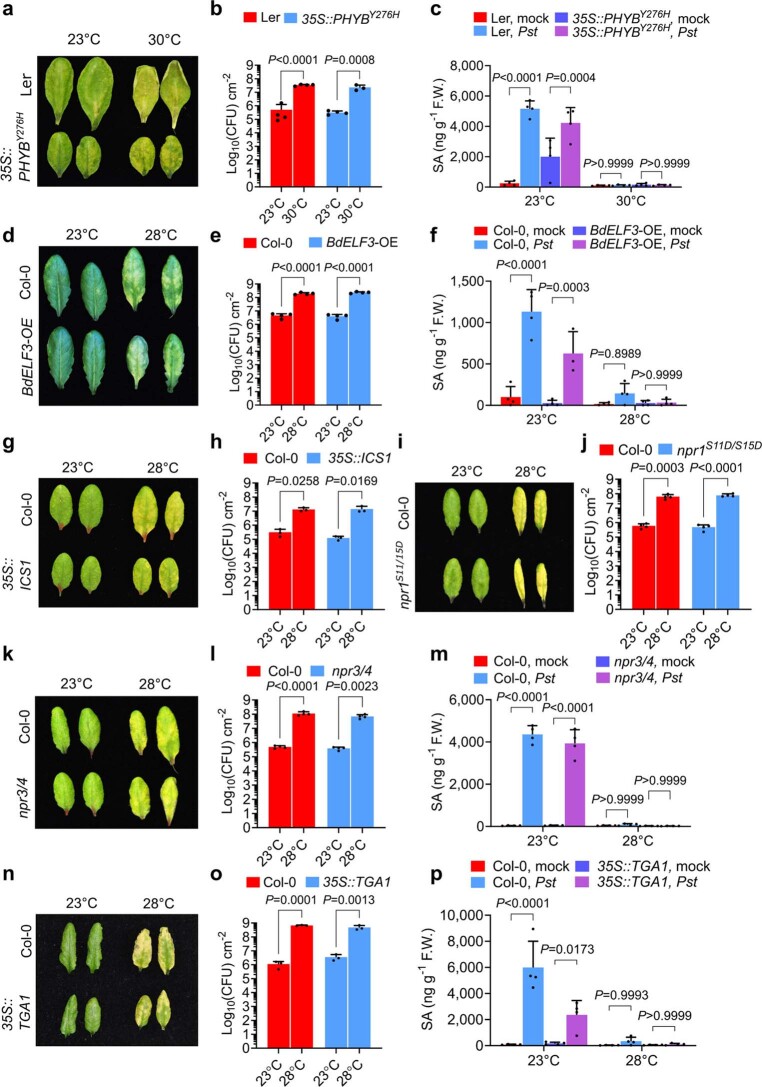
Recent studies showed that phyB8,9 and ELF310 regulate thermo-responsive plant growth and development. To determine whether heat wave suppression of SA production also occurs via these thermosensing mechanisms, we tested constitutively activated phyB (35S::PHYBY276H)8 or ELF3 thermosensor (BdELF3-OE)10 lines that do not exhibit thermo-responsive growth. However, these plants remained temperature-sensitive in pathogen-induced SA accumulation and displayed increased bacterial susceptibility at 28 °C (Extended Data Fig. 2a–f). These results indicate that SA suppression at elevated temperature is independent of phyB or ELF3 thermosensing mechanisms. This agrees with our previous study showing that neither activated phyB nor quadruple mutants in PHYTOCHROME-INTERACTING FACTORS (pif) conferred temperature-resilient basal immunity to Pst DC3000 infection during a simulated heat wave15.
Extended Data Fig. 2. Basal resistance to Pst DC3000 at control (23 °C) and elevated temperature (28–30 °C) in constitutively activated phyB and ELF3 thermosensor lines and in genetically activated SA biosynthetic and signalling mutants.
a–f, Symptom expression at 3 day post-inoculation (dpi) (a, d), in planta Pst DC3000 bacterial levels at 3 dpi (b, e) and SA levels of mock (0.25 mM MgCl2)- and Pst DC3000-inoculated leaves [1.0 x 10⁶ Colony Forming Units (CFU) mL−1] at 1 dpi (c, f) of Ler (a–c), Col-0 (d–f), 35S::PHYBY276H (a–c), and BdELF3-OE (d–f). g–j, Symptom expression at 3 dpi (g, i) and in planta Pst DC3000 bacterial levels at 3 dpi (h, j) of Col-0 (g–j), 35S::ICS1 (g, h), and npr1S11D/S15D (i, j). k–p, Symptom expression at 3 dpi (k,n), in planta Pst DC3000 bacterial levels at 3 dpi (l, o) and SA levels of mock- and Pst DC3000-inoculated leaves at 1 dpi (m, p) of Col-0 (k–p), npr3/4 (k–m), and 35S::TGA1 (n–p). Results show the means ± S.D. [n = 4 (c, e, j, l, m, p) or n = 3 (h, o) biological replicates] from one representative experiment (of three independent experiments) analyzed with two-way ANOVA with Tukey’s HSD for significance. Results show the means ± S.D. [(b) n = 4 biological replicates except 35S::PHYBY276H at 30 °C (n = 3 biological replicates), (f) n = 4 biological replicates except BdELF3-OE, Pst at 23 °C (n = 3 biological replicates)] from one representative experiment (of three independent experiments) analyzed with two-way ANOVA with Tukey’s HSD for significance. Exact P-values for all comparisons are detailed in the Source Data files
Beyond SA biosynthesis and receptor genes
Because ICS1 expression is crucial for SA production21 and is downregulated at elevated temperature15, we next tested whether downregulated ICS1 (Fig. 1b) is the rate-limiting step controlling heat wave-mediated SA suppression. Surprisingly, although constitutive ICS1 expression from the 35S cauliflower mosaic virus (CaMV) promoter resulted in constitutive SA accumulation at 23 °C, as expected, it did not restore pathogen-induced SA at 28 °C and the ICS1-overexpressing plants showed compromised basal immunity at 28 °C, just like wild-type Col-0 plants (Fig. 1d and Extended Data Fig. 2g,h). SA accumulation is also regulated by the SA receptors3,26 (NPR proteins); however, constitutive NPR1 activation using npr1S11D/S15D phosphomimetic lines27 did not restore SA accumulation, and these plants exhibited hypersusceptibility to Pst DC3000 at 28 °C (Fig.1e and Extended Data Fig. 2i,j). Finally, removal of antagonistic SA receptors NPR3 and NPR4 using the npr3 npr4 mutant26 also could not counter suppression of SA immunity at elevated temperature (Extended Data Fig. 2k–m).
Overall, these results highlighted the challenges to identification of the primary, rate-limiting step in the SA pathway that is affected by heat waves based on well-established plant thermosensing8–10 and SA biosynthesis–receptor3,21,26–28 paradigms.
Effect on CBP60g and SARD1 expression
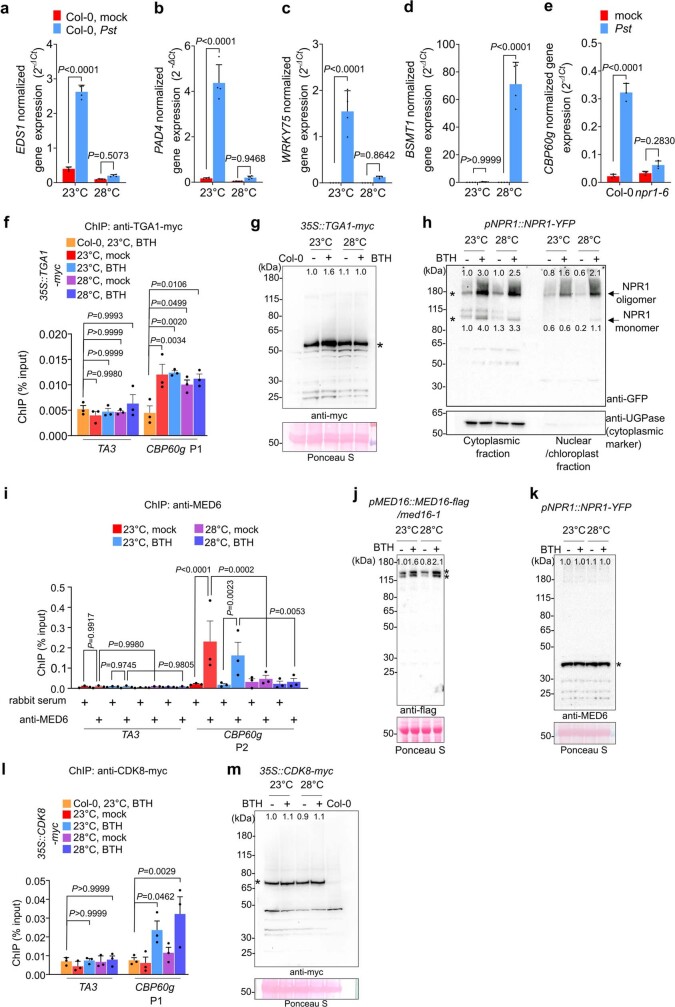
The inability of constitutive ICS1 expression and NPR1 receptor activation to restore SA production at elevated temperature (Fig. 1d,e) led us to pursue a different strategy. We performed RNA sequencing of Pst DC3000-infected Col-0 plants at normal and elevated temperatures. In addition to ICS1, pathogen induction of various SA-associated defence regulators was suppressed at 28 °C (Supplementary Table 1, cluster A and Supplementary Data 2), including EDS1, PAD4 and WRKY75 (Extended Data Fig. 3a–c), whereas the SA catabolic gene BSMT1 was upregulated at 28 °C (Extended Data Fig. 3d). Genes that were downregulated by elevated temperature in cluster A included CBP60g (Fig. 1f) and SARD1 (Supplementary Data 2), which encode functionally redundant ICS1 promoter-binding transcription factors required for SA production29–31. Monitoring a GUS reporter fused to the CBP60g promoter also detected decreased transcript levels at 28 °C (Fig. 1g), indicating that elevated temperature affects CBP60g expression mainly through transcription. Further examination revealed that numerous CBP60g and SARD1 target genes31 were suppressed at 28 °C (Fig. 1h), including many known crucial regulators of basal and systemic immunity (Fig. 1i), raising the possibility that expression of CBP60g or SARD1 may be the primary target in SA suppression at elevated temperature.
Extended Data Fig. 3. Effect of elevated temperature on transcript levels, protein levels and promoter recruitment of SA pathway regulators.
a–d, Endogenous EDS1 (a), PAD4 (b), WRKY75 (c), and BSMT1 (d) transcript levels of samples in Fig. 1b at 24 h after treatment (1 dpi). e, CBP60g gene expression levels in Col-0 and npr1–6 plants at 24 h after Pst DC3000 inoculation [1.0 x 10⁶ Colony Forming Units (CFU) mL−1] at 23 °C. f, ChIP-qPCR analysis of 35S::TGA1-4myc using anti-myc antibody and primer sets indicated in Fig.2f. Binding of TGA1-myc to CBP60g locus is not affected by temperature in mock (0.1% DMSO)- or BTH-treated samples (P-value = 0.7903 and 0.9566, respectively). g, Immunoblot results of 35S::TGA1-myc used for ChIP-qPCR analyses in (f). h, NPR1 immunoblot of NPR1pro::NPR1-YFP plant cytosolic and nuclear protein fractions 24 h after BTH treatment at 23 °C and 28 °C. Both NPR1 oligomers (high molecular weight) and monomers (low molecular weight) are indicated by arrowheads. Anti-UGPase immunoblot is shown as the cytoplasmic marker control. i, ChIP-qPCR results of NPR1pro::NPR1-YFP using anti-MED6 antibody and primer sets indicated in Fig.2f. j, Immunoblot result of MED16pro::MED16-3flag used for ChIP-qPCR analysis in Fig. 2e. k, Immunoblot results of NPR1pro::NPR1-YFP using anti-MED6 antibody used for ChIP-qPCR analyses in (i). l, ChIP-qPCR results of 35S::CDK8-myc using anti-myc antibody and primer sets indicated. m, Immunoblot results of 35S::CDK8-myc using anti-myc antibody used for ChIP-qPCR analyses in (l). For immunoblot (g, j, k, m), stained RuBisCO large subunits are shown as loading controls. Numbers in panels (g, h, j, k, m) indicate relative protein band signal intensities compared to the corresponding band denoted with a * symbol(s). For gel/blot source data, see Supplementary Fig. 1. For ChIP analyses, the TA3 transposon was used as the negative control target locus. Primer positions (P1 for promoter region and P2 for coding region) are indicated in Fig. 2f. Antibody information is included in Supplementary Table 5. Result in (a–e) shows the means ± S.D. [n = 4 (a–d) or 3 (e) biological replicates] from one representative experiment [of three (a–d) or two (e) independent experiments] analyzed with two-way ANOVA with Tukey’s HSD for significance. Results in (g, h, j, k, m) show one representative experiment [of two (g, h) or three (j, k, m) independent experiments]. Results in (f, i, l) are the average ± S.D. [of three independent experiments (n = 3 experiments)], analyzed with two-way ANOVA with Tukey’s HSD for significance. Exact P-values for those comparisons that are greater than 0.05 are detailed in the Source Data files
Thermosensitive GDACs and GBPL3 binding
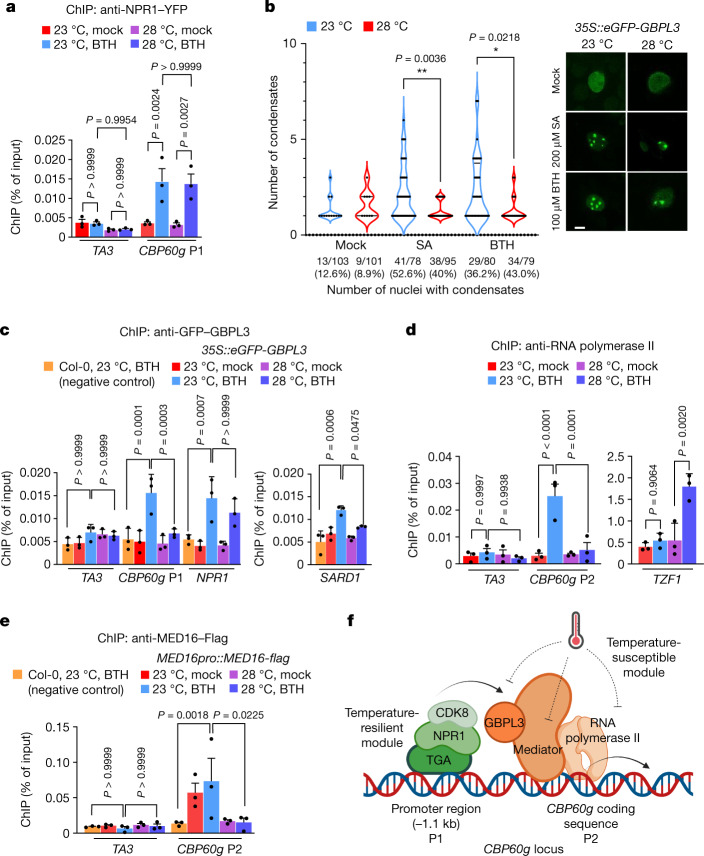
To understand the mechanism by which elevated temperature affects CBP60g transcription, we investigated the effect of elevated temperature on known regulators of CBP60g. The current SA signalling model suggests that NPR receptors interact with TGACG-binding (TGA) transcription factors3,26,28, which regulate CBP60g gene expression (Extended Data Fig. 3e) and SA biosynthesis. However, we found that constitutive TGA1 expression did not restore SA levels at elevated temperature and that 35S::TGA1 plants still exhibited temperature-sensitive basal immunity to Pst DC3000 (Extended Data Fig. 2n–p). In agreement, TGA1 binding to the CBP60g promoter and total TGA1 protein levels were not affected at 28 °C (Extended Data Fig. 3f,g). Similarly, NPR1 recruitment to the CBP60g promoter was similar at 23 °C and 28 °C after chromatin immunoprecipitation (ChIP) (Fig. 2a). Consistent with this result, NPR1 monomerization, which is associated with NPR1 function32, was similar at both temperatures (Extended Data Fig. 3h). Together, these results pointed to an NPR1- and TGA1-independent mechanism for suppressing CBP60g transcription and SA production at elevated temperature.
Fig. 2. Elevated temperature represses CBP60g promoter activity.
Four- to five-week-old Col-0 and indicated transgenic plants were treated with mock (0.1% DMSO) or 100 µM BTH solution and then incubated at 23 °C and 28 °C. ChIP–qPCR and confocal imaging were performed in plants one day after treatment. a, ChIP–qPCR analyses of NPR1pro::NPR1-YFP using anti-GFP antibody and indicated primer sets. The position of the CBP60g primer sequence is shown in f. b, Confocal imaging of eGFP–GBPL3 in 35S::eGFP-GBPL3 infiltrated with mock (0.1% DMSO), 200 µM SA or 100 µM BTH solution at 23 °C or 28 °C 1 day after treatment. Scale bar, 10 μm. c–e, ChIP–qPCR analyses of 35S::eGFP-GBPL3 (c), NPR1pro::NPR1-YFP (d) and MED16pro::MED16-flag (e) plants using the indicated antibodies and primer sets. f, Schematic showing known regulators binding at the CBP60g locus. Temperature-susceptible (green) and temperature-resilient (orange) modules are indicated. Primer positions (P1 for promoter region and P2 for coding region) are indicated. For ChIP analyses, the TA3 transposon was used as the negative control target locus in (a,c–e). A BTH-treated Col-0 sample incubated at 23 °C (c,e) was used as a negative control for immunoprecipitation. Results in (a,c–e) are mean ± s.d. of three independent experiments; two-way ANOVA with Tukey’s HSD. Images in b show one representative experiment (of four independent experiments); one-way ANOVA with Bartlett’s test. Exact P-values greater than 0.05 are shown in the Source Data.
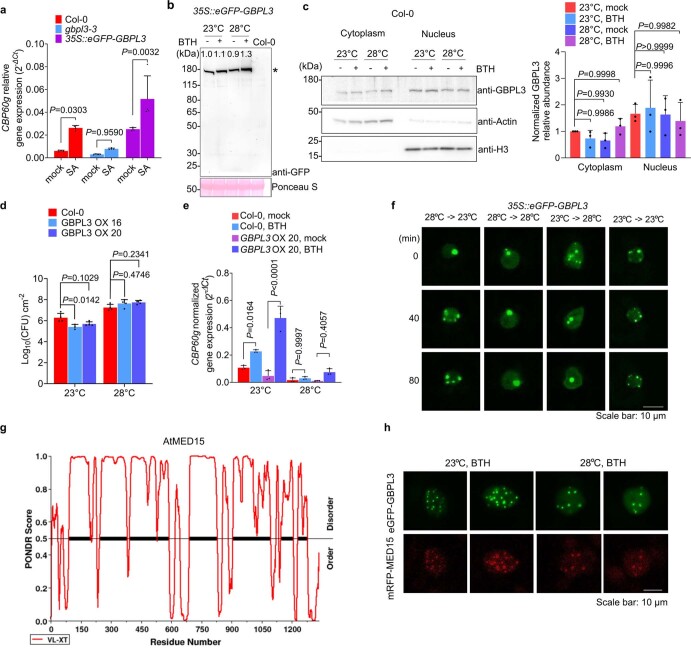
GBPL3 is a key positive regulator of SA signalling and immunity11. We found that GBPL3 is required for CBP60g gene expression in response to SA (Extended Data Fig. 4a). GBPL3 has been proposed to act on promoters via phase-separated biomolecular condensates together with Mediator and RNA polymerase II11 (Pol II). The thermosensor ELF3 contains an intrinsically disordered domain (IDR) that is involved in condensate formation and temperature sensing10. GBPL3 also contains an IDR, which mediates intranuclear GDAC formation11. We therefore tested whether elevated temperature negatively affects GDAC formation and/or GBPL3 recruitment to the CBP60g promoter, which is required for CBP60g transcription. Indeed, the number of GDACs per nucleus was significantly reduced at 28 °C compared with 23 °C (Fig. 2b). Experiments using ChIP with quantitative PCR (ChIP–qPCR) revealed that GBPL3 binding to the promoters of CBP60g and its functionally redundant paralogue SARD1 were markedly reduced at 28 °C in BTH-treated plants (Fig. 2c), even though total GBPL3 protein levels remained similar at both temperatures (Extended Data Fig. 4b,c). Consistent with the observation that the temperature effect is not at the level of GBPL3 expression, GBPL3 overexpression did not restore CBP60g expression (Extended Data Fig. 4d,e). Notably, time-lapse imaging revealed that GDACs appeared reversibly at 23 °C or disappeared at 28 °C in response to temperature shifts, indicating that their formation and dissolution are temporally dynamic (Extended Data Fig. 4f). Furthermore, MED15—another component of the GDAC11 that contains multiple IDRs (Extended Data Fig. 4g)—also showed temperature sensitivity (Extended Data Fig. 4h). GBPL3 and MED15 were co-localized in individual GDACs, as observed previously11, and they either appeared or disappeared together in response to elevated temperature.
Extended Data Fig. 4. Characterization of 35S::eGFP-GBPL3 and GBPL3 OX plants.
a, CBP60g gene expression levels in Col-0, gbpl3-3, and 35S::eGFP-GBPL3 plants at 24 h (1 day) after mock (water) or 200 µM salicylic acid spray at 23 °C. b, Immunoblot results of 35S::eGFP-GBPL3 used for ChIP-qPCR analyses in Fig. 2c. Stained RuBisCO large subunits are shown as loading controls. Numbers in the panel indicate relative protein band signal intensities compared to the corresponding band denoted with a * symbol. c, Subcellular fractionation of Arabidopsis Col-0 leaf cells treated with mock (0.1% DMSO) or BTH for 24h at control (23 °C) or elevated temperature (28 °C). Actin and Histone H3 protein were used as markers of cytoplasmic and nuclear fractions, respectively. d, In planta Pst DC3000 [1.0 x 10⁶ Colony Forming Units (CFU) mL−1] bacterial levels in Col-0, GBPL3 OX #16 and GBPL3 OX #20 plants at 3 dpi. e, CBP60g gene expression levels of Col-0 and GBPL3 OX #20 plants at 24 h after mock (0.1% DMSO) or 100 µM BTH spray at 23 °C or 28 °C. f, Time lapse confocal microscopy of Arabidopsis mesophyll cell expressing eGFP-GBPL3 after transfer to 28 °C from 23 °C or to 23 °C from 28 °C. Scale bar, 10 µm. g, Prediction of intrinsically disordered region in AtMED15 (Threshold score: 0.5). h, Confocal microscopy of Nicotiana tabacum mesophyll cells transiently expressing eGFP-GBPL3 and mRFP-MED15 at 23 °C and 28 °C. Six to seven weeks old N. tabacum leaves were infiltrated with Agrobacterium harbouring 35S::eGFP-GBPL3 or 35S::mRFP-MED15-flag. After incubation for 3 days at control temperature, the plants were treated with 100 µM BTH solution and shifted to 23 °C or 28 °C. After 1 day, mesophyll cells were visualized by confocal microscopy. Scale bar, 10 µm. Results in (a, d, e) show the means ± S.D. [(a) n = 4, (d) n = 4 except GBPL3 OX 16 at 23 °C (n = 3 biological replicates), or (e) n = 3 biological replicates] from one representative experiment (of two independent experiments), analyzed with two-way ANOVA with Tukey’s HSD for significance. Results in (b, left panel of c) show one representative experiment (of three independent experiments). Result in (right panel of c) shows the means ± S.D. (of three independent experiments) analyzed with one-way ANOVA with Bartlett’s test for significance. Results in (f, h) show one representative experiment (of two independent experiments). Exact P-values for all comparisons are detailed in the Source Data files
GPBL3 specificity on CBP60g and SARD1 loci
We found that elevated temperature-mediated suppression of GBPL3 recruitment occurs selectively at certain loci, but not at all GBPL3 target sites. For example, elevated temperature suppressed GBPL3 recruitment to CBP60g and SARD1, but not to NPR1 (Fig. 2c), which is consistent with temperature-resilient NPR1 transcript levels15. Of note, we observed that despite a significantly reduced number of GDACs per nucleus, elevated temperature did not decrease the number of nuclei that contained GDACs (Fig. 2b). Collectively, our data indicate that there appear to be two subpopulations of GDACs in vivo. One subpopulation is sensitive to 28 °C (the one associated with GBPL3 recruitment to the CBP60g promoter) and the other is insensitive to 28 °C (the one associated with GBPL3 recruitment to the NPR1 promoter).
Next, we investigated whether altered GBPL3 condensate formation and reduced GBPL3 binding to the CBP60g promoter at 28 °C is linked to impaired recruitment of Pol II and Mediator subunits. As shown in Fig. 2d, elevated temperature suppressed BTH-induced Pol II association with the CBP60g promoter, but not with the promoter of a control gene TZF1, which is highly induced by BTH at elevated temperature15. Furthermore, elevated temperature significantly reduced CBP60g promoter binding by MED16, a Mediator tail subunit associated with SA gene expression33 (Fig. 2e). Binding of the Mediator head subunit MED6 to the CBP60g promoter was also significantly reduced at 28 °C compared with 23 °C (Extended Data Fig. 3i). Differential Mediator subunit recruitment was not owing to changes in protein abundance, since protein levels of MED16 and MED6 remained the same at 23 °C and 28 °C (Extended Data Fig. 3j,k). Notably, not all Mediator components were affected at elevated temperature, as the level and binding of CDK8—a Mediator kinase module subunit that interacts with NPR1 to regulate SA signalling34—were similar at 23 °C and 28 °C (Extended Data Fig. 3l,m). These results indicate that elevated temperature selectively affects the recruitment of GBPL3 and several SA pathway-relevant Mediator complex subunits to the CBP60g promoter, independently of the NPR1–TGA1–CDK8 module (Fig. 2f).
CBP60g and SARD1 expression is rate-limiting
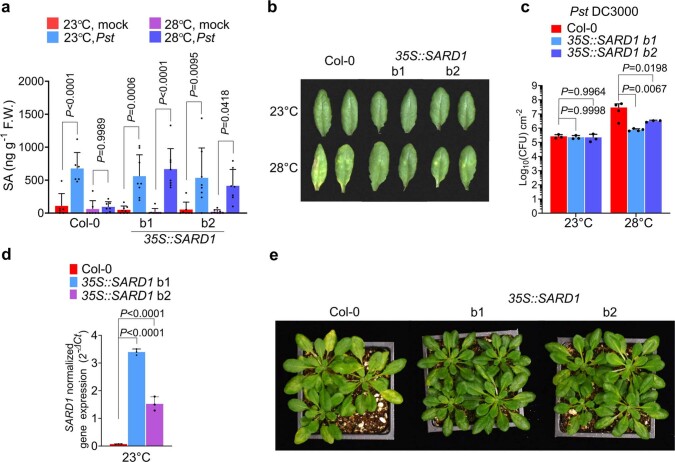
The identification of CBP60g and SARD1 transcription as the primary thermo-sensitive step in the SA pathway downstream of GBPL3 prompted us to test whether expression of CBP60g and SARD1 is a rate-limiting step for SA production at elevated temperature and, if so, whether restoring CBP60g and SARD1 expression would sufficiently render SA production resilient to increased temperature. Unlike expression of the activated SA receptor gene NPR1 or the SA biosynthetic gene ICS1 (Fig. 1d,e and Extended Data Fig. 2g–j), 35S::CBP60g and 35S::SARD1 lines restored pathogen-induced SA production and maintained basal immunity to Pst DC3000 at 28 °C, in contrast to Col-0 plants (Fig. 3a–c and Extended Data Figs. 5a–d and 6a–e). Because CBP60g and SARD1 are functionally redundant35, temperature-sensitive immunity to Pst DC3000 remained in the cbp60g single mutant, as expected (Extended Data Fig. 5e–g).
Fig. 3. Restoration of SA accumulation and immunity at elevated temperature in 35S::CBP60g plants.

Wild-type Col-0 and 35S::CBP60g plants were syringe-infiltrated with mock (0.25 mM MgCl2) or Pst DC3000 (106 CFU ml−1) and incubated at 23 °C or 28 °C. a, SA levels in mock- and Pst DC3000-inoculated plants at 24 h (1 dpi). b, Images of leaves from Pst DC3000-inoculated plants at 3 dpi. c, In planta Pst DC3000 bacterial levels at 3 dpi. d,e, In planta Pst DC3000 (avrPphB) (d) or Pst DC3000 (avrRps4) (e) bacterial levels at 3 dpi. f, Heat map of RNA-seq reads for genes that are downregulated in Col-0 grown at 28 °C but fully or partially restored in 35S::CBP60g grown under the same conditions. RPKM, reads per kilobase of transcript per million mapped reads. Data in a,c,e are mean ± s.d. (n = 4 biological replicates) of one representative experiment (out of three independent experiments) analysed by two-way ANOVA with Tukey’s HSD. Results in d are mean ± s.d. (n = 4 biological replicates except 35S::CBP60g at 23 °C (n = 3 biological replicates)) of one representative experiment (out of three independent experiments) analysed by two-way ANOVA with Tukey’s HSD. Exact P-values for all comparisons are shown in the Source Data.
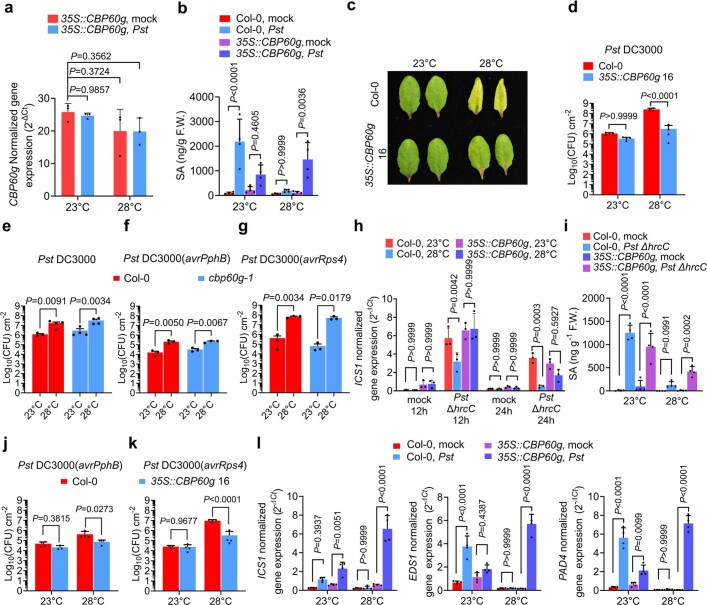
Extended Data Fig. 5. Characterization of 35S::CBP60g 16 and cbp60g-1 plants.
a, CBP60g transcript levels in 4-week old 35S::CBP60g at 23 °C or 28 °C 1 day after mock (0.25 mM MgCl2) treatment or Pst DC3000 infection [1.0 x 10⁶ Colony Forming Units (CFU) mL−1]. b–d, SA levels at 1 dpi (b), symptom expression at 3 dpi (c) and in planta Pst DC3000 [1.0 x 10⁶ Colony Forming Units (CFU) mL−1] bacterial levels at 3 dpi (d) of Col-0 and 35S::CBP60g 16 plants. e–g, bacterial levels in Col-0 and cbp60g-1 plants inoculated with Pst DC3000 (e), Pst DC3000 (avrPphB) (f), and Pst DC3000 (avrRps4) (g) at 3 dpi. h, ICS1 gene expression levels in Pst DC3000 ΔhrcC-infected Col-0 and 35S:CBP60g plants [1.0 x 10⁸ Colony Forming Units (CFU) mL−1] at 12- and 24-h post-inoculation (hpi). i, SA levels in Pst DC3000 ΔhrcC-infected Col-0 and 35S:CBP60g plants (1.0 x 10⁸ Colony Forming Units (CFU) mL−1) at 24 h post-inoculation. j–k, In planta Pst DC3000 (avrPphB) (j), and (avrRps4) (k) bacterial levels of Col-0 and 35S::CBP60g 16 plants at 3 dpi. l, ICS1, EDS1 and PAD4 gene expression levels of Col-0 and 35S::CBP60g plants 1 day after mock (0.25 mM MgCl2)- and Pst DC3000-infiltration [1.0 x 10⁶ Colony Forming Units (CFU) mL−1]. Results show the means ± S.D. [n = 3 (a, f, g, h) or 4 (b, d, i) biological replicates] from one representative experiment [of two (a, h, i) or three (b, d, f, g) independent experiments] analyzed with two-way ANOVA with Tukey’s HSD for significance. Results in (e) show the means ± S.D. [n = 4 biological replicates except Col-0 at 23 °C (n = 3 biological replicates)] from one representative experiments (of three independent experiments) analyzed with two-way ANOVA with Tukey’s HSD for significance. Results in (j) show the means ± S.D. [n = 4 (Col-0) or 3 (35S::CBP60g 16) biological replicates] from one representative experiments (of three independent experiments) analyzed with two-way ANOVA with Tukey’s HSD for significance. Results in (k) show the means ± S.D. [n = 4 biological replicates except 35S::CBP60g 16 at 23 °C (n = 3 biological replicates)] from one representative experiments (of three independent experiments) analyzed with two-way ANOVA with Tukey’s HSD for significance. Exact P-values for those comparisons that are greater than 0.05 are detailed in the Source Data files
Extended Data Fig. 6. Characterization of 35S::SARD1 plants.
a–c, SA levels at 24 h (a), symptom expression at day 3 (b), in planta bacterial levels at day 3 (c) post-inoculation with mock (0.25 mM MgCl2) or Pst DC3000 solution [1.0 x 10⁶ Colony Forming Units (CFU) mL−1]. d, SARD1 gene expression levels in 4-week-old plants of Col-0 and 35S::SARD1. e, Appearance of 4.5-week-old Col-0 and 35S::SARD1 plants (lines b1 and b2) grown at 23 °C were infiltrated with 1 x 10⁶ CFU mL−1 Pst DC3000 and further incubated at 28 °C for 3 days. Results in (a) show the means ± S.D. [n = 6 (Col-0, 23 °C mock and Col-0, 23 °C Pst), 7 (Col-0, 28 °C mock and Col-0, 28 °C Pst), 8 (all 35S::SARD1 b1 line data), 7 (35S::SARD1 b2 line, 23 °C mock), 8 (35S::SARD1 b2 line, 23 °C Pst), 8 (35S::SARD1 b2 line, 28 °C mock), or 7 (35S::SARD1 b2 line, 28 °C Pst) biological replicates from two independent experiments] analyzed with two-way ANOVA with Tukey’s HSD for significance. Results in (c) show the means ± S.D. [n = 3 (Col-0 at 23 °C), 4 (Col-0 at 28 °C), 3 (35S::SARD1 b1 at 23 °C), 4 (35S::SARD1 b1 at 28 °C), or 3 (35S::SARD1 b2 at 23 °C and 28 °C) biological replicates] from one representative experiments (of four independent experiments) analyzed with two-way ANOVA with Tukey’s HSD for significance. Results in (d) show the means ± S.D. (n = 3 biological replicates) from one representative experiments (of two independent experiments) analyzed with one-way ANOVA with Bartlett’s test for significance. Result in (e) shows one representative experiment of four independent experiments. Exact P-values for those comparisons that are greater than 0.05 are detailed in the Source Data files
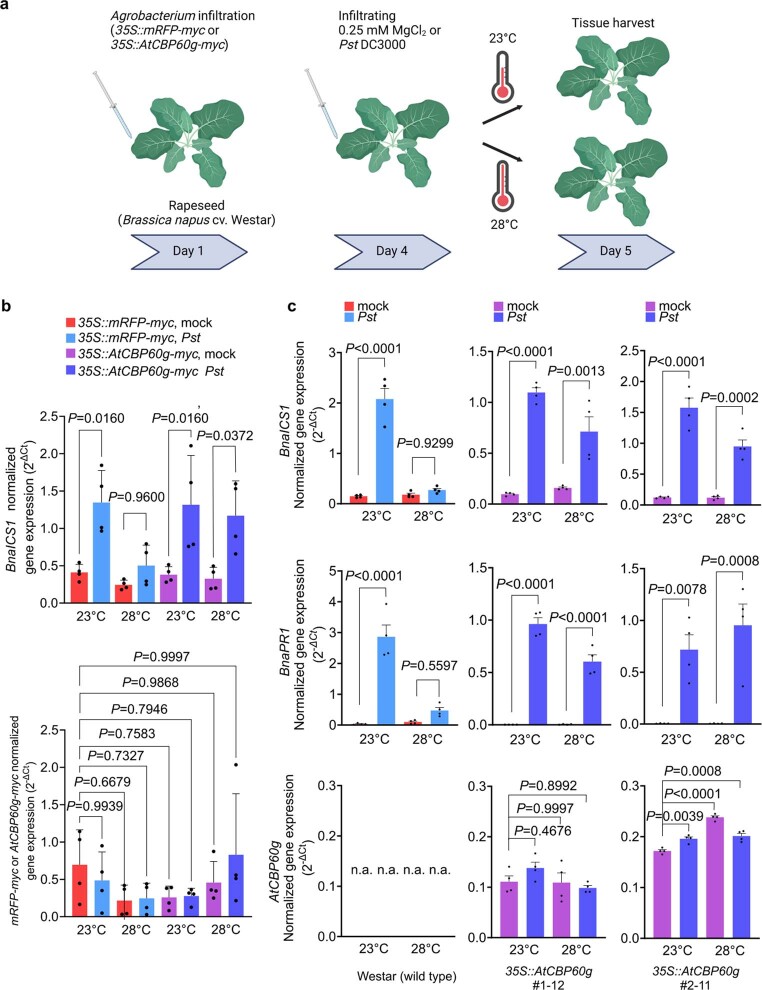
In addition to restoring basal immunity to the virulent pathogen Pst DC3000, the temperature-resilient SA production and gene expression in 35S::CBP60g plants extends to infection by the non-pathogenic strain Pst ΔhrcC, which activates PTI in vivo (Extended Data Fig. 5h,i), and to infection by ETI-activating Pst DC3000(avrPphB) and Pst DC3000(avrRps4)28,36 (Fig. 3d,e and Extended Data Fig. 5j,k). Because ETI is widely used to guard crops against pathogens and insects28,36, these results suggest potentially broad applications of restoring CBP60g expression to counter suppression of not only basal immunity to virulent pathogens, but also ETI at elevated temperature. Finally, as shown in Extended Data Figs. 1 and 7, elevated temperature downregulated SA-response gene expression in both Arabidopsis and in crop plants such as tobacco and rapeseed. Both transient and stable AtCBP60g expression substantially restored Pst DC3000-induced expression of the ICS1 and PR1 orthologues BnaICS1 and BnaPR1, respectively, in rapeseed leaves at elevated temperature (Extended Data Fig. 7a–c).
Extended Data Fig. 7. BnaICS and BnaPR1 transcript levels in transgenic rapeseed plants expressing AtCBP60g-myc.
a, A schematic diagram of experimental flow using Agrobacterium-mediated transient expression system. b, Transcript levels of BnaICS1 and myc-tagged transgenes (mRFP-myc or AtCBP60g-myc) in mock (0.25 mM MgCl2)- or Pst DC3000-infiltrated [1.0 x 10⁵ Colony Forming Units (CFU) mL−1] rapeseed leaves at 1 dpi. Leaves were pre-infiltrated with Agrobacterium suspension 3 days before mock or Pst DC3000 treatment. Results in (b) are the means ± S.D. (n = 4 biological replicates from two independent experiments). Statistical analysis was performed using two-way ANOVA with Tukey’s HSD. The experiment was repeated four times with similar results. c, Transcript levels of BnaICS1, BnaPR1 and AtCBP60g-myc in mock- or Pst DC3000-infiltrated [1.0 x 10⁵ Colony Forming Units (CFU) mL−1] wild-type and two independent 35S::AtCBP60g-myc transgenic rapeseed leaves. AtCBP60g transcript level in each leaf sample was quantified (bottom row). No AtCBP60g transcript was detected in Westar samples as control, whereas AtCBP60g transcript was detected in each 35S::AtCBP60g-myc sample. Data in (c) are the means S.E.M. (n = 4 biological replicates). The experiment was repeated twice. Statistical analysis was performed using two-way ANOVA with Tukey’s HSD. n.a., not applicable. Exact P-values for those comparisons that are greater than 0.05 are detailed in the Source Data files
Consistent with their immune phenotypes, 35S::CBP60g Arabidopsis plants had restored pathogen-induced expression of CBP60g target genes ICS1, EDS1 and PAD4 at 28 °C (Extended Data Fig. 5l). Further RNA sequencing of pathogen-inoculated Col-0 and 35S::CBP60g plants at 23 °C and 28 °C identified additional downregulated immunity genes that were also substantially restored in 35S::CBP60g plants (Fig. 3f and Supplementary Data 3 and 4). This included SA biosynthesis genes ICS1 and PBS3 as well as the pattern recognition receptor genes RLP23 and LYK5, the PTI signalling gene MKK4, and the pipecolic acid biosynthesis gene ALD1 (Fig. 1i and Supplementary Data 2). Thus, 35S::CBP60g seems to safeguard other defence modules besides SA biosynthesis, consistent with previous observations that CBP60g is a master transcription factor regulating diverse sectors of the plant immune system31. In line with this notion, SA-deficient ics1 mutant plants (sid2-2) still exhibit some temperature sensitivity, albeit much less than wild-type Col-0 plants15 (Extended Data Fig. 8a,b). This more general role of CBP60g in the plant immune system may partly explain why 35S::CBP60g plants (Fig. 3 and Extended Data Fig. 5a–d), but not 35S::ICS1 plants (Extended Data Fig. 2g,h), can recover basal immunity at 28 °C.
Extended Data Fig. 8. Pst DC3000 bacterial population levels in Arabidopsis Col-0 and the ics1 mutant.
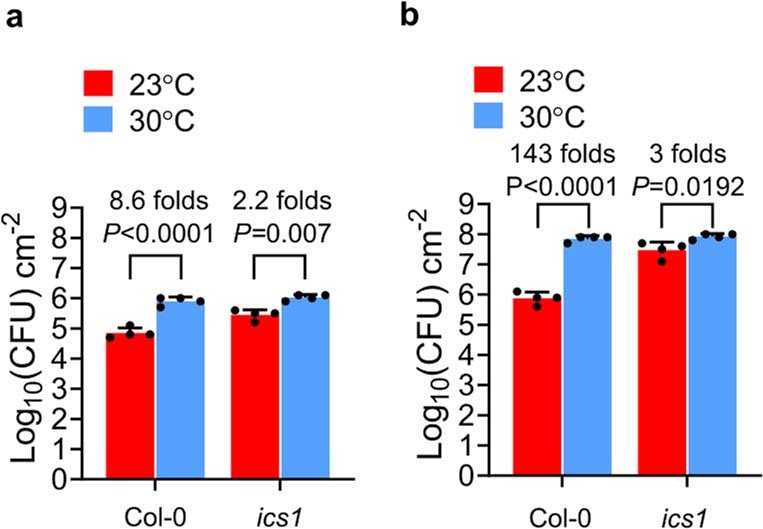
a–b, In planta Pst [1.0 x 10⁶ Colony Forming Units (CFU) mL−1] bacterial levels in Col-0 and ics1 (i.e., sid2-2) plants at 23 °C and 30 °C at 1 (a) and 3 (b) dpi. Data are the means ± S.D. (n = 4 biological replicates). The experiment was repeated three times. Statistical analysis was performed using two-way ANOVA with Tukey’s HSD. Exact P-values for all comparisons are detailed in the Source Data files
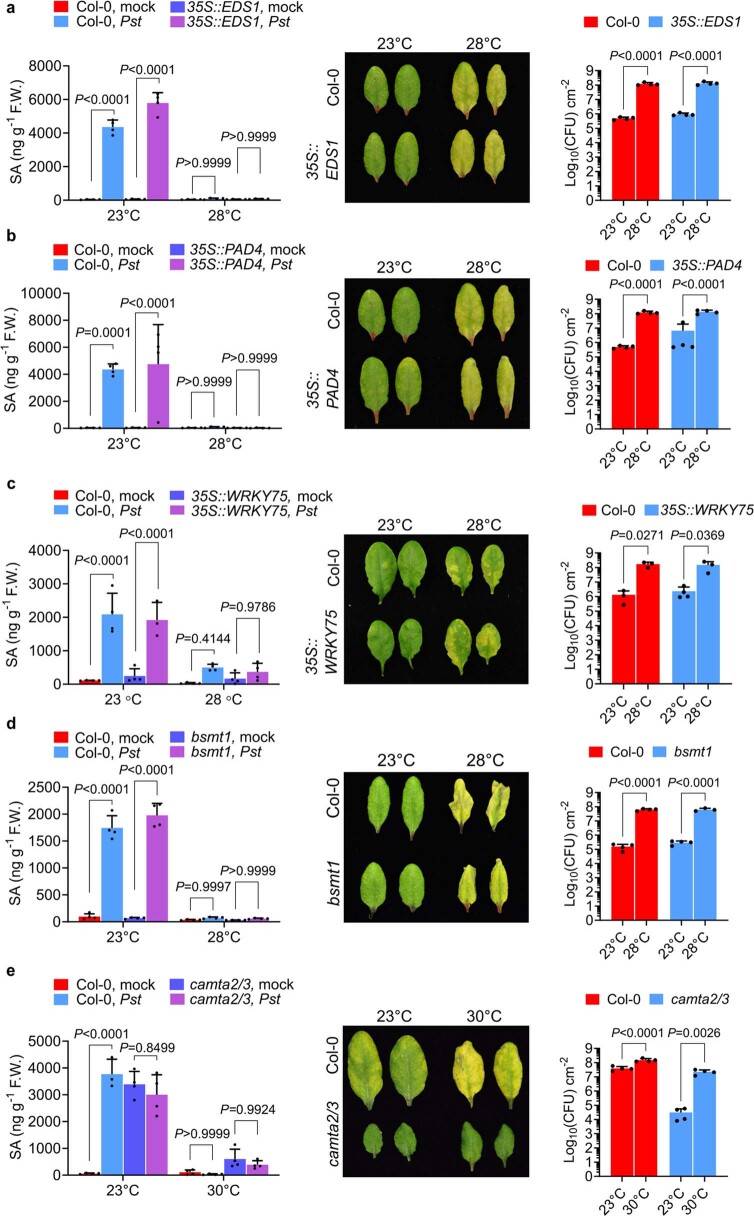
Notably, restoration of SA production and immunity in 35S::CBP60g/SARD1 plants appears to be unique among known SA pathway regulators. Constitutively expressing other elevated temperature-downregulated positive SA regulators, including ICS1, TGA1, EDS1, PAD4 or WRKY753,28, did not restore SA production or basal immunity (Extended Data Fig. 2g, h and Extended Data Figs. 2n–p and 9a–c). Similarly, loss-of-function mutations in heat-upregulated SA catabolic gene BSMT1 and SA transcriptional repressor genes CAMTA2/3 did not restore SA levels and basal immunity at 28 °C (Extended Data Fig. 9d,e). Additionally, we previously showed that gene mutations in jasmonate, abscisic acid or ethylene hormone pathway or DELLA-regulated PIFs, which are genetically antagonistic to the SA pathway, did not revert SA suppression by elevated temperature15. These results illustrate that CBP60g and SARD1 are distinct regulators of the SA pathway, and the levels of these proteins become rate-limiting for controlling ICS1-dependent and -independent immunity at elevated temperature.
Extended Data Fig. 9. SA accumulation and basal immunity to Pst DC3000 at elevated temperature in plants altered in positive and negative SA regulators.
a–e, SA levels at 1 dpi (left panels), symptom expression at 3 dpi (middle panels) and in planta Pst DC3000 bacterial levels at 3 dpi (right panels) of Col-0 (a–e) and 35S::EDS1 (a), 35S::PAD4 (b), 35S::WRKY75 (c), bsmt1 (d) and camta2/3 plants (e) [1.0 x 10⁶ Colony Forming Units (CFU) mL−1]. Results show the means ± S.D. [n = 4 (a, b) biological replicates] from one representative experiment (of three independent experiments) analyzed with two-way ANOVA with Tukey’s HSD for significance. Results in (c) show the means ± S.D. [left panel: n = 4 biological replicates except 35S::WRKY75, Pst at 23 °C (n = 3 biological replicates); right panel: n = 3 biological replicates except 35S::WRKY75 at 23 °C (n = 4 biological replicates)] from one representative experiment (of three independent experiments) analyzed with two-way ANOVA with Tukey’s HSD for significance. Results in (d) show the means ± S.D. [left panel: n = 4 biological replicates; right panel: n = 4 biological replicates except bsmt1, Pst at 28 °C (n = 3 biological replicates)] from one representative experiment (of three independent experiments) analyzed with two-way ANOVA with Tukey’s HSD for significance. Results in (e) show the means ± S.D. [left panel: n = 4 biological replicates except Col-0, Pst at 23 °C (n = 3 biological replicates); right panel: n = 4 biological replicates] from one representative experiment (of three independent experiments) analyzed with two-way ANOVA with Tukey’s HSD for significance. Exact P-values for all comparisons are detailed in the Source Data files
Optimization of growth versus defence
A common issue with increasing expression levels of SA regulators is the inhibition of plant growth and reproduction due to the growth–defence trade-off37,38. This is illustrated with 35S::ICS1 plants, which have highly elevated basal SA levels at ambient temperature (Fig.1d) and show reduced growth (Extended Data Fig. 10a,b). Of note, the growth of 35S::CBP60g and 35S::SARD1 plants was less adversely affected compared with 35S::ICS1 plants (Extended Data Figs. 6e and 10a, b), consistent with low basal SA levels in 35S::CBP60g and 35S::SARD1 plants (Fig. 3a and Extended Data Figs. 5b and 6a). Nevertheless, detailed characterization of 35S::CBP60g plants showed a delay in flowering (Extended Data Fig. 10c). To minimize this developmental trade-off, we expressed CBP60g using the uORFsTBF1 strategy (Extended Data Fig. 10d), which enabled tightly controlled protein translation in response to pathogen infection39. As shown in Fig. 4a–c, 35S::uORFsTBF1-CBP60g plants maintained basal Pst DC3000 resistance and pathogen-induced SA production at 28 °C. These plants also maintained substantial ETI against Pst DC3000(avrPphB) and Pst DC3000(avrRps4) at elevated temperature (Fig. 4d). Of note, 35S::uORFsTBF1-CBP60g plants showed normal growth and flowering time (Fig. 4e and Extended Data Fig. 10a), demonstrating the promise of leveraging calibrated CBP60g expression to preserve plant immunity without detrimental growth or developmental effects.
Extended Data Fig. 10. Characterization of 35S::ICS1, 35S::CBP60g and uORF-CBP60g plants.
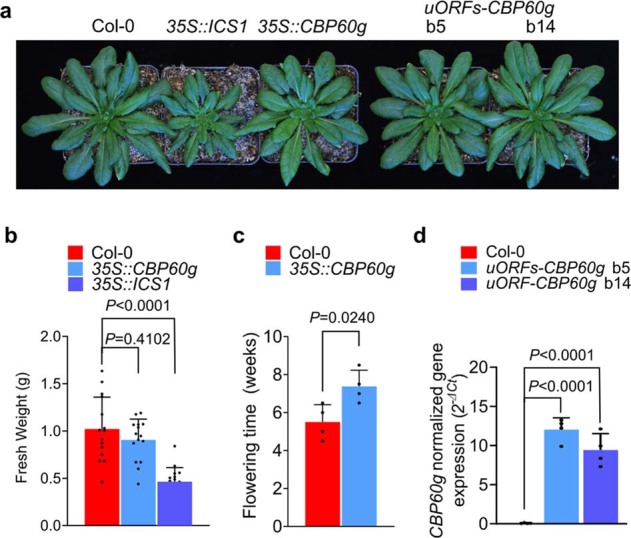
a, Appearance of 6-week-old Col-0, 35S::ICS1, 35S::CBP60g and uORFs-CBP60g plants. b, Quantification of fresh weights of 6-week-old Col-0, 35S::ICS1, 35S::CBP60g. c, Flowering time phenotypes of Col-0 and 35S::CBP60g plants. d, CBP60g transcript levels in 4-week old Col-0, and 35S::uORFs-CBP60g plants measured by RT-qPCR. Results in (b) show the means ± S.D. [n = 15 (Col-0, 35S::CBP60g), n = 16 (35S::ICS1) biological replicates] from one representative experiment (of two independent experiments) analyzed with one-way ANOVA with Bartlett’s test for significance. Results in (c) show the means ± S.D. (n = 4 biological replicates) from one representative experiment (of two independent experiments) with two-tailed Student’s t-test. Results in (d) show the means ± S.D. (n = 4 biological replicates of two independent experiments) analyzed with one-way ANOVA with Bartlett’s test for significance. Exact P-values for all comparisons are detailed in the Source Data files
Fig. 4. Optimized CBP60g expression leads to temperature-resilient SA defences without growth or developmental trade-offs.
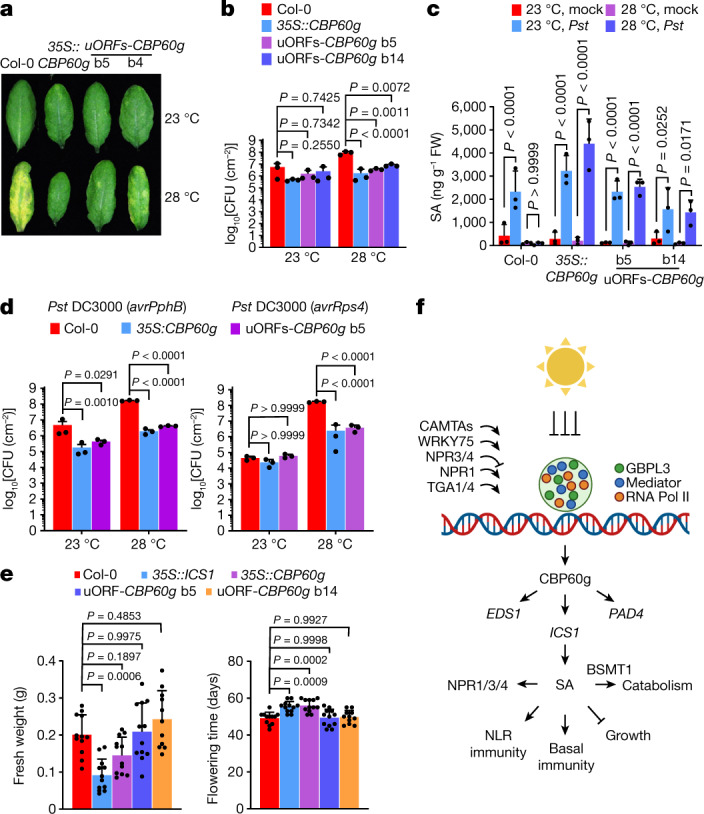
Col-0, 35S::CBP60g and 35S::uORFsTBF1-CBP60g plants were syringe-infiltrated with mock (0.25 mM MgCl2) or Pst DC3000 solution (106 CFU ml−1) and then incubated at 23 °C and 28 °C. a, Foliar disease symptoms were evaluated at 3 dpi. b, In planta Pst DC3000 bacterial levels in samples in a at 3 dpi. c, SA levels in samples in a at 1 dpi. d, In planta Pst DC3000 (avrPphB) and Pst DC3000 (avrRps4) bacterial levels at 3 dpi. e, Fresh weight (left) at day 28 and flowering time (right) for the indicated plant genotypes. f, A working model of how elevated temperature targets the SA defence and immune network through CBP60g expression. At normal growth temperature, infection induces CBP60g gene expression. CBP60g regulates various defence genes, including those involved in SA accumulation (such as ICS1, EDS1 and PAD4). At elevated temperature, recruitment of Mediator, GBPL3 and RNA Pol II to the CBP60g locus is impaired, leading to lower SA production and reduced immunity at elevated temperature. Data in b–d are mean ± s.d. (n = 3 biological replicates) from one representative experiment (out of three independent experiments) analysed by two-way ANOVA with Tukey’s HSD. Data in e are mean ± s.d. (n = 12 biological replicates) from one representative experiment (out of three independent experiments), analysed by one-way ANOVA with Bartlett’s test. Exact P-values greater than 0.05 are shown in the Source Data.
Discussion
We have identified CBP60g transcription as a major thermosensitive step in the plant immune system (Fig. 4f). Mechanistically, we observed that elevated temperature negatively affects nuclear GDAC formation and recruitment of GBPL3 and SA-relevant Mediator subunits to the CBP60g promoter. We identified two GDAC subpopulations in vivo—one sensitive to growth at 28 °C (associated with GBPL3 recruitment to the CBP60g promoter), whereas the other was insensitive to growth at 28 °C (associated with GBPL3 recruitment to the NPR1 promoter). The two GDAC subpopulations could arise from different affinities for the respective promoters, access to different chromatin microenvironments, or the interacting client protein partners involved.
Recent studies have begun to implicate protein condensate formation in the environmental regulation of plant growth10, flowering40 and germination41. Together with these studies, our results support an emerging general concept that biomolecular condensates serve as an important regulatory node for plant sensing and/or response to external temperature and other environmental cues. CBP60g family transcription factors are widely conserved across plant lineages12. 35S::CBP60g-mediated temperature resilience applies to both basal and ETI-mediated pathogen resistance, suggesting that the basic findings in this study, with further optimization, may provide a framework for broadly preserving the overall function of the plant immune system in a warming climate.
Methods
Plant materials
A. thaliana plants were grown in soil (2:1 Arabidopsis Mix: perlite) covered with or without standard Phifer glass mesh for 3–4 weeks at 21 °C–23 °C and 60% relative humidity under a 12 h light/12 h dark regimen (100 ± 10 µmol m−2 s−1). Accessions, mutants and transgenic lines are outlined in Supplementary Table 3. All experiments with 35S::CBP60g were performed with line no. 17, unless otherwise specified.
Seeds of rapeseed (Brassica napus) cultivar Westar, tomato (Solanum lycopersicum) cultivar Castlemart, and tobacco (Nicotiana tabacum) cultivar Xanthi were grown in Arabidopsis Mix soil supplemented with 1 g l−1 of 20-20-20 general purpose fertilizer (Peters Professional). After 2 days of imbibition, plants were grown in growth chambers (20 °C/18 °C, 16 h day/8 h night for rapeseed; 23 °C/23 °C; 12 h day/12 h night for tomato and tobacco) for 4–7 weeks.
Seeds of rice (Oryza sativa) cultivar Nippponbare were germinated on wet filter paper in petri dishes and 4- to 5-day-old seedlings were transplanted to Redi-earth soil. Seedlings were grown at 28 °C (16 h day/8 h night) for 4–5 weeks.
Generation of constructs and transgenic lines
To generate transgenic Arabidopsis harbouring 35S::uORFsTBF1-CBP60g, 35S::TGA1-4myc, or 35S::SARD1, genomic DNA (CBP60g, TGA1) or coding sequences (SARD1) were amplified and ligated into pENTR D-TOPO (Invitrogen). To clone TBF1 uORF sequence, PCR-amplified uORFsTBF139 amplicon was ligated into pENTR-AtCBP60g using HiFi DNA Assembly (New England Biolabs). The uORFsTBF1-CBP60g, TGA1 or SARD1 construct was subcloned to pGWB517 through Gateway Cloning (Invitrogen). Plasmids carrying gene constructs were transformed into Agrobacterium tumefaciens GV3101, which was used for Arabidopsis transformation by floral dipping42. T1 plants were selected on half-strength Murashige and Skoog medium supplemented with hygromycin (35 mg l−1) and 1% sucrose. Homozygous T2 and T3 transgenic plants were analysed.
To generate 35S::ICS1 plants, the ICS1 cDNA was amplified from RNA extracted from infected Arabidopsis leaves and ligated into pCR Blunt TOPO (Invitrogen). Full-length cDNA with chloroplast transit sequence was confirmed and the 35S::ICS1 construct was subcloned into pCAMBIA3301 modified to remove the GUS reporter and to include a C-terminal V5-His6 tag (Invitrogen) resulting in pSM200-1. pSM200-1 was transformed into A. tumefaciens GV3101 and used to transform Arabidopsis eds16-1 mutant by floral dipping42. T1 plants were selected for glufosinolate tolerance using Finale and surviving plants were selfed and tested for presence of the insert using PCR. Homozygous T4 transgenic plants were analysed.
To generate transgenic rapeseed harbouring 35S::AtCBP60g-myc, the AtCBP60g coding sequence, amplified from Arabidopsis cDNA, or the corresponding genomic sequence was cloned into pGWB517 through Gateway reaction (Invitrogen). The binary vector was introduced into A. tumefaciens GV3101 by electroporation. B. napus cultivar Westar were transformed using Agrobacterium-mediated method43. After 7-day explant-recovery period following co-cultivation on MS medium with benzyladenine (3 mg l−1), and timentin antibiotic (300 mg l−1) to eliminate Agrobacterium, putative transformants with roots (T0) were transferred to soil. Genomic DNA was extracted from young leaves using cetyltrimethylammonium bromide method and used for PCR detection of transgene. Two primer pairs for the hygromycin phosphotransferase (HPT) and AtCBP60g genes in the transgene were used to assess transformation. About ten T0 transgenic lines were used to produce T1 transgenic plants by self-pollination. RT–qPCR was used to screen for independent T1 transgenics that robustly expressed the AtCBP60g transcript. 35S::AtCBP60g line no. 1-12 was derived from the cDNA construct, whereas 35S::AtCBP60g line no. 2-11 was derived from the genomic DNA construct.
PCR primers are listed in Supplementary Table 4 and sequences were confirmed by Sanger sequencing.
Agrobacterium-mediated transient expression in rapeseed and tobacco
For transient expression in rapeseed, Agrobacterium GV3101 harbouring 35S::mRFP-4myc or 35S::AtCBP60g-4myc was grown in Luria-Bertani (LB) medium, resuspended in infiltration buffer (10 mM MES (pH 5.7), 10 mM MgCl2 and 500 µM acetosyringone) at OD600 = 0.1, and infiltrated to the first and second true leaves of rapeseed plants using a needleless syringe. For transient expression in tobacco (N. tabacum), Agrobacterium GV3101 harbouring 35S::eGFP-GBPL3 or 35S::mRFP-MED15-flag was grown in LB medium, resuspended in the same infiltration buffer at OD600 = 0.1, and infiltrated to fully expanded leaves of tobacco plants using a needleless syringe. Agroinfiltrated rapeseed or tobacco plants were incubated for 2–3 days at 21–23 °C before experiments.
Temperature conditions
Based on previous studies15,44–46, Arabidopsis plants were acclimated at 23 °C (ambient) or 28 °C (elevated) for 24 h before chemical treatment and/or 48 h before pathogen infiltration, unless otherwise specified. Four- to five-week-old rapeseed plants were incubated at ambient (23 °C) or elevated temperatures (28 °C) for 48 h before pathogen infiltration or chemical treatments. Four- to five-week-old tomato plants were incubated at ambient (23 °C) or elevated temperatures (28 °C–32 °C) for 48 h before chemical treatments. Five-week-old rice plants were incubated at ambient (28 °C) or elevated temperatures (35 °C) before chemical treatments. Four- to seven-week-old tobacco plants were incubated at ambient (23 °C) or elevated temperatures (28 °C) for 48 h before chemical treatments. All plants were grown with a 12 h day/12 h night cycle, except for rice and rapeseed plants, which were grown with a 16 h day/8 h night cycle.
Growth and developmental phenotyping
For growth biomass measurements, aboveground parts of 4- or 6-week-old pre-flowering plants were weighed, and representative plants were photographed. For flowering time measurements, the first instance of floral appearance for each individual plant was recorded.
BTH and flg22 treatments
Arabidopsis plants were infiltrated or sprayed with mock (0.1% DMSO), benzo(1,2,3)thiadiazole-7-carbothioic acid-S-methyl ester (BTH; Chem Service, 100 µM, 0.1% DMSO) or flg22 peptide (EZBiolab, 200 nM in 0.1% DMSO). For tomato or rapeseed, 50 µM (rapeseed) or 100 µM (tomato) of BTH solution (0.02% Silwet L-77 and 0.1% DMSO) or solvent control was sprayed. Plants were further incubated for 24 h. For rice, 200 µM of BTH solution (0.1% Silwet L-77 and 0.1% DMSO) or solvent control was sprayed. Rice plants were further incubated for 24 h and their 4th leaves were used for analyses.
Basal disease-resistance assay
Plants were infiltrated with 0.5 to 1.5 × 10⁶ CFU ml−1 (OD600 = 0.0005; for Arabidopsis) or 0.5 to 1.5 × 10⁵ CFU ml−1 (OD600 = 0.00005; for rapeseed) of Pst DC3000, 0.5 to 1.5 × 10⁸ CFU ml−1 of Pst DC3000 ΔhrcC (OD600 = 0.05; for Arabidopsis) or 0.5 to 1.5 × 10⁶ CFU ml−1 of P. syringae (Ps) pv. tabaci 11528 (for tobacco) as described previously15. Plants were returned to growth chambers at the appropriate temperature and 60% relative humidity. Bacterial levels were measured as previously described15,47.
ETI assay
Plants were dipped in 0.5 to 1.5 × 10⁸ CFU ml−1 of Pst DC3000(avrPphB)48 and Pst DC3000(avrRps4)49 (OD600 = 0.05) as described previously24,47. Plants were left at room temperature for 1 h with a cover dome to maintain high humidity and then returned to the growth chamber without covering at either 23 °C or 28 °C (60% relative humidity). Bacterial growth was measured as described in the previous section.
Gene expression analyses
RNA extraction and quantitative PCR analyses were performed as described previously15. Twenty to sixty milligrams of fresh leaf tissues were flash-frozen in liquid nitrogen and ground using a TissueLyser (Qiagen). Plant RNA was extracted using a Qiagen Plant RNeasy Mini Kit following the manufacturer’s protocol, including on-column DNase I digestion. cDNA was synthesized by adding 100–300 ng of RNA to a solution of oligo-dT primers, dNTPs and M-MLV reverse transcriptase (Invitrogen). Approximately 1.5 ng of cDNA was mixed with the appropriate primers (Supplementary Table 4) and SYBR master mix (Applied Biosystems). Quantitative PCR (qPCR) was run on a 7500 Fast Real-Time PCR system or QuantStudio 3 Real-Time PCR system (Applied Biosystems), with 2–4 biological replicates (and 3 technical replicates for each biological replicate) per experimental treatment. StepOnePlus (Applied Biosystems) was used for data acquisition and analysis. Gene expression values were calculated as described previously15 with the following internal controls: PP2AA3 (Arabidopsis), SlARD2 (tomato), OsUBC (rice), NtAct (tobacco) and BnaGDI1 (rapeseed). RT–qPCR primer sequences are listed in Supplementary Table 4.
Transcriptome analyses
For RNA-seq in Fig. 1, Arabidopsis Col-0 plants were inoculated with mock (0.25 mM MgCl2) or Pst DC3000 suspension, and then incubated at 23 °C or 30 °C for 24 h. For RNA-seq in Fig. 3, Arabidopsis Col-0 and 35S::CBP60g were inoculated with Pst DC3000 suspension, and then incubated at 23 °C or 28 °C for 24 h. Total RNA was extracted as described above. RNA samples for each treatment were checked for quality and cDNA libraries were prepared, as described previously15. All 12 libraries per experiment were pooled in equimolar amounts for multiplexed sequencing. Pools were quantified using the Kapa Biosystems Illumina Library Quantification qPCR kit, and loaded on one lane (Fig. 1) or two lanes (Fig. 3) of Illumina HiSeq 4000 Rapid Run flow cells. RNA-seq and analyses were performed as described previously15. For Fig. 1, results were filtered for Pst DC3000-induced or -repressed genes using a pathogen/mock fold change > 2. Temperature-downregulated, neutral and upregulated target genes were analysed for Gene Ontology (GO) enrichment using the Database for Annotation, Visualization and Integrated Discovery50 (DAVID; https://david.ncifcrf.gov/). For Fig. 3, results were further filtered for genes with RPKM values above 1 and 23 °C/28 °C RPKM ratios with at least twofold change. Filtered genes were grouped into four clusters. Cluster 1 had genes more downregulated at 28 °C in Col-0 (that is, Col/35S::CBP60g ratios of 23 °C/28 °C RPKM values > 2). Cluster 2 had genes more upregulated at 28 °C in Col-0 (that is, Col/35S::CBP60g ratios of 23 °C/28 °C RPKM values < 0.5). Cluster 3 had genes similarly downregulated, whereas cluster 4 had genes similarly upregulated in Col-0 and 35S::CBP60g, respectively (that is, Col/35S::CBP60g ratios of 23 °C/28 °C RPKM values between 2 and 0.5). GO enrichment analyses were also conducted using DAVID50.
Hormone profiling
Plant hormones were extracted and quantified using a previously described protocol15, with minor modifications. Methanolic extraction was performed with abscisic acid (ABA)-d6, SA-d4 or SA-13C6 as an internal control. Filtered extracts were analysed using an Acquity Ultra Performance Liquid Chromatography system coupled to a Quattro Premier XE MS/MS (Waters) or a 1260 infinity High Performance Liquid Chromatography system coupled to a 6460 Triple Quadrupole mass spectrometer (Agilent). Column temperature was set at 40 °C with a 0.4 ml min−1 flow rate and a gradient of mobile phases water + 0.1% formic acid (A) and methanol (B) was used as follows: 0–0.5 min 2% B; 0.5–3 min 70% B; 3.5–4.5 100% B; 4.51–6 min 2% B; followed by additional 1 min for equilibration. Eluted analytes were introduced into Agilent jet stream electro spray ionization ion source and analysed in negative ion mode with delta EMV (–) of 200. The following parameters were used for the mass spectrometer source: gas temperature, 300 °C; gas flow, 5 min−1; nebulizer, 45 psi; sheath gas temperature, 250 °C; sheath gas flow, 11 l min−1; capillary voltage, 3,500 V; nozzle voltage, 500 V. The following parameters were used for data acquisition in multiple reaction monitoring (MRM) mode: dwell time, 50 ms; cell accelerator voltage, 4 V; fragmentor voltage, 90 V and collision energy, 16 V for SA and SA-d4; fragmentor voltage, 130 V and collision energy, 9 V for ABA-d6. The following MRM transitions were monitored: SA (m/z 137→93), SA-d4 (m/z 141→97) and ABA-d6 (m/z 269.1→159.1). Peak selection and integration of acquired MRM data files was done using QuanLynx v4.1 software (Waters) or Quantitative Analysis (for QQQ) program in MassHunter software (Agilent). Analyte levels were calculated as previously indicated15.
Nuclear–cytoplasmic fractionation
Approximately 0.1–0.2 g of ground plant tissues (pre-frozen, stored at −80 °C for less than 1 week) were dissolved in nuclei isolation buffer (20 mM Tris-Cl pH 7.5, 25% glycerol, 20 mM KCl, 2.5 mM MgCl2, 2 mM EDTA, 250 mM sucrose, 1× protease inhibitor cocktail (Roche)) on ice (NPR1–YFP protein analysis) or at 23 °C or 28 °C (GBPL3 protein analysis). After removing debris by filtering with two layers of Miracloth (Millipore), collected extracts were centrifuged at 1,000g for 10 min at cold room or at 23 °C or 28 °C using a temperature-controlled centrifuge. Supernatants were collected as the cytosolic fraction and pellets were suspended in nuclei washing buffer (nuclei isolation buffer supplemented with 0.1 % Triton X-100) (Sigma-Aldrich) by gentle tapping and centrifuged at 1,000g for 10 min at 4 °C. After washing twice, pellets were resuspended in nuclei isolation buffer and collected as nuclear fractions, which were further used for analysis.
Chromatin immunoprecipitation
ChIP was performed as previously reported51, with some modifications. Collected fresh leaf tissues were fixed (1% formaldehyde in 1× phosphate buffered saline (PBS)) by vacuum infiltration and incubated for 10–15 min to crosslink at room temperature. After quenching the remaining fixation solution with 125 mM glycine solution for 5 min, plant tissues were flash-frozen in liquid nitrogen and ground by mortar and pestle. Six-hundred milligrams of ground powder were dissolved in 2 ml of nuclei isolation buffer and crude extracts were filtered with two layers of Miracloth (Millipore). To collect nuclei, the filtrate was centrifuged at 10,000g at 4 °C for 5 min and the pellet was suspended in 75 µl of nuclei lysis buffer (50 mM Tris pH 8.0, 10 mM EDTA pH 8.0, 1% SDS). After 30 min incubation on ice, 625 µl of ChIP dilution buffer (16.7 mM Tris pH 8.0, 167 mM NaCl, 1.2 mM EDTA, 1.1% Triton X-100, 0.01% SDS) were added and the samples were sonicated for 1 min in the cold room using Sonic Dismembrator (Thermo Fisher) or 5–6 min using Bioruptor (Diagenode). After adding 200 µl of ChIP dilution buffer and 100 µl of 10% Triton X-100, samples were spun at full speed for 5 min to remove debris. For pre-clearing, samples were incubated with 25 µl of magnetic protein A or G beads (Thermo Fisher) for 2 h in the cold room. Twenty microlitres of samples were removed as 2% input samples. To capture the DNA–protein complex, antibodies (Supplementary Table 5) were used for immunoprecipitation and samples were incubated (with rotation) overnight in the cold room using a tube rotator. After washing, DNA samples were recovered using elution buffer and incubated overnight at 65 °C to remove crosslinking. DNA samples were collected and purified using a QIAquick PCR Purification Kit (Qiagen). ChIP–qPCR was performed as described in ‘Gene expression analyses’. ChIP–qPCR primer sequences are listed in Supplementary Table 4.
Immunoblot
Ground plant tissues (0.2 g per 1 ml LDS buffer (Genscript)) or fractionated protein samples (1:1 v/v) were mixed with 2× LDS buffer in the presence or absence of 2-mercaptoethanol (Sigma-Aldrich) and boiled at 70 °C for 5 min. After removing debris by centrifugation, protein samples were resolved using SDS–PAGE (SurePAGE, Genscript) and transferred to PDVF membrane (Millipore) using a wet transfer system (Bio-Rad; transfer buffer from Thermo Scientific) for further analysis. Transferred blot was incubated in PBS-T (1× PBS, 0.05 % Tween-20) supplemented with 5% non-fat dried milk for 1h and relevant proteins were detected using specific antibodies. Chemiluminescence from blots was generated after adding Supersignal West dura or West femto substrate (Thermo Scientific) and detected by a ChemiDoc MP imaging system (Bio-Rad) or iBright CL 1500 (Thermo Scientific). Relative protein quantification was performed using iBright CL 1500 (Thermo Scientific) and FIJI/ImageJ software (win64 1.52i version). Experimental conditions for antibodies are in Supplementary Table 5.
Confocal laser scanning microscopy and image analysis of Arabidopsis and tobacco cells
Images were acquired with the Zeiss confocal laser scanning microscopy 880 system and Zen black software (Carl Zeiss). Pre-treated leaves of 4- to 5-week-old plants (35S::eGFP-GBPL3) were imaged with an inverted Zeiss 880 single point scanning confocal attached to a fully motorized Zeiss Axio Observer microscope base, with Marzhauser linearly encoded stage and a 63× NA 1.4 oil plan apochromatic oil immersion objective lens. Images were acquired by frame (line) scanning unidirectionally at 0.24 microseconds using the galvanometer-based imaging mode, with a voxel size of 0.22 µm × 0.22 µm × 1 µm and an area size of 224.92 µm × 224.92 µm × 1 µm µm in Zeiss Zen Black Acquisition software and saved as CZI files. eGFP and chlorophyll was excited at 488 nm excitation laser from argon laser source and detected at 490–526 or 653–683 nm, respectively. Equal acquisition conditions (for example, excitation laser source intensity, range of acquired emission light range and exposure condition) were used for every image in each experiment. To maintain appropriate temperature during experiments, a portable temperature chamber and temperature-controlled specimen chamber of confocal microscope were used. To analyse images, FIJI/ImageJ software (Windows 64 1.52i version) was used.
Prediction of intrinsically disordered region of A. thaliana MED15
The A. thaliana MED15 protein (encoded by At1g15780) disordered region was calculated with the Predictor of Natural Disordered Regions online tool (http://www.pondr.com/). The MED15 amino acid sequence was obtained from The Arabidopsis Information Resource (TAIR; https://www.arabidopsis.org/).
Experimental design and statistical analysis of dataset
Sample size and statistical analyses are described in the relevant figure legends. Sample size was determined based on previous publications with similar experiments to allow for sufficient statistical analyses. There were no statistical methods used to predetermine sample sizes. Three to four plants (biological replicates) per genotype per treatment were analysed per individual experiment. Plants of different genotypes were grown side by side in environmentally controlled growth chambers (light, temperature, humidity) to control other covariates and to minimize unexpected environmental variations. Leaf samples of similar ages were collected and assessed randomly for each genotype. Researchers were not blinded to allocation during experiments and outcome assessment. This is in part because different plant genotypes, temperatures and treatments investigated exhibit quite distinct and obvious phenotypes visually; thus, blinding was not possible in these cases. Routine practices included more than one author observing/assessing phenotypes, whenever possible. Three or more independent experiments were performed for all assays, unless specified otherwise. The following statistical analyses were employed: (1) Student’s t-test with Bonferroni test for significance was used for pairwise comparisons; (2) one-way analysis of variance (ANOVA) with Bartlett’s test for significance was used for multi-sample experiments with one variable; and (3) two-way ANOVA followed by Tukey’s honest significant difference test was used for multi-variable analyses. Statistical tests are described in the figure legends. Bar graphs and dot plots were generated with GraphPad Prism 9 and show the mean ± s.d. or mean ± s.e.m. and individual data points.
Graphic design
Figs. 1a, 2f and 4f and Extended Data Fig. 7a were created in part using BioRender.com.
Reporting summary
Further information on research design is available in the Nature Research Reporting Summary linked to this paper.
Online content
Any methods, additional references, Nature Research reporting summaries, source data, extended data, supplementary information, acknowledgements, peer review information; details of author contributions and competing interests; and statements of data and code availability are available at 10.1038/s41586-022-04902-y.
Supplementary information
This file contains Supplementary Fig. 1 and Supplementary Tables 1–5.
RNA-seq reads of the mock- and Pst DC3000-inoculated Arabidopsis Col-0 plants at normal and elevated temperature.
Supplementary Data 2 Pst DC3000- and temperature-regulated gene clusters.
RNA-seq reads of the Pst DC3000-inoculated Arabidopsis Col-0 and 35S::CBP60g plants at 23 °C and 28 °C.
List of genes that are differentially regulated between Col-0 and 35S::CBP60g.
Acknowledgements
We thank G. Li and D. Wan for 35S::CBP60g OE-16 and 35S::CBP60g OE-17; X. Dong for npr1S11D/S15D; Y. Zhang for npr3 npr4; C. Lagarias for 35S::PHYBY276H; P. Wigge for BdELF3-OE; J. Parker for 35S::EDS1; J. Shah and Z. Chen for 35S::PAD4; D. Yu and L. Chen for 35S::WRKY75; M. Thomashow for camta2/3; J. Zeier for bsmt1; T. Mengiste for 35S::CDK8-myc; Z. Mou for MED16pro::MED16; G. Howe for Castlemart tomato; B. Day for Pst DC3000/avrPphB; B. Staskawicz Pst DC3000/avrRps4; Michigan State University (MSU) Growth Chamber, Genomics, Metabolomics Facilities and Duke Phytotron for technical assistance; and L. Zhang and S. Withers for critically reading the manuscript. This work was supported by the Natural Sciences and Engineering Research Council of Canada (C.D.M.C.), Korean Research Foundation Postdoctoral Fellowship (J.H.K.), National Institutes of Health T32 Predoctoral Fellowship (A.S.), Howard Hughes Medical Institute Exceptional Research Opportunities Fellowship (D.M.-Y.), National Natural Science Foundation of China (T.C.) and MSU Plant Resilience Institute and Duke Science and Technology Initiative (S.Y.H.). J.D.M and S.Y.H. are investigators of the Howard Hughes Medical Institute.
Extended data figures and tables
Source data
Author contributions
C.D.M.C., J.H.K. and S.Y.H. conceived the project and designed the experiments. C.D.M.C. and J.H.K. performed most of the experiments. S.H. and J.D.M. were involved in GBPL3 condensation assays and contributed reagents. C.L. and T.C. performed stable CBP60g transgenic expression and analyses in rapeseed. R.H. was involved in confocal microscopy experiments. A.S., R.S., D.M.-Y. and B.H. were involved in gene expression analyses and hormone measurements. J.W. analysed RNA-seq data. K.N. was involved in ETI experiments. S.K.M. generated the 35S::ICS1 plants. J.D.M., M.C.W. and T.C. supervised S.H., S.K.M. and C.L., respectively. C.D.M.C., J.H.K. and S.Y.H. wrote the manuscript with input from all authors.
Peer review
Peer review information
Nature thanks Cesar L. Cuevas-Velazquez, Yuelin Zhang and the other, anonymous, reviewers for their contribution to the peer review of this work.
Data availability
RNA-seq datasets are publicly available in the Gene Expression Omnibus under accessions GSE152072 and GSE197771). Source data are provided with this paper.
Competing interests
The authors declare no competing interests.
Footnotes
Publisher’s note Springer Nature remains neutral with regard to jurisdictional claims in published maps and institutional affiliations.
These authors contributed equally: Jong Hum Kim, Christian Danve M. Castroverde
Contributor Information
Christian Danve M. Castroverde, Email: dcastroverde@wlu.ca
Sheng Yang He, Email: shengyang.he@duke.edu.
Extended data
is available for this paper at 10.1038/s41586-022-04902-y.
Supplementary information
The online version contains supplementary material available at 10.1038/s41586-022-04902-y.
References
- 1.Glazebrook J. Contrasting mechanisms of defense against biotrophic and necrotrophic pathogens. Annu. Rev. Phytopathol. 2005;43:205–227. doi: 10.1146/annurev.phyto.43.040204.135923. [DOI] [PubMed] [Google Scholar]
- 2.Fu ZQ, Dong X. Systemic acquired resistance: turning local infection into global defense. Annu. Rev. Plant Biol. 2013;64:839–863. doi: 10.1146/annurev-arplant-042811-105606. [DOI] [PubMed] [Google Scholar]
- 3.Peng Y, Yang J, Li X, Zhang Y. Salicylic acid: biosynthesis and signaling. Annu. Rev. Plant Biol. 2021;72:761–791. doi: 10.1146/annurev-arplant-081320-092855. [DOI] [PubMed] [Google Scholar]
- 4.Castroverde CDM, Dina D. Temperature regulation of plant hormone signaling during stress and development. J. Exp. Bot. 2021;72:7436–7458. doi: 10.1093/jxb/erab257. [DOI] [PubMed] [Google Scholar]
- 5.Velásquez AC, Castroverde CDM, He SY. Plant–pathogen warfare under changing climate conditions. Curr. Biol. 2018;28:R619–R634. doi: 10.1016/j.cub.2018.03.054. [DOI] [PMC free article] [PubMed] [Google Scholar]
- 6.Hua J. From freezing to scorching, transcriptional responses to temperature variations in plants. Curr. Opin. Plant Biol. 2009;12:568–573. doi: 10.1016/j.pbi.2009.07.012. [DOI] [PubMed] [Google Scholar]
- 7.Saijo Y, Loo EP. Plant immunity in signal integration between biotic and abiotic stress responses. New Phytol. 2020;225:87–104. doi: 10.1111/nph.15989. [DOI] [PubMed] [Google Scholar]
- 8.Jung JH, et al. Phytochromes function as thermosensors in Arabidopsis. Science. 2016;354:886–889. doi: 10.1126/science.aaf6005. [DOI] [PubMed] [Google Scholar]
- 9.Legris M, et al. Phytochrome B integrates light and temperature signals in Arabidopsis. Science. 2016;354:897–900. doi: 10.1126/science.aaf5656. [DOI] [PubMed] [Google Scholar]
- 10.Jung JH, et al. A prion-like domain in ELF3 functions as a thermosensor in Arabidopsis. Nature. 2020;585:256–260. doi: 10.1038/s41586-020-2644-7. [DOI] [PubMed] [Google Scholar]
- 11.Huang S, Zhu S, Kumar P, MacMicking JD. A phase-separated nuclear GBPL circuit controls immunity in plants. Nature. 2021;594:424–429. doi: 10.1038/s41586-021-03572-6. [DOI] [PMC free article] [PubMed] [Google Scholar]
- 12.Zheng Q, Majsec K, Katagiri F. Pathogen-driven coevolution across the CBP60 plant immune regulator subfamilies confers resilience on the regulator module. New Phytol. 2022;233:479–495. doi: 10.1111/nph.17769. [DOI] [PubMed] [Google Scholar]
- 13.Bruessow F, et al. Natural variation in temperature-modulated immunity uncovers transcription factor bHLH059 as a thermoresponsive regulator in Arabidopsis thaliana. PLoS Genet. 2021;17:e1009290. doi: 10.1371/journal.pgen.1009290. [DOI] [PMC free article] [PubMed] [Google Scholar]
- 14.Li Z, et al. Low temperature enhances plant immunity via salicylic acid pathway genes that are repressed by ethylene. Plant Physiol. 2020;182:626–639. doi: 10.1104/pp.19.01130. [DOI] [PMC free article] [PubMed] [Google Scholar]
- 15.Huot B, et al. Dual impact of elevated temperature on plant defence and bacterial virulence in Arabidopsis. Nat. Commun. 2017;8:1808. doi: 10.1038/s41467-017-01674-2. [DOI] [PMC free article] [PubMed] [Google Scholar]
- 16.Gangappa SN, Berriri S, Kumar SV. PIF4 coordinates thermosensory growth and immunity in Arabidopsis. Curr. Biol. 2017;27:243–249. doi: 10.1016/j.cub.2016.11.012. [DOI] [PMC free article] [PubMed] [Google Scholar]
- 17.Malamy J, Hennig J, Klessig DF. Temperature-dependent induction of salicylic acid and its conjugates during the resistance response to tobacco mosaic virus infection. Plant Cell. 1992;4:359–366. doi: 10.1105/tpc.4.3.359. [DOI] [PMC free article] [PubMed] [Google Scholar]
- 18.Havko NE, et al. Insect herbivory antagonizes leaf cooling responses to elevated temperature in tomato. Proc. Natl Acad. Sci. USA. 2020;117:2211–2217. doi: 10.1073/pnas.1913885117. [DOI] [PMC free article] [PubMed] [Google Scholar]
- 19.Kim JH, Hilleary R, Seroka A, He SY. Crops of the future: building a climate-resilient plant immune system. Curr. Opin. Plant Biol. 2021;60:101997. doi: 10.1016/j.pbi.2020.101997. [DOI] [PMC free article] [PubMed] [Google Scholar]
- 20.Bailey-Serres J, Parker JE, Ainsworth EA, Oldroyd GED, Schroeder JI. Genetic strategies for improving crop yields. Nature. 2019;575:109–118. doi: 10.1038/s41586-019-1679-0. [DOI] [PMC free article] [PubMed] [Google Scholar]
- 21.Wildermuth MC, Dewdney J, Wu G, Ausubel FM. Isochorismate synthase is required to synthesize salicylic acid for plant defence. Nature. 2001;414:562–565. doi: 10.1038/35107108. [DOI] [PubMed] [Google Scholar]
- 22.Cheng C, et al. Plant immune response to pathogens differs with changing temperatures. Nat. Commun. 2013;4:2530. doi: 10.1038/ncomms3530. [DOI] [PMC free article] [PubMed] [Google Scholar]
- 23.Samaradivakara, S. P. et al. Overexpression of NDR1 leads to pathogen resistance at elevated temperatures. New Phytol.10.1111/nph.18190 (2022) [DOI] [PMC free article] [PubMed]
- 24.Wang Y. Analysis of temperature modulation of plant defense against biotrophic microbes. Mol. Plant Microbe Interact. 2009;22:498–506. doi: 10.1094/MPMI-22-5-0498. [DOI] [PubMed] [Google Scholar]
- 25.Zhu Y, Qian W, Hua J. Temperature modulates plant defense responses through NB-LRR proteins. PLoS Pathog. 2010;6:e1000844. doi: 10.1371/journal.ppat.1000844. [DOI] [PMC free article] [PubMed] [Google Scholar]
- 26.Ding Y, et al. Opposite roles of salicylic acid receptors NPR1 and NPR3/NPR4 in transcriptional regulation of plant immunity. Cell. 2018;173:1454–1467. doi: 10.1016/j.cell.2018.03.044. [DOI] [PubMed] [Google Scholar]
- 27.Saleh A, et al. Posttranslational modifications of the master transcriptional regulator NPR1 enable dynamic but tight control of plant immune responses. Cell Host Microbe. 2015;18:169–182. doi: 10.1016/j.chom.2015.07.005. [DOI] [PMC free article] [PubMed] [Google Scholar]
- 28.Zhou J-M, Zhang Y. Plant immunity: danger perception and signaling. Cell. 2020;181:978–989. doi: 10.1016/j.cell.2020.04.028. [DOI] [PubMed] [Google Scholar]
- 29.Wang L, et al. Arabidopsis CaM binding protein CBP60g contributes to MAMP-induced SA accumulation and is involved in disease resistance against Pseudomonas syringae. PLoS Pathog. 2009;5:e1000301. doi: 10.1371/journal.ppat.1000301. [DOI] [PMC free article] [PubMed] [Google Scholar]
- 30.Zhang Y, et al. Control of salicylic acid synthesis and systemic acquired resistance by two members of a plant-specific family of transcription factors. Proc. Natl Acad. Sci. USA. 2010;107:18220–18225. doi: 10.1073/pnas.1005225107. [DOI] [PMC free article] [PubMed] [Google Scholar]
- 31.Sun T, et al. ChIP–seq reveals broad roles of SARD1 and CBP60g in regulating plant immunity. Nat. Commun. 2015;6:10159. doi: 10.1038/ncomms10159. [DOI] [PMC free article] [PubMed] [Google Scholar]
- 32.Mou Z, Fan W, Dong X. Inducers of plant systemic acquired resistance regulate NPR1 function through redox changes. Cell. 2003;113:935–944. doi: 10.1016/s0092-8674(03)00429-x. [DOI] [PubMed] [Google Scholar]
- 33.Zhang X, Wang C, Zhang Y, Sun Y, Mou Z. The Arabidopsis mediator complex subunit 16 positively regulates salicylate-mediated systemic acquired resistance and jasmonate/ethylene-induced defense pathways. Plant Cell. 2012;24:4294–4309. doi: 10.1105/tpc.112.103317. [DOI] [PMC free article] [PubMed] [Google Scholar]
- 34.Chen J, et al. NPR1 promotes its own and target gene expression in plant defense by recruiting CDK8. Plant Physiol. 2019;181:289–304. doi: 10.1104/pp.19.00124. [DOI] [PMC free article] [PubMed] [Google Scholar]
- 35.Wang L, et al. CBP60g and SARD1 play partially redundant critical roles in salicylic acid signaling. Plant J. 2011;67:1029–1041. doi: 10.1111/j.1365-313X.2011.04655.x. [DOI] [PubMed] [Google Scholar]
- 36.Jones JDG, Vance RE, Dangl JL. Intracellular innate immune surveillance devices in plants and animals. Science. 2016;354:aaf6395. doi: 10.1126/science.aaf6395. [DOI] [PubMed] [Google Scholar]
- 37.Huot B, Yao J, Montgomery BL, He SY. Growth–defense tradeoffs in plants: a balancing act to optimize fitness. Mol. Plant. 2014;7:1267–1287. doi: 10.1093/mp/ssu049. [DOI] [PMC free article] [PubMed] [Google Scholar]
- 38.Tan S, et al. Salicylic acid targets protein phosphatase 2A to attenuate growth in plants. Curr. Biol. 2020;30:381–395.e8. doi: 10.1016/j.cub.2019.11.058. [DOI] [PMC free article] [PubMed] [Google Scholar]
- 39.Xu G, et al. uORF-mediated translation allows engineered plant disease resistance without fitness costs. Nature. 2017;545:491–494. doi: 10.1038/nature22372. [DOI] [PMC free article] [PubMed] [Google Scholar]
- 40.Fang X, et al. Arabidopsis FLL2 promotes liquid–liquid phase separation of polyadenylation complexes. Nature. 2019;569:265–269. doi: 10.1038/s41586-019-1165-8. [DOI] [PMC free article] [PubMed] [Google Scholar]
- 41.Dorone Y, et al. A prion-like protein regulator of seed germination undergoes hydration-dependent phase separation. Cell. 2021;184:4284–4298. doi: 10.1016/j.cell.2021.06.009. [DOI] [PMC free article] [PubMed] [Google Scholar]
- 42.Clough SJ, Bent AF. Floral dip: a simplified method for Agrobacterium-mediated transformation of Arabidopsis thaliana. Plant J. 1998;16:735–743. doi: 10.1046/j.1365-313x.1998.00343.x. [DOI] [PubMed] [Google Scholar]
- 43.Zhou Y, et al. Control of petal and pollen development by the plant cyclin-dependent kinase inhibitor ICK1 in transgenic Brassica plants. Planta. 2002;215:248–257. doi: 10.1007/s00425-002-0752-2. [DOI] [PubMed] [Google Scholar]
- 44.Mang HG, et al. Abscisic acid deficiency antagonizes high-temperature inhibition of disease resistance through enhancing nuclear accumulation of resistance proteins SNC1 and RPS4 in Arabidopsis. Plant Cell. 2012;24:1271–1284. doi: 10.1105/tpc.112.096198. [DOI] [PMC free article] [PubMed] [Google Scholar]
- 45.Yan J, et al. Cell autonomous and non-autonomous functions of plant intracellular immune receptors in stomatal defense and apoplastic defense. PLoS Pathog. 2019;15:e1008094. doi: 10.1371/journal.ppat.1008094. [DOI] [PMC free article] [PubMed] [Google Scholar]
- 46.Hammoudi V, et al. The Arabidopsis SUMO E3 ligase SIZ1 mediates the temperature dependent trade-off between plant immunity and growth. PLoS Genet. 2018;14:e1007157. doi: 10.1371/journal.pgen.1007157. [DOI] [PMC free article] [PubMed] [Google Scholar]
- 47.Katagiri F, Thilmony R, He SY. The Arabidopsis thaliana–Pseudomonas syringae interaction. Arabidopsis. 2002;1:e0039. doi: 10.1199/tab.0039. [DOI] [PMC free article] [PubMed] [Google Scholar]
- 48.Simonich MT, Innes RW. A disease resistance gene in Arabidopsis with specificity for the avrPph3 gene of Pseudomonas syringae pv. phaseolicola. Mol. Plant Microbe Interact. 1995;8:637–640. doi: 10.1094/mpmi-8-0637. [DOI] [PubMed] [Google Scholar]
- 49.Hinsch M, Staskawicz BJ. Identification of a new Arabidopsis disease resistance locus, RPS4, and cloning of the corresponding avirulence gene, avrRps4, from Pseudomonas syringae pv. Pisi. Mol. Plant Microbe Interact. 1996;9:55–61. doi: 10.1094/mpmi-9-0055. [DOI] [PubMed] [Google Scholar]
- 50.Huang DW, Sherman BT, Lempicki RA. Systematic and integrative analysis of large gene lists using DAVID bioinformatics resources. Nat. Protoc. 2009;4:44–57. doi: 10.1038/nprot.2008.211. [DOI] [PubMed] [Google Scholar]
- 51.Yamaguchi, N. et al. Protocols: chromatin immunoprecipitation from Arabidopsis tissues. Arabidopsis Book12, e0170 (2014). [DOI] [PMC free article] [PubMed]
Associated Data
This section collects any data citations, data availability statements, or supplementary materials included in this article.
Supplementary Materials
This file contains Supplementary Fig. 1 and Supplementary Tables 1–5.
RNA-seq reads of the mock- and Pst DC3000-inoculated Arabidopsis Col-0 plants at normal and elevated temperature.
Supplementary Data 2 Pst DC3000- and temperature-regulated gene clusters.
RNA-seq reads of the Pst DC3000-inoculated Arabidopsis Col-0 and 35S::CBP60g plants at 23 °C and 28 °C.
List of genes that are differentially regulated between Col-0 and 35S::CBP60g.
Data Availability Statement
RNA-seq datasets are publicly available in the Gene Expression Omnibus under accessions GSE152072 and GSE197771). Source data are provided with this paper.


